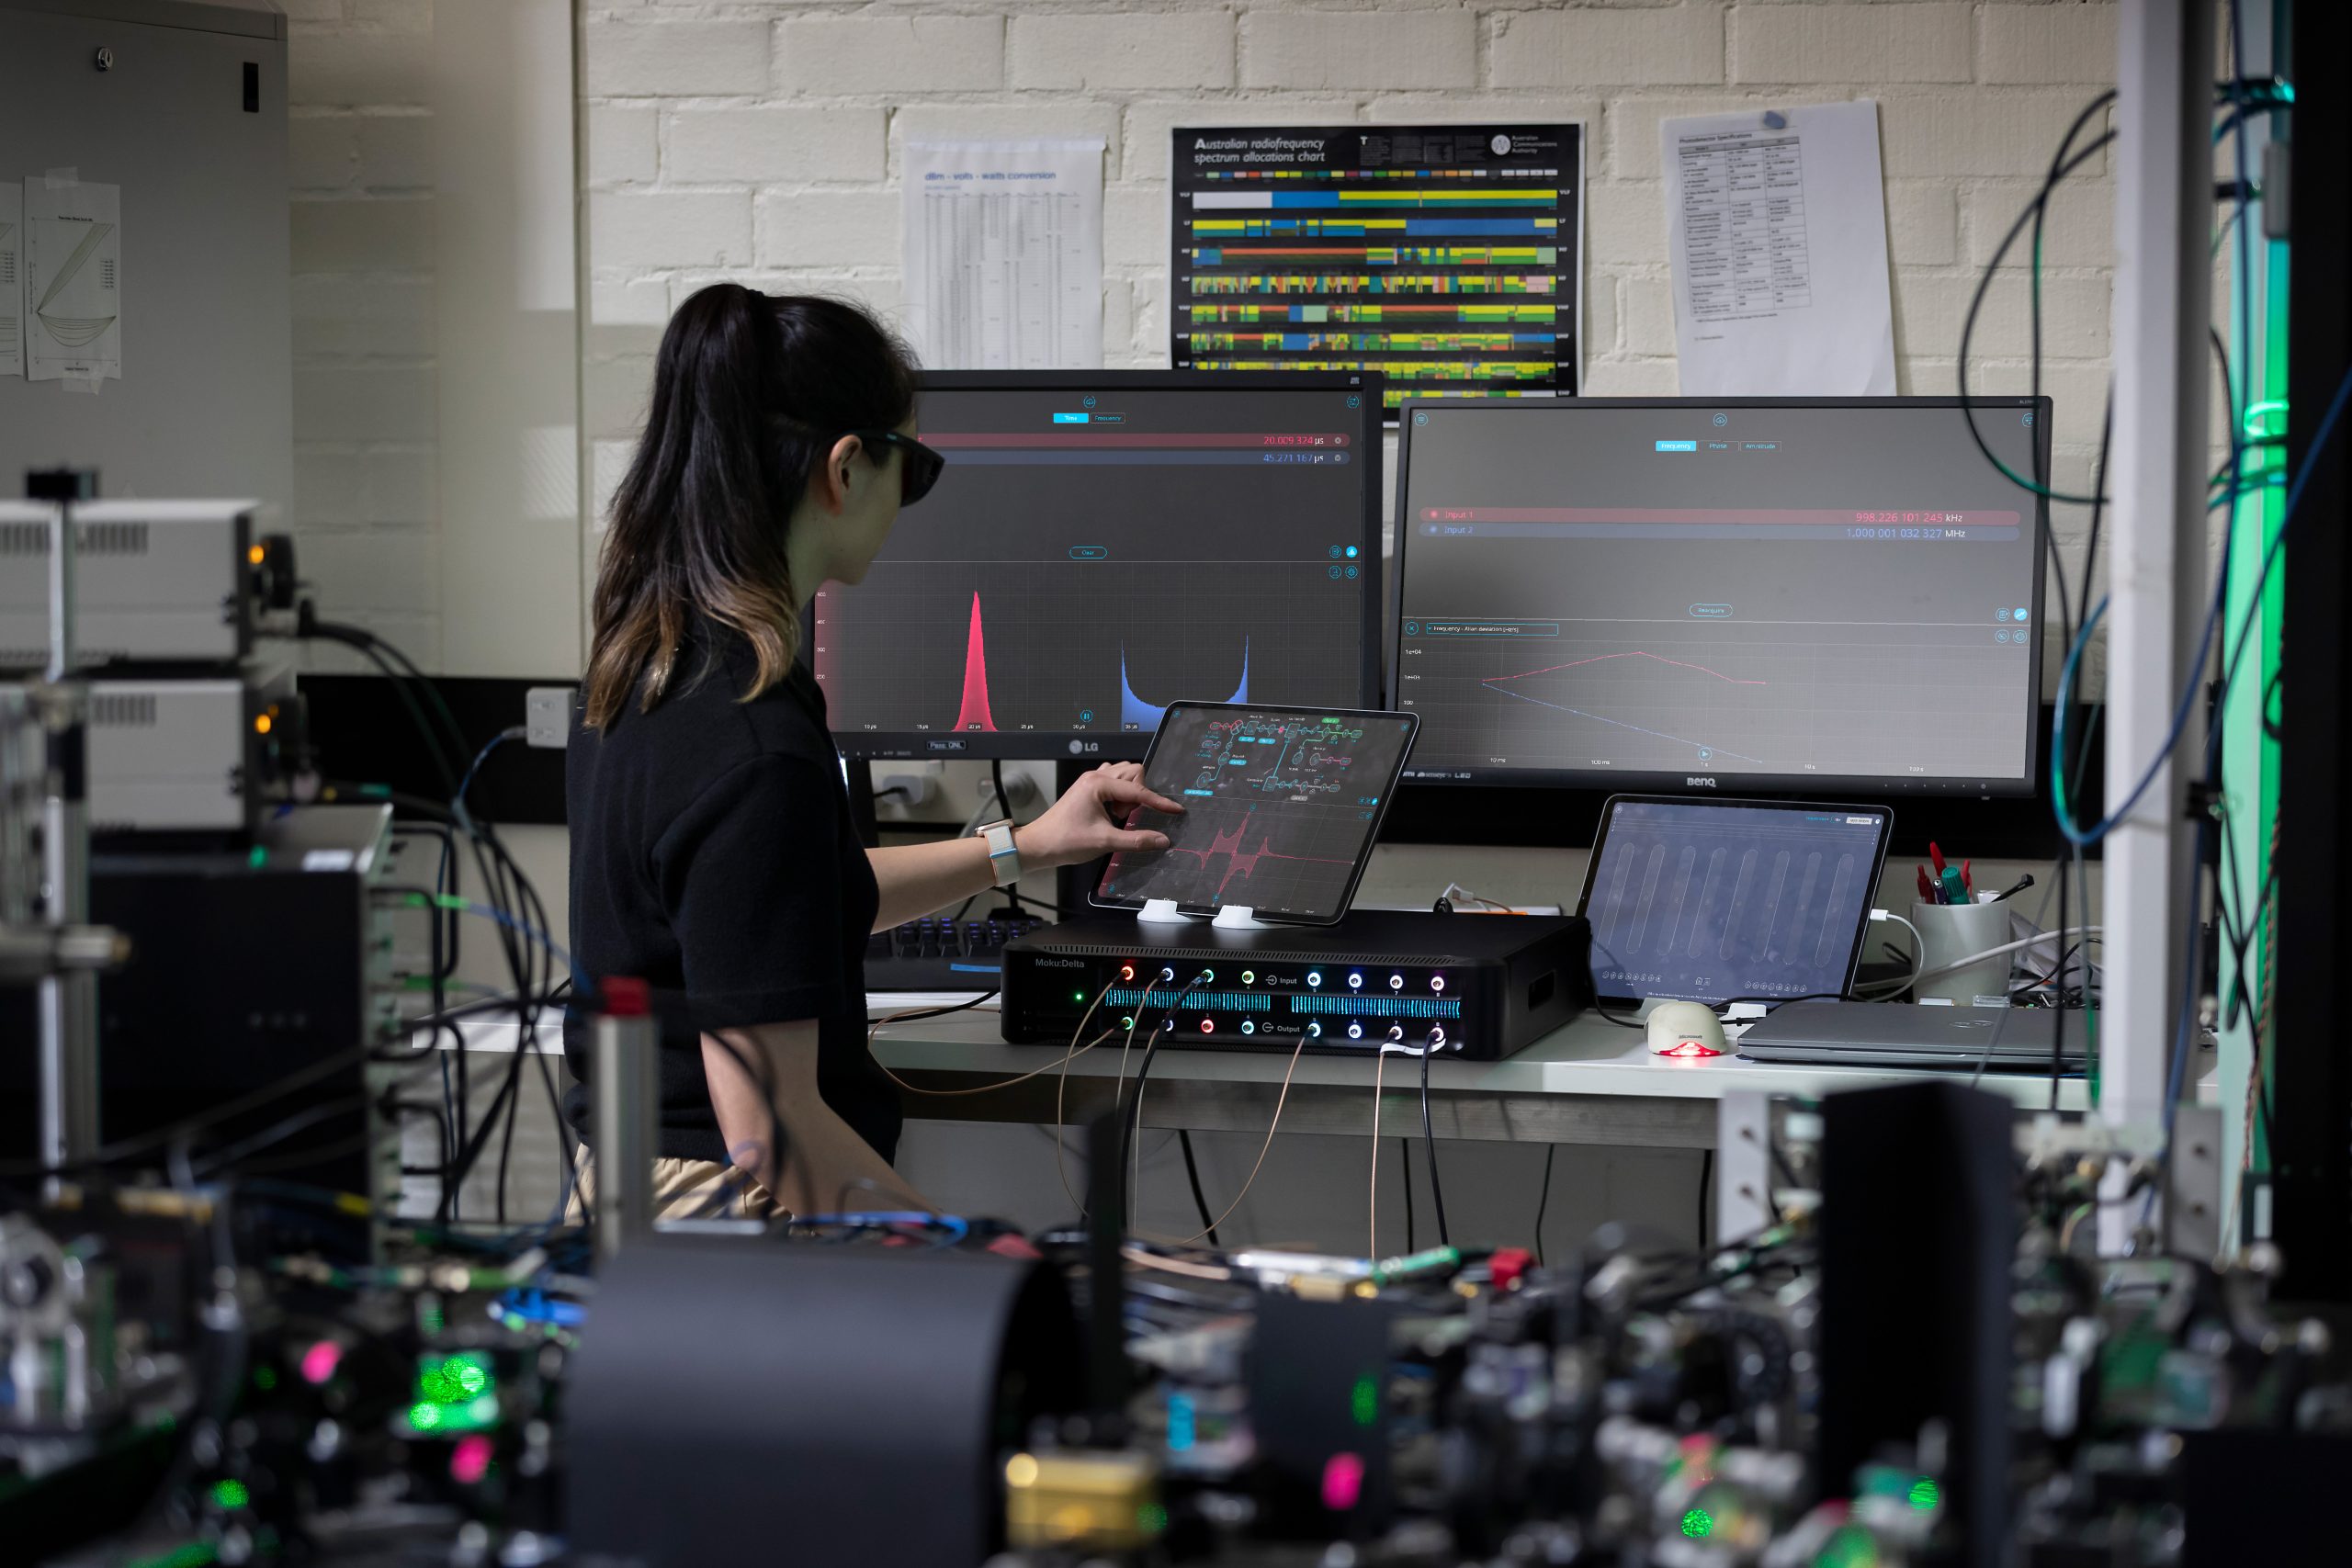
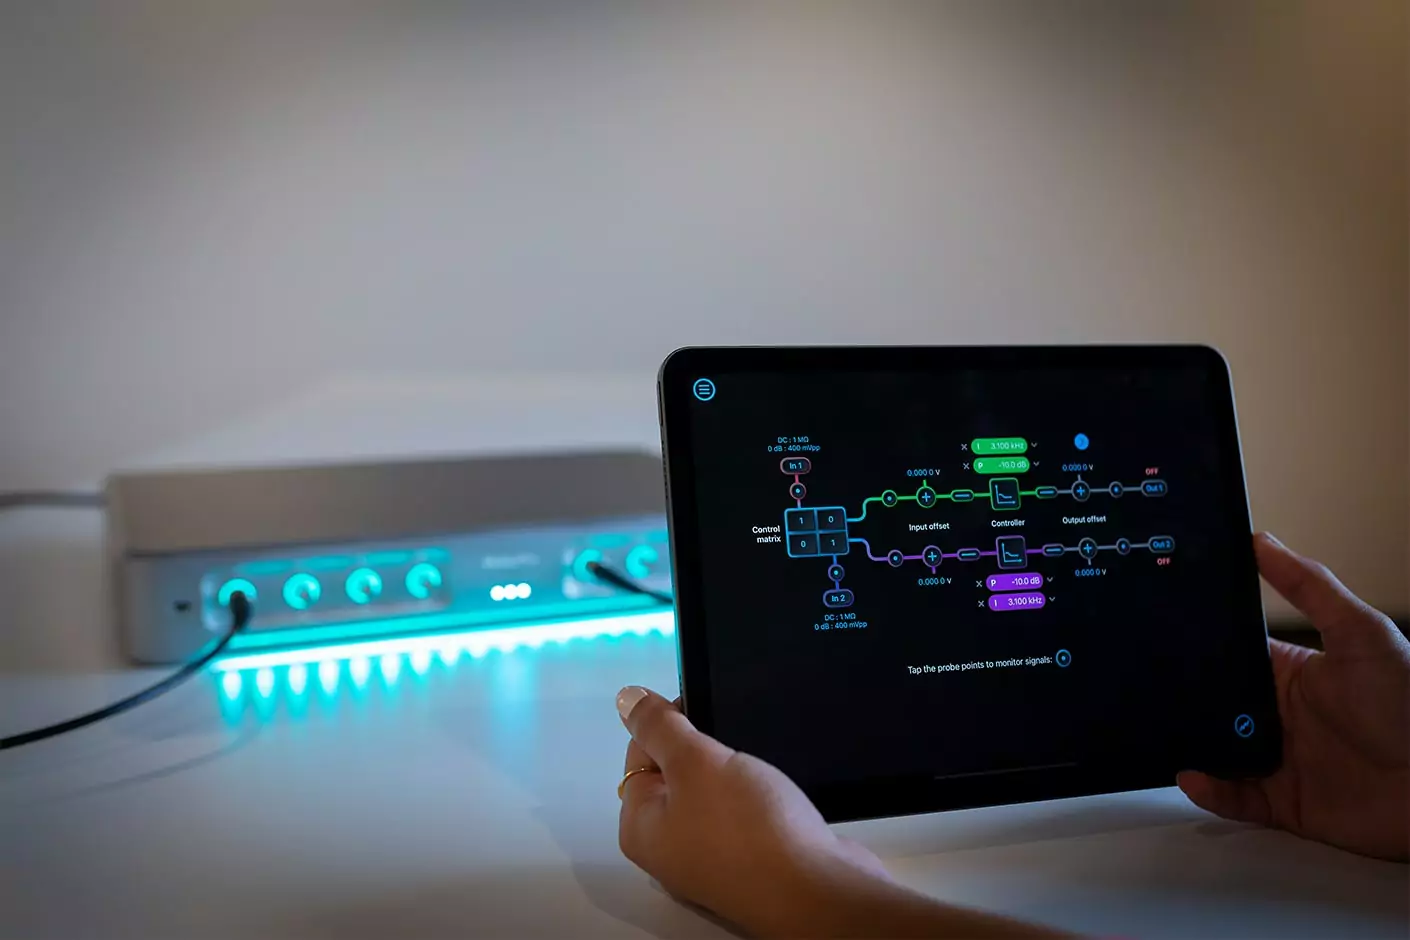
When performing photon detection in Hanbury-Brown-Twiss (HBT) experiments, there are several critical steps to achieving high-quality, meaningful results. By using a Time & Frequency Analyzer, you can analyze interval histograms, view live interval statistics, and characterize your photon source. Follow the steps in this guide to ensure you’re detecting events correctly and analyzing results efficiently.
Register for immediate access
