






Introduction
In the ever-evolving landscape of device test and validation, engineers continually seek innovative ways to enhance efficiency, reduce costs, and adapt to dynamic project demands. One powerful solution to enable streamlined multi-instrument testing is the integration of Multi-instrument Mode for Moku:Pro with LabVIEW, a combination that redefines the capabilities of hardware instrumentation to fit the needs of a modern, digital-first test approach.Automated multi-instrument test platform utilization
Multi-instrument Mode allows the efficient division of FPGA resources into multiple slots, enabling the seamless deployment of up to four instruments concurrently (Figure 1). This scalability streamlines hardware resources while opening the doors to complex testing scenarios that were previously unattainable with standalone instruments. When transitioning from manual to automated testing, software-defined instrumentation bridges the gap between an intuitive user interface for manual intervention and powerful APIs to fully automate repetitive testing and device validation.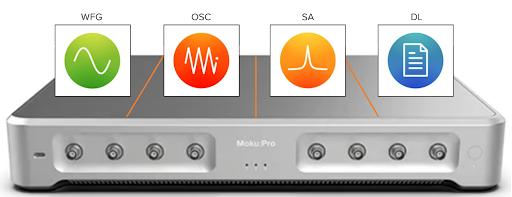
Figure 1: n Multi-instrument Mode, Moku:Pro can deploy the Waveform Generator, Oscilloscope, Spectrum Analyzer, and Data Logger simultaneously to enable real-time signal generation, time-domain analysis, frequency-domain analysis, and data capture.
Implementing the test system via LabVIEW
By utilizing LabVIEW, a common test and measurement programming environment, we can generate, monitor, and control multiple instruments simultaneously while providing real-time access to critical results. Within Multi-instrument Mode, signal routing between instruments occurs internally within the FPGA, ensuring lossless interconnections. In the event that you have a more complex setup with a number of instrument inputs and outputs routing to the analog inputs and outputs, all signal routing can still be done internally. These interconnections can be arbitrarily routed between inputs, outputs, and instruments. In our custom LabVIEW setup (Figure 2), we explore how Multi-instrument Mode seamlessly integrates the software-defined Waveform Generator, Oscilloscope, Spectrum Analyzer, and Data Logger instruments for Moku:Pro. The Waveform Generator generates a test signal, which is routed to the Oscilloscope for time-domain analysis, and simultaneously, the Spectrum Analyzer provides a frequency-domain perspective. The Data Logger efficiently records data for analysis and documentation.
Figure 2: Custom LabVIEW graphical user interface (GUI) to display multiple instrument results in real time.

Figure 3: LabVIEW block diagram to control multiple Moku:Pro instruments.
The key components
The Waveform Generator- This block permits real-time configuration of the test signal’s amplitude and frequency. The generated signal feeds into the Oscilloscope, Spectrum Analyzer, and Data Logger.
- Configure alarms and thresholds for the time-domain display, including voltage thresholds to detect overvoltage events, all while monitoring the signal in real time.
- Customize alarms and thresholds for the frequency-domain display, including frequency thresholds for event detection, with real-time signal monitoring.
- Configure parameters for display and set the system to stop logging data if both alarms are triggered.

Figure 4: Check out Software-defined test: An easier way to automate and validate — a webinar we co-hosted with Electronic Design — to learn more.