






This blog provides a practical guide on tuning a digital PID controller using the unit step response method, leveraging real-time feedback and oscilloscope visualization for efficient adjustments.
When tuning a digital PID controller, you can adjust parameters interactively on a gain plot and observe the response in real time on an embedded oscilloscope. This makes experimentally tuning your controller much easier than in traditional feedback systems, and requires far less calculations from the user. For a detailed guide on frequency-domain control, read our application note.

Figure 1: Typical feedback control system block diagramWhen constructing a feedback control loop as seen in Figure 1, using the block diagram approach can greatly simplify analysis. Figure 1 describes a closed-loop frequency control system, where Xsp represents a set point input, C represents the controller, H represents the system under control, and Xfreq represents the output frequency of the system. In our feedback loop, S represents a sensor to measure our system output. By comparing this output to our desired setpoint, the controller can compensate for changes in the system. This difference between our desired set point and the system output is our error signal, ε. If the sensor output and the set point match, our error signal will be zero. If our output is larger than the desired set point, the error will be negative and cause our controller to reduce the output. There are many ways to tune a feedback control system. In this example, we will outline how to begin tuning a digital PID controller experimentally, by beginning with a unit step input signal, viewing our system unit step response, and adjusting P, I, and D parameters while observing the response to achieve the desired result. To simulate a plant under test, we configure the Moku:Pro in Multi-Instrument Mode (Figure 2), using a 100 Hz, 2nd order low-pass filter in the Digital Filter Box (Figure 3). The Oscilloscope’s embedded waveform generator produces a square wave as our input step signal (Figure 4).
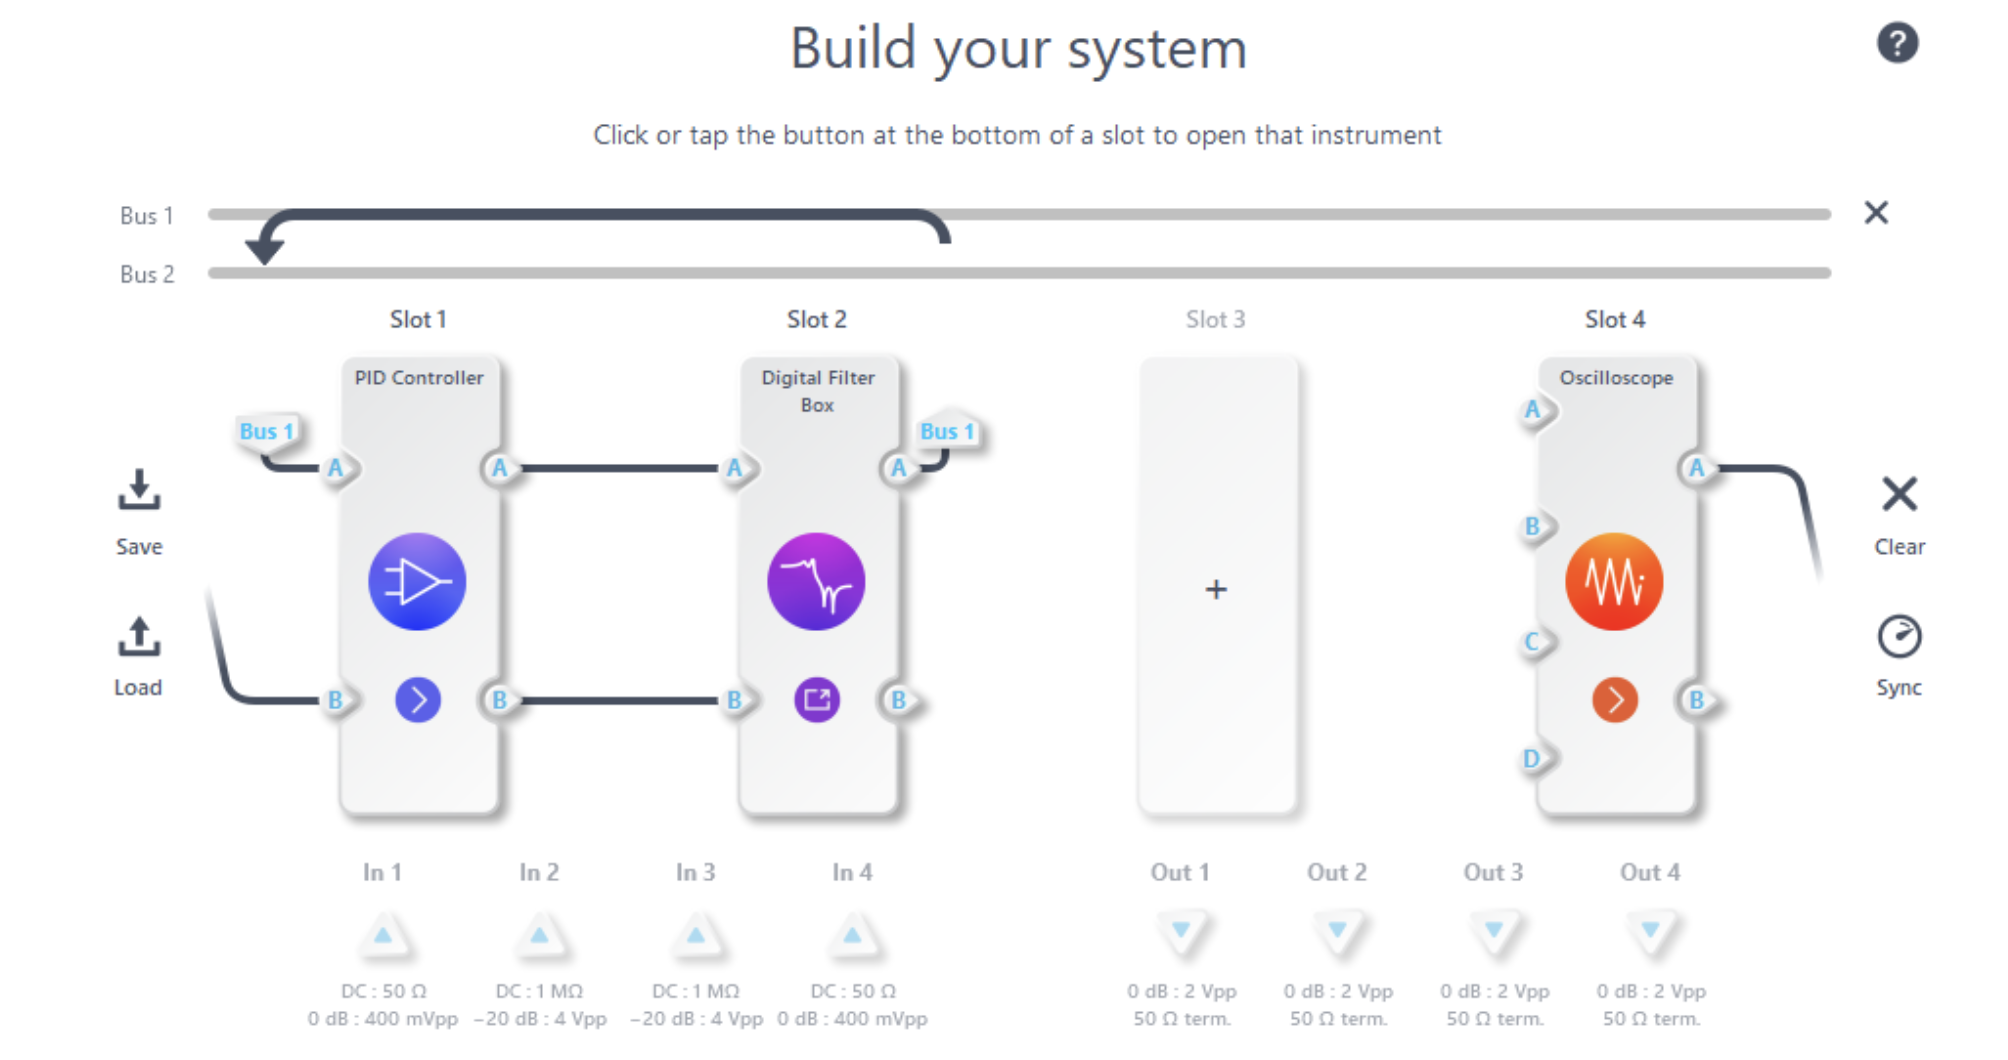
Figure 2: Multi-Instrument Mode configuration to use the Digital Filter Box to simulate a plant
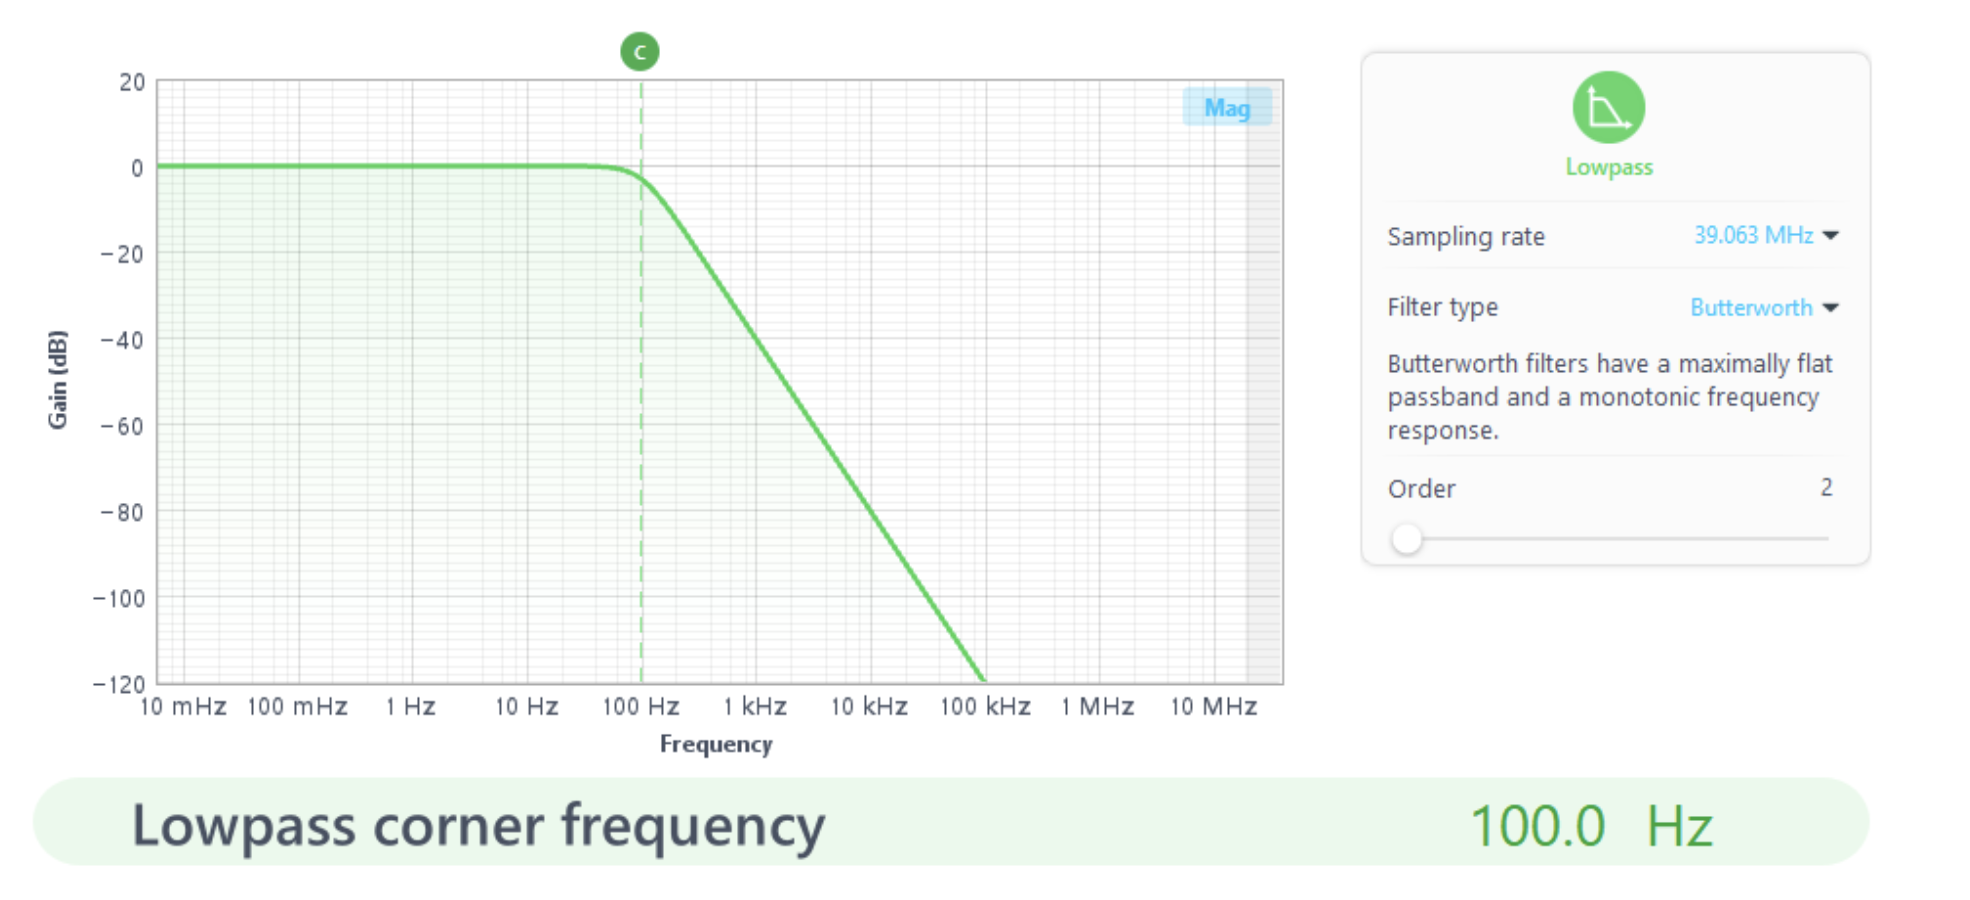
Figure 3: Digital Filter Box low-pass filter configuration
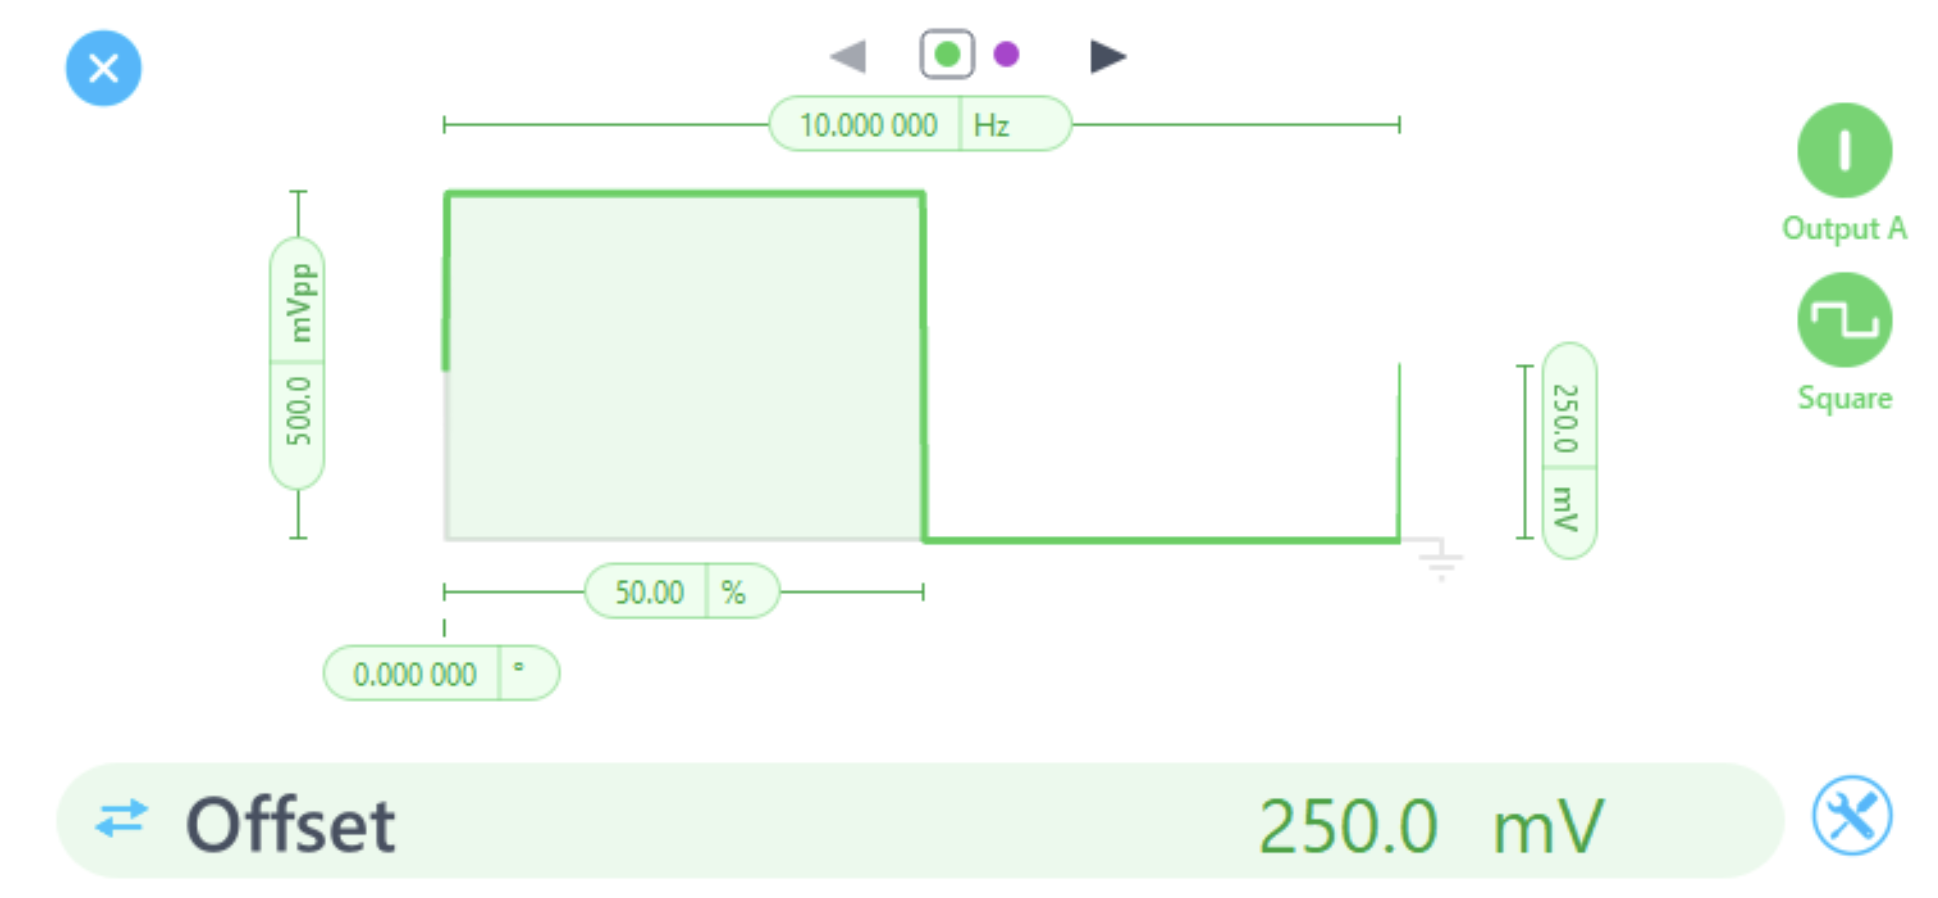
Figure 4: Step signal generation using the embedded Waveform Generator
Set up the system
- Connect the Moku:Pro PID Controller to your system as C, controller, in Figure 1.
- Ensure the input signal, which is the difference between the actual sensor output and the desired set point, Xsp, and output control signal, which is the output of C in Figure 1, are properly configured. To learn more about the input control matrix of the PID Controller, read this Knowledge Base article. Connect the sensor feedback into Input 1 of Moku:Pro. Connect Output 1 of Moku:Pro to the tuning input of your plant, or system under control, H. This tuning input could be for a voltage-controlled oscillator (VCO), laser modulation input, or motor controller.
- Open the gain plot view by clicking on the Controller block for tuning and the embedded Oscilloscope at probe points before and after the controller in the Moku PID Controller, seen in Figure 5.
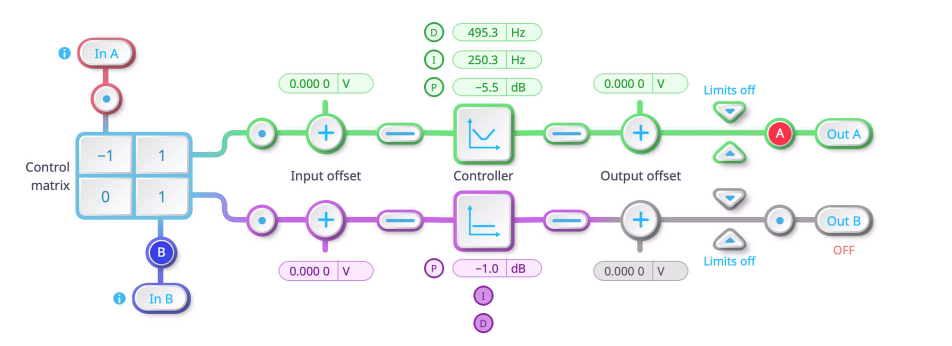
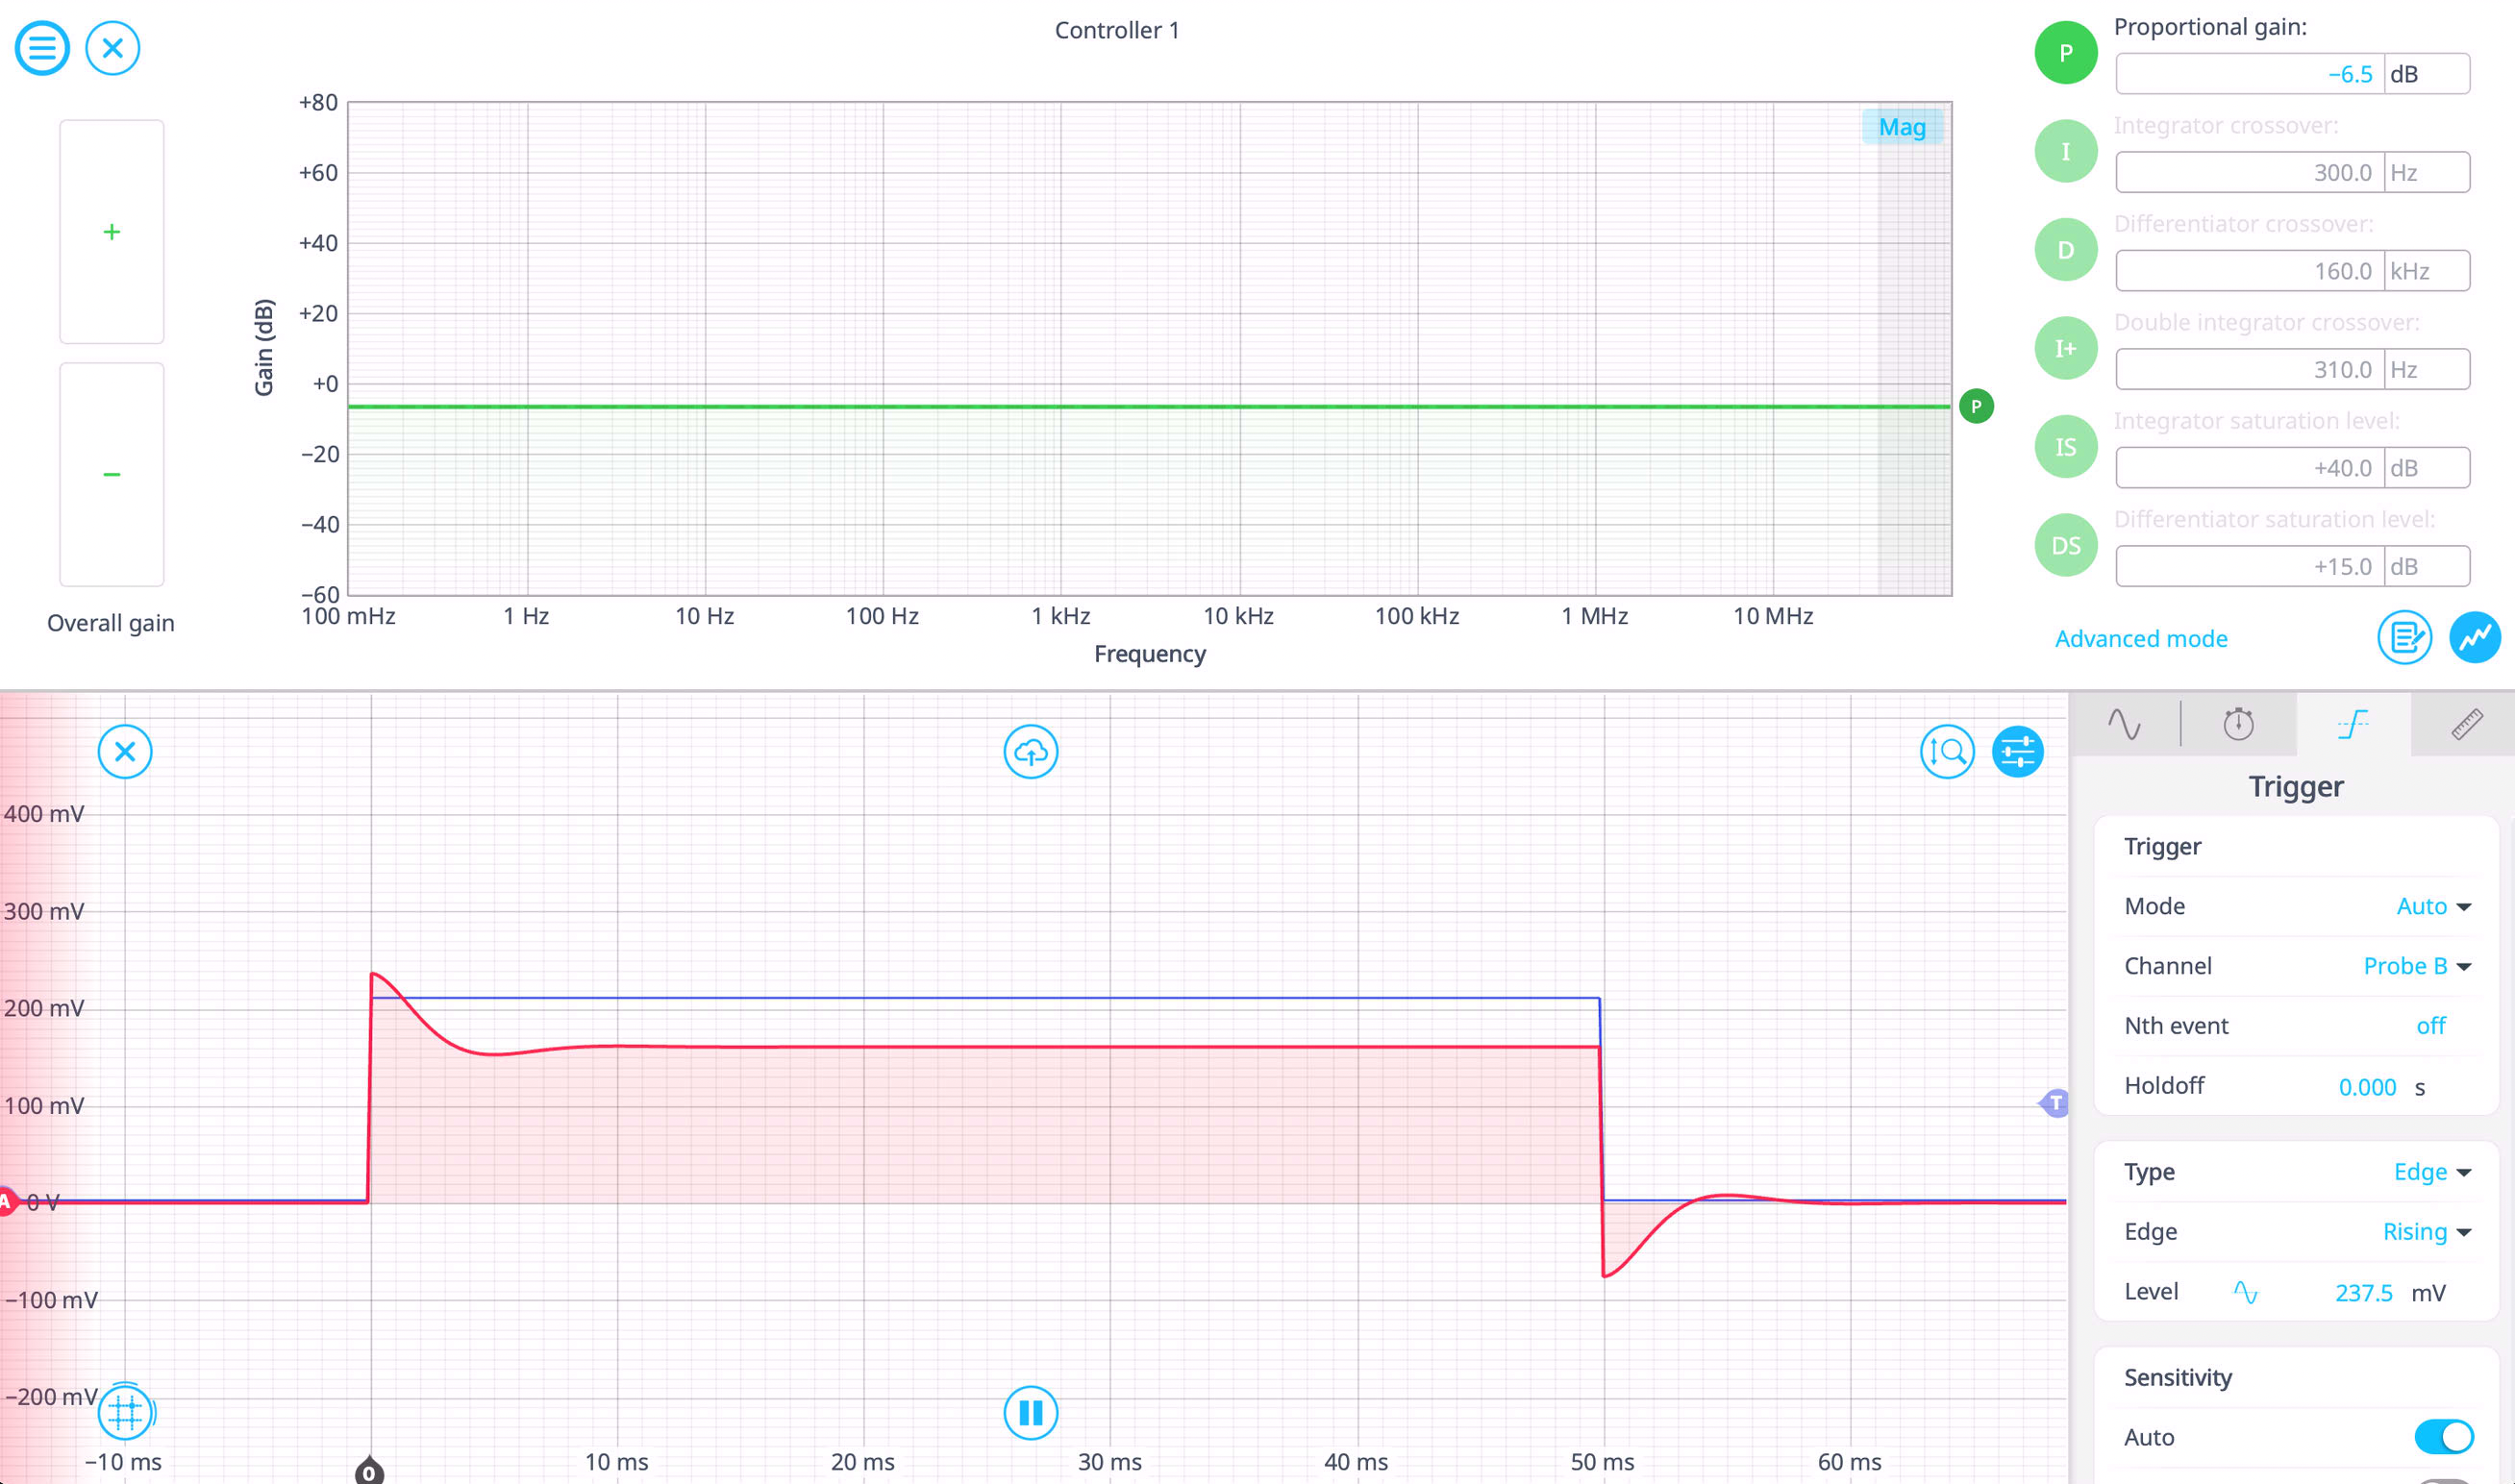
Figure 5: Block diagram view of the Moku PID Controller, top. Gain plot of the Moku PID Controller and the embedded Oscilloscope view, bottom.
Start with Proportional (P)
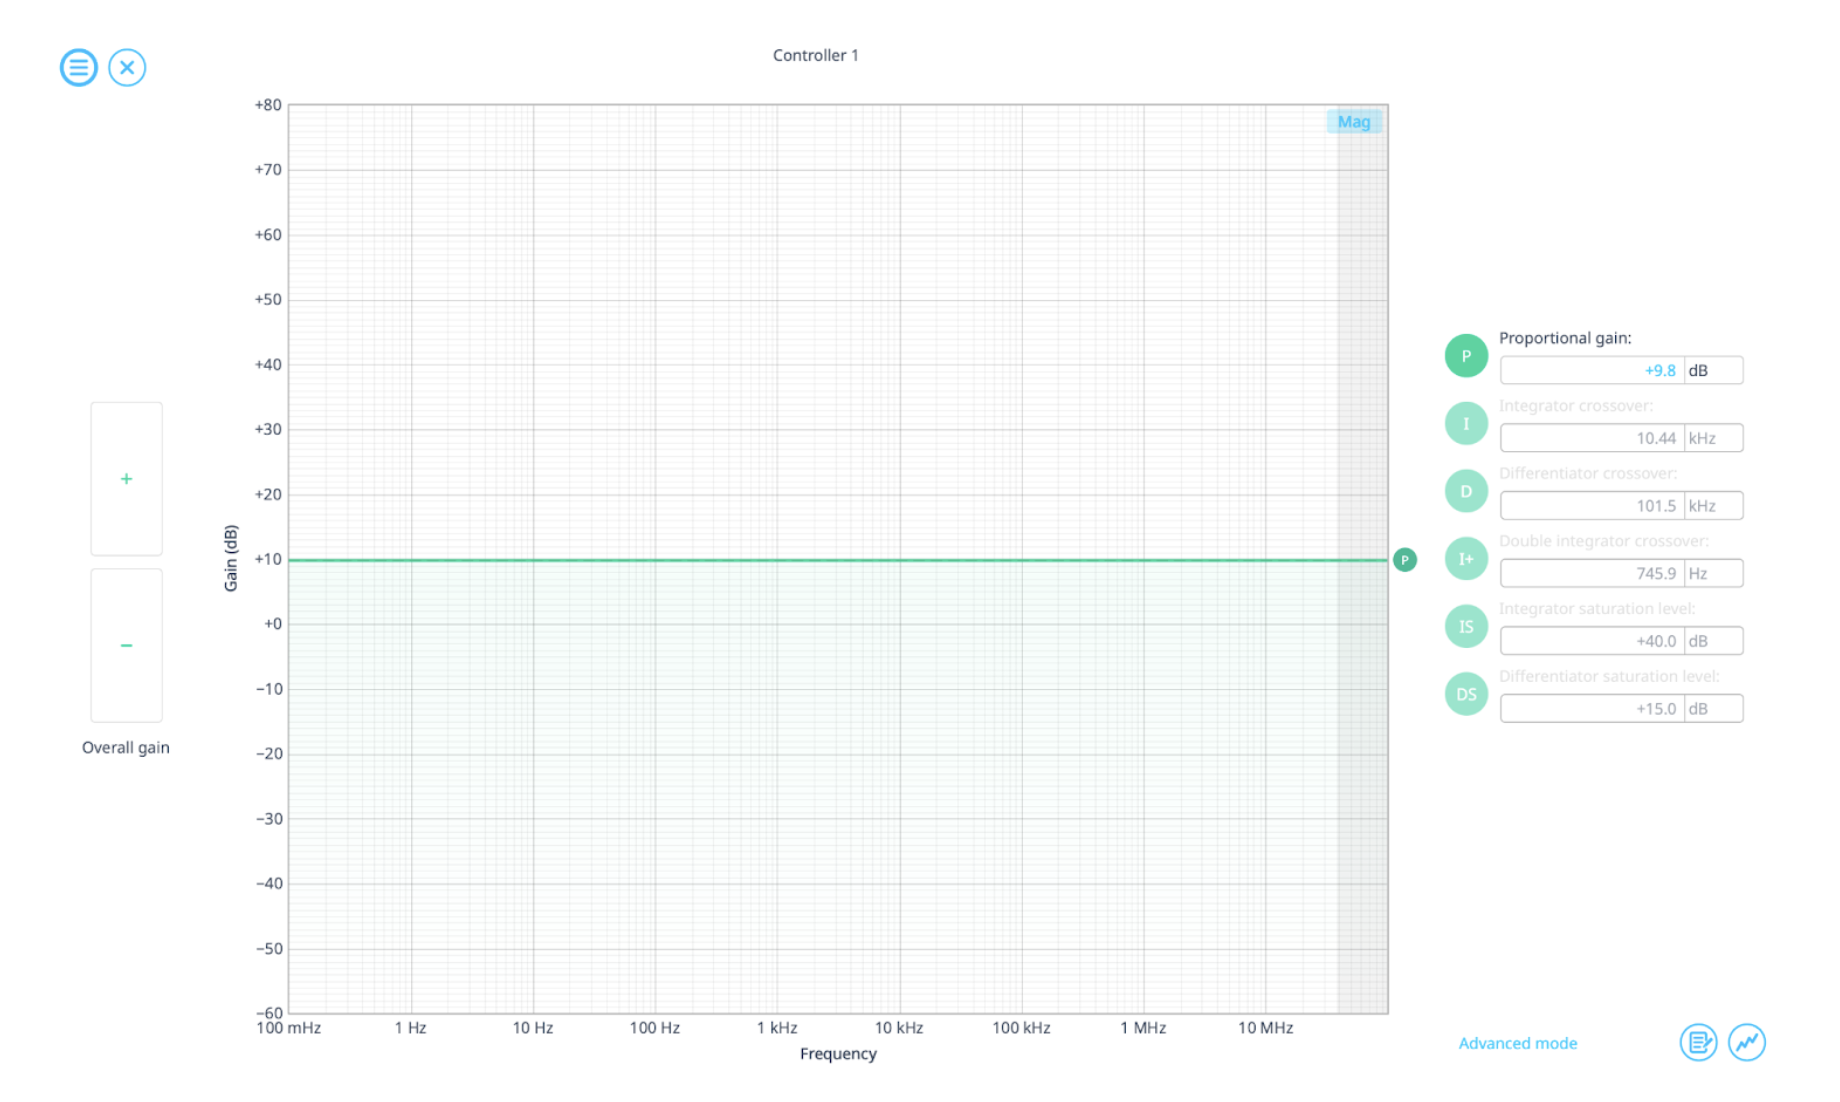
Figure 6: I and D equal to zero, increasing P.
- Disable I and D initially.
- Increase P by dragging it on the gain plot until the system starts responding quickly.
- Watch the oscilloscope output—if the system oscillates too much, reduce P slightly.
Add Integral (I) to remove steady-state error
- Slowly increase I to eliminate any steady-state error, as seen in Figure 7.
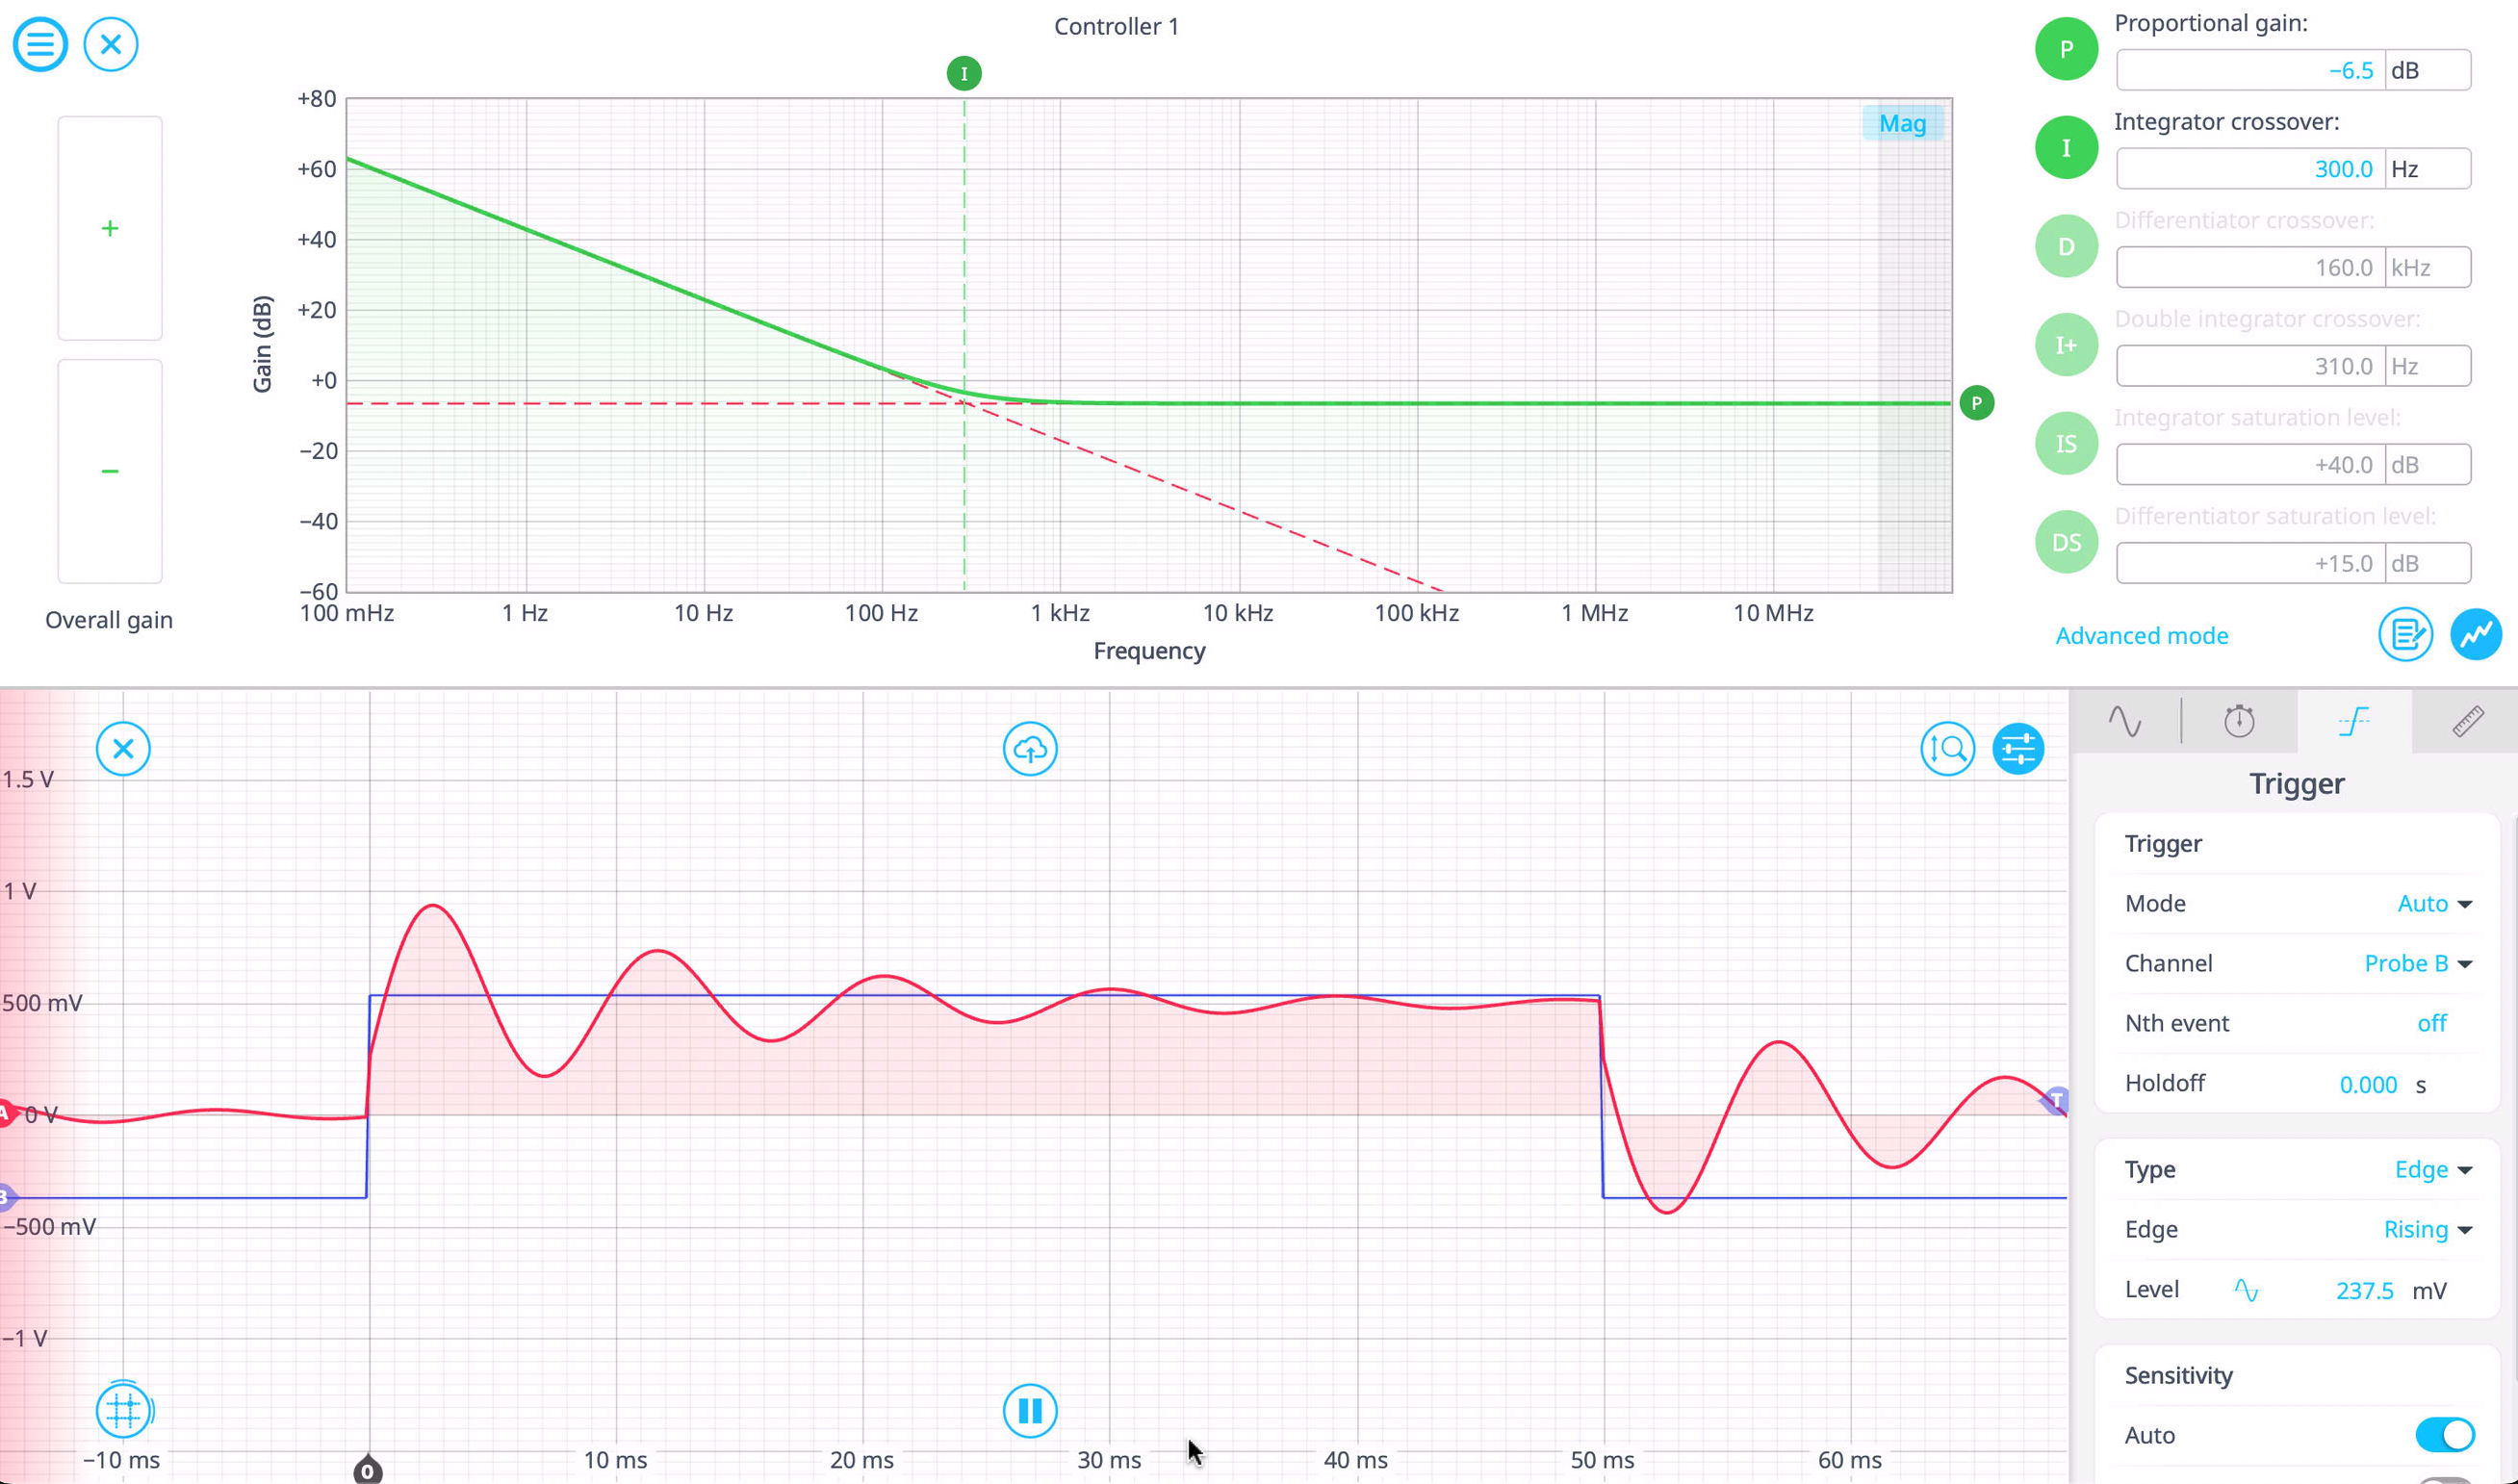
Figure 7: Reduced P, modifying I.
- Monitor the oscilloscope for overshoot—too much I can cause excessive oscillations. In Figure 8, increasing I to 300 Hz causes noticeable oscillations.
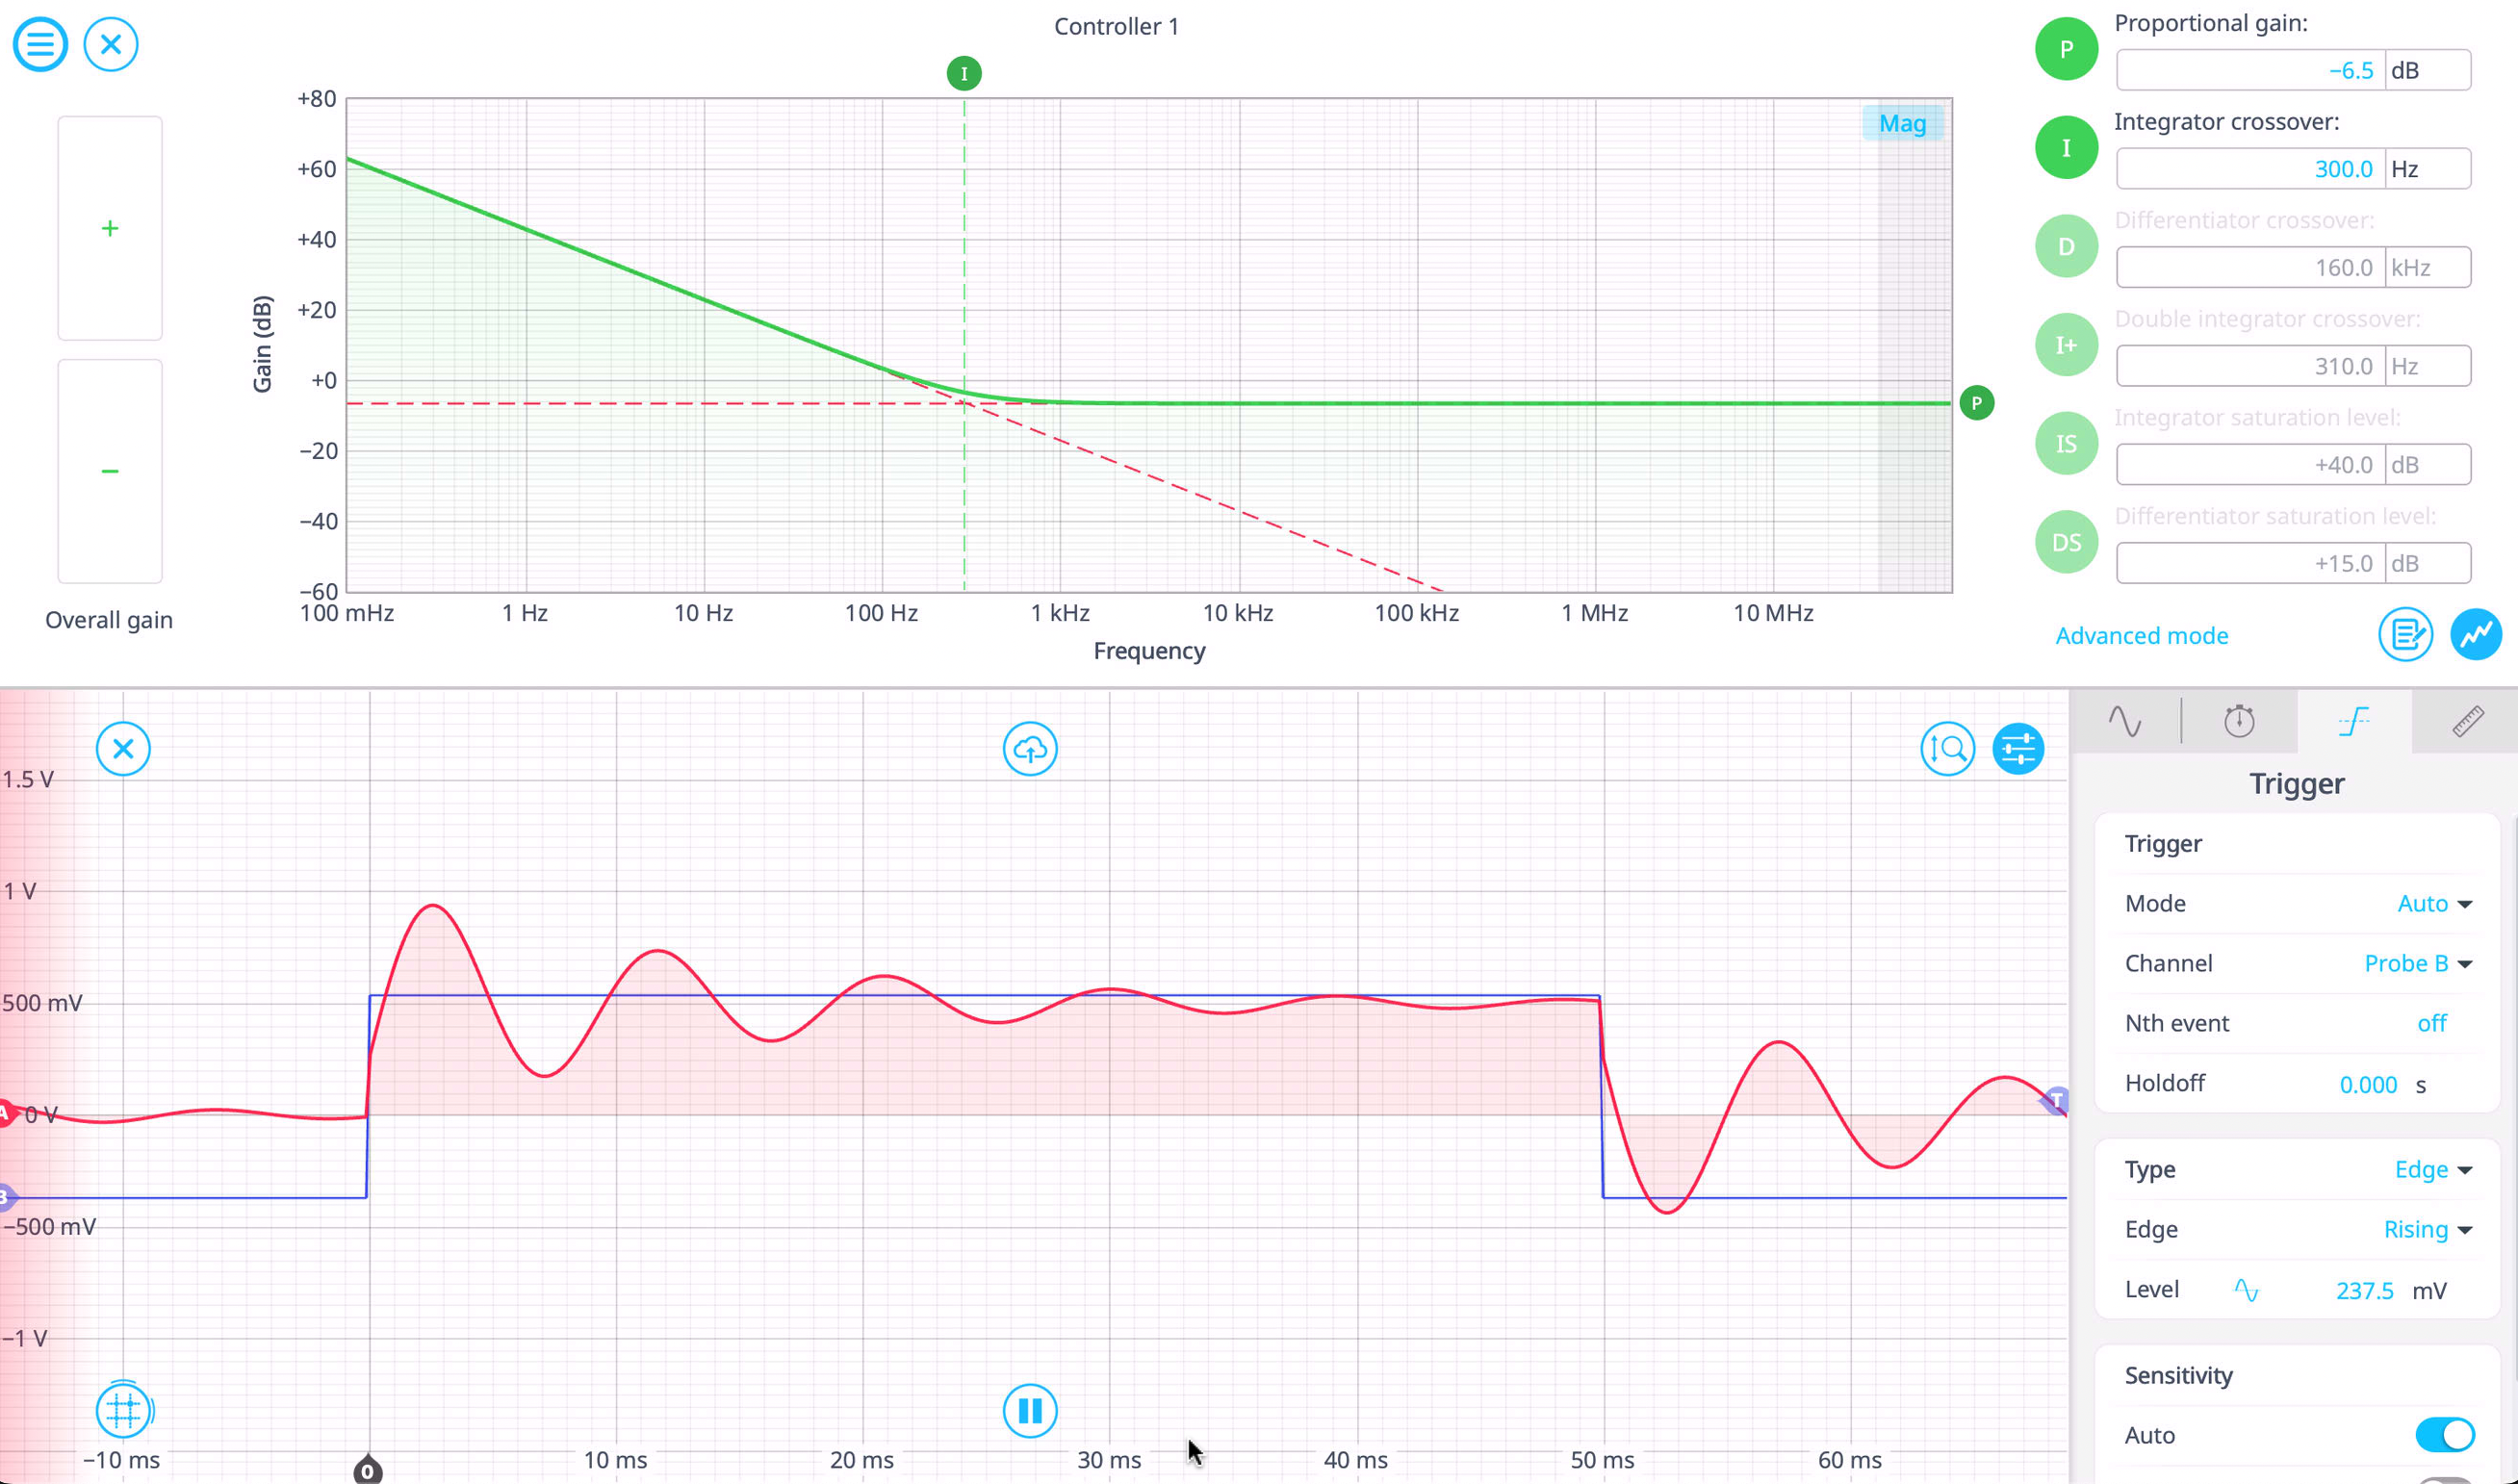
Figure 8: Oscillations increase with increased I.
- If oscillations increase, consider slightly reducing P.
Add Derivative (D) to improve stability
- Gradually increase D to reduce overshoot and dampen oscillations, seen in Figure 9.
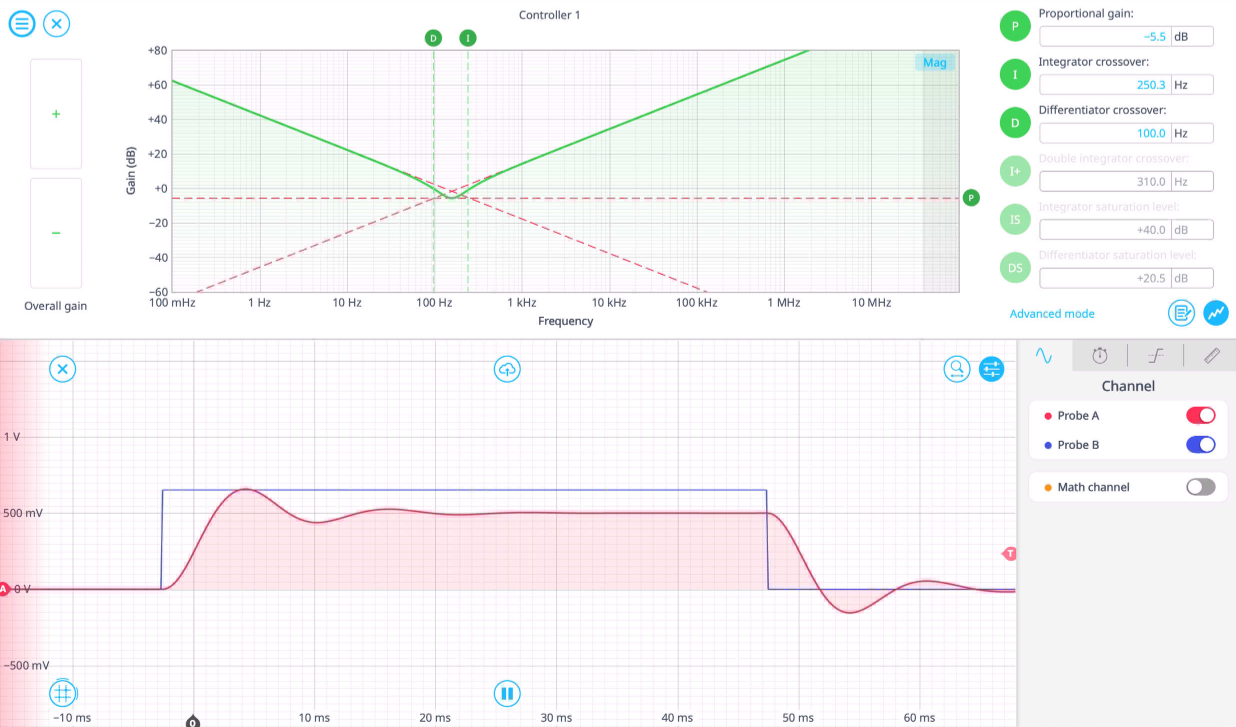
Figure 9: P and I set, adding D at 100 Hz.
- Be careful—too much D can make the system noisy due to amplified high-frequency signals. You can also enable a differentiator saturation term to limit high-frequency gain.
- Adjust P, I, and D interactively while watching the oscilloscope for optimal performance.
To further fine-tune the response, use small adjustments and observe the real-time response on the Oscilloscope. Using the Oscilloscope’s built in measurements, you can also monitor rise time, overshoot, undershoot, and more, logging this information to a file if desired. These Oscilloscope traces can also be exported as .MAT files for further analysis in MATLAB. If needed, adjust output limits to protect external components, filters, or sampling rate for better stability. To implement cascaded controllers, use Multi-Instrument Mode on Moku:Pro.