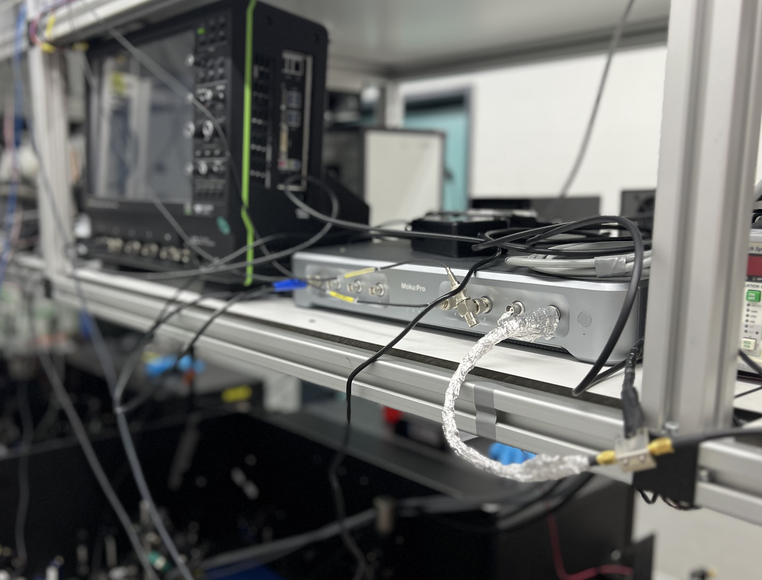
One of the biggest thorns in the side of quantum information science researchers is the inherent instability of qubit systems. Quantum superposition states are inherently fragile, as any interference from the qubit’s local environment, including thermal excitations, mechanical vibrations, or stray electromagnetic fields, can have deleterious effects. These noisy qubits tend to produce errors at a higher rate, and active error correction is a stringent requirement for any potential large-scale quantum computer. Quantum sensing, by contrast, is another subfield of quantum information science (QIS) that seeks to turn this significant impediment into a strength. Qubits are extremely sensitive to their environments, so it follows that qubits also make excellent sensors. While atomic systems like trapped ions and neutral atoms can serve as excellent EMF meters, gravimeters, and force meters, one of the most popular systems for sensing magnetic fields involves defects trapped within a diamond lattice. A research team led by Dr. Ronald Ulbricht at the Max Planck Institute for Polymer Research in Mainz, Germany, is working on novel techniques to enhance the sensitivity of these solid-state magnetometers. To conduct their research, the team used Moku:Pro, a reconfigurable device that delivers a suite of software-defined test and measurement instruments. Specifically, the group leveraged Moku Cloud Compile, a tool available on all Moku devices that allows users to quickly deploy custom FPGA functionality, either standalone or alongside any of the other instruments in the Moku suite. Using a custom module to generate complex sine wave patterns, alongside a novel detection scheme, the group improved upon the room-temperature sensitivity of NV-center based magnetometers. Their work was recently published in Physical Review Applied.
The challenge
Negatively charged nitrogen vacancy (NV) centers occur when a diamond sample is irradiated with electrons, ejecting a small amount of the carbon atoms from the lattice. These vacancies then link up with naturally occurring nitrogen atoms when the sample is heated to high temperatures, forming NV centers. They have many exceptional properties, such as high stability at room temperature, as well as being optically addressable. Moreover, being encased in a diamond lattice means that they are incredibly robust to their environment — able to operate under a variety of extreme conditions. One way of using NV centers to detect magnetic fields is through a process called optically detected magnetic resonance (ODMR). Like in traditional magnetic resonance, a small magnetic field is applied to an NV sample, causing an energy splitting between the spin sublevels, as shown in Figure 1, and a microwave signal (~3 GHz) drives the transition between these sublevels. Applying a 532 nm laser pulse to the system will excite the spins from the ground state to the first excited state, where they exhibit a behavior unique to NV centers: spin-selective decay. If an NV center was in the spin-0 sublevel when it was excited, then it will fluoresce and relax back to the ground state. If it was in the spin-(-1) or spin-1 state, it would not fluoresce, instead relaxing to the ground state through a dark channel. The strength of the fluorescence signal thus gives information about the spin state distribution of the NV centers. If the microwave drive is on resonance, then fluorescence decreases as spins are driven to the +/- 1 states. An external magnetic field perturbation shifts the resonance frequency of the spins, which is then reflected in a change of fluorescence signal.


In his work, Ali Tayefeh Younesi, a graduate student in Dr. Ulbricht’s lab, has developed a modified ODMR scheme. Instead of relying on collecting fluorescence from the NV centers, he instead decided to apply an infrared probe signal to the dark channel path, with the absorption of the probe signal dependent on the population. Measuring by absorption rather than emission allows for higher contrast, and thus higher sensitivity, while being more convenient in certain hardware configurations. This infrared absorption method has historically been difficult to implement effectively, requiring cryogenic temperatures or cavity enhancement to overcome low SNR. Ali and his team have found workarounds for these shortcomings, using narrow-linewidth diamond samples as well as multifrequency excitation with Moku Cloud Compile.
The solution
To obtain the best possible fidelity from their probe signal, the team maximized the number of available NV center transitions. As shown in Figure 1, the 0 → -1 and 0 → 1 spin transitions each have three sublevels due to the presence of the spin-1 nitrogen nucleus, which interacts with the electron spin and creates an additional hyperfine splitting of ~2 MHz. Rather than picking just one of these sublevels to drive, Ali used Moku Cloud Compile to generate a complex baseband signal with six separate frequency components. This baseband signal, shown in Figure 2, was then mixed with a 2.78 GHz local oscillator to address all six NV center transitions simultaneously. Also using Moku Cloud Compile, he then added frequency modulation, so that all six driving frequencies could be swept synchronously. As these signals pass in and out of resonance with their respective NV center transitions, the change in absorption is imprinted on the 1042 nm probe laser and easily detected with a lock-in amplifier, as shown in Figure 2. Once the voltage data is recorded, the value of the applied magnetic field can be easily calculated through a simple linear equation.


Ali credits Moku Cloud Compile and the digital nature of Moku for allowing him to smoothly combine several frequency components while ensuring proper amplitude scaling and phase synchronization, something that would be difficult to do with analog signal combiners. “The modulation is in sync, and it’s all done through Moku Cloud Compile,” he said. Using its control registers, he can easily change the center frequency as well as modulation depth and frequency. He has also found the reconfigurable Moku platform’s many other instruments, such as the Oscilloscope and Spectrum Analyzer, to be helpful for debugging and signal verification tasks around the lab.
The result
With their measurement procedure in place, Ali first calibrated the setup by applying a known pulsed magnetic field to the sample, finding that even at small fields (<1 𝜇T), the magnetometer could measure the amplitude of the field within 3%. The second test was to determine the sensitivity. After collecting the lock-in amplifier output for a set period of time, the power spectral density was calculated. By moving the microwave drive on and off resonance, the non-magnetic noise contribution could be quantified. The group found that the sensor had a noise floor of 18 pT/√Hz, partly due to laser shot noise. Nonetheless, this figure represents the highest sensitivity ever recorded for this IR absorption technique. With a theoretical shot-noise sensitivity of 5 pT√Hz, it could be possible to lower this noise figure even further. While Ali and his colleagues continue to improve their magnetometer techniques, Moku will continue to be a vital part of their experimental setups. “It’s a nice compact tool to have in the lab, with one device you can have all the tools you need,” he said. Read the group’s full paper here.