Updated June 25th, 2025
In this application note, we will provide a step-by-step tutorial on how to use Moku’s LabVIEW API to build an automated test sequence. Many electronic systems perform optimally at a specific operating frequency. To maximize the signal-to-noise ratio of a lock-in measurement, it’s important to find the transfer function of the system and to use the optimal modulation frequency. In this example, we will build a LabVIEW VI that scans the frequency of the local oscillator (LO) and plots the measured amplitude as a function of LO frequency. Then, we will use this VI to measure the transfer function of a bandpass filter.
Frequency Sweep Lock-in Detection
A Lock-In Amplifier (LIA) is designed to extract extremely weak oscillating signals from a noisy background. The LIA takes the input signal and mixes it with a local oscillator (LO) of a certain frequency. Then, a lowpass filter is applied to attenuate the high frequency components.
More details on the principle of the Lock-In Amplifier can be found in this video.
This detection method allows us to measure signal response at any arbitrary frequency with narrow bandwidths defined by the lowpass filter. The center of the measured frequency is set by the frequency of the LO. By sweeping the frequency of the LO, the transfer function of the system can be measured. We can use such a response plot to determine the resonance, optimal modulation frequency or impedance of different systems. It is an essential test to perform in order to achieve the maximum signal-to-noise ratio for a lock-in measurement. In this application note, we will demonstrate how to use Moku’s LabVIEW API to build an automated test sequence to sweep the LO frequency and measure the response of a bandpass filter.
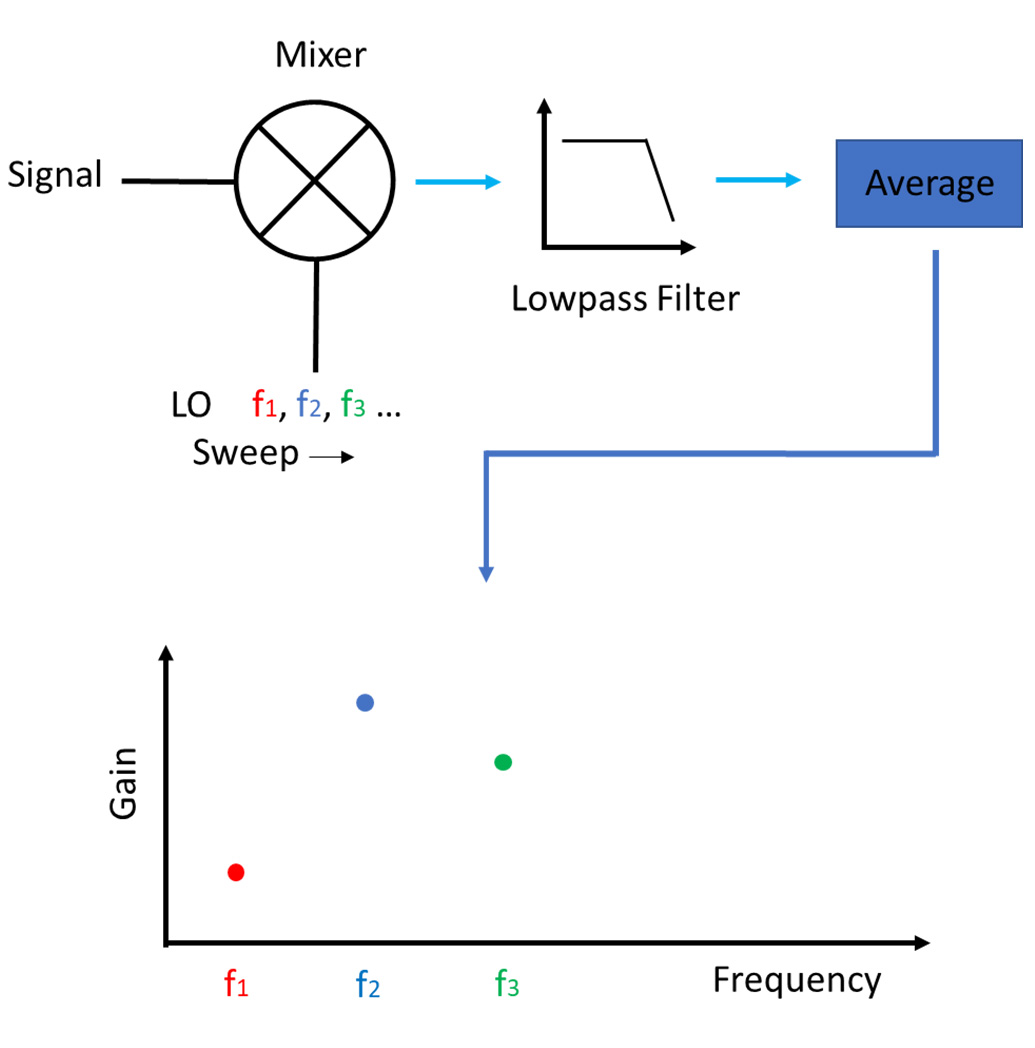
Figure 1: General flow of the automated test sequence.
System Setup
The installation file and instructions for Moku’s LabVIEW API are located here:
https://liquidinstruments.com/products/apis/labview-api/
https://apis.liquidinstruments.com/api/getting-started/starting-labview.html
The complete LabVIEW .VI file is included in the Moku LabVIEW driver package. The example folder is typically located at:
C:Program Files (x86)National InstrumentsLabVIEW 2016examplesLiquid InstrumentsLiquid Instruments Moku
The exact path may vary depending on your LabVIEW installation directory and version.
The example was created using Moku LabVIEW driver version 3.3.2.1, which is compatible with Moku firmware version 601.
To control and operate Moku with LabVIEW, we need to connect Moku and the computer to the same network. In this example, we connected a Moku:Pro and the computer wirelessly to the same Wi-Fi router.
To locate Moku on the network, an IP address is required. To find the IP address, you can use any of the methods described in this Knowledge Base article:
https://knowledge.liquidinstruments.com/how-do-i-find-my-mokus-ip-address
The LO signal is generated from Moku:Pro’s Output 2, passed through the bandpass filter, and the return signal is measured at Moku:Pro’s Input 1.
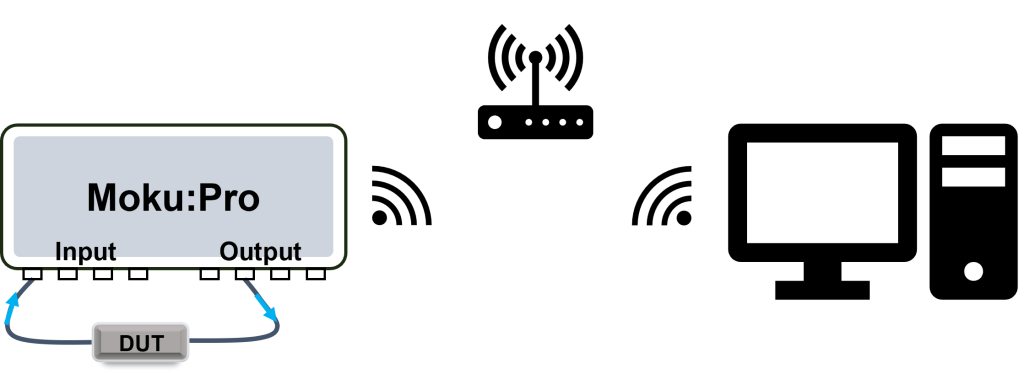
Figure 2: Moku:Pro and the computer were connected wirelessly to the same router. The DUT was inserted between Output 2 and Input 1.
Building the LabVIEW VI
Connect to Moku and deploy the default settings
Step 1: Create a client session and upload the instrument bitstream
To begin the LabVIEW Moku project, we first create a client session with Open Moku VI. The Moku’s IP address is entered through the input terminal. Then, wire the VI to Upload Instrument VI by connecting the client and error terminals together. The LIA instrument is used throughout the entire program, so we set it as default instrument name.
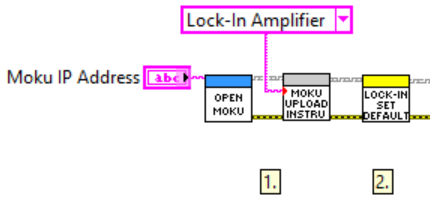
Figure 3: Create a client session, connect, and initialize the LIA instrument.
Step 2: Initialize the LIA and set it to default state
The Lock-in Set Default palette initializes the LIA and sets every parameter to the default values. This command is used to start the LIA instrument on Moku.
Set up parameters for the lock-in detection
After initializing the device, we can configure the settings for the LIA (Step 3 – 11) according to specific experimental needs.
Step 3: Configure the Moku:Pro frontend settings, including impedance, coupling, and the attenuation factor (voltage range).
Step 4: Configure the lowpass filter immediately after the mixer.
Step 5 & 6: Set the two monitor points: one at the main and the other at aux output. The main-output monitor point is later used to acquire real-time data. Moku:Pro allows up to four probe points.
Step 7: Adjust the amplitude of the sinusoidal modulation waveform to the device-under-test (DUT).
Step 8: Configure the two Moku outputs: one as the R channel (amplitude, main output) and the second as the demodulation waveform (the LO) for frequency sweeping.
Step 9: Set the range for the rect-to-polar conversion. Details about the conversion can be found in Moku’s Lock-In Amplifier user manual.
Step 10: Configure the acquisition mode of the embedded oscilloscope. See this article for a discussion of the available acquisition modes.
Step 11: Define the time-base for the monitor points and real-time data acquisition.
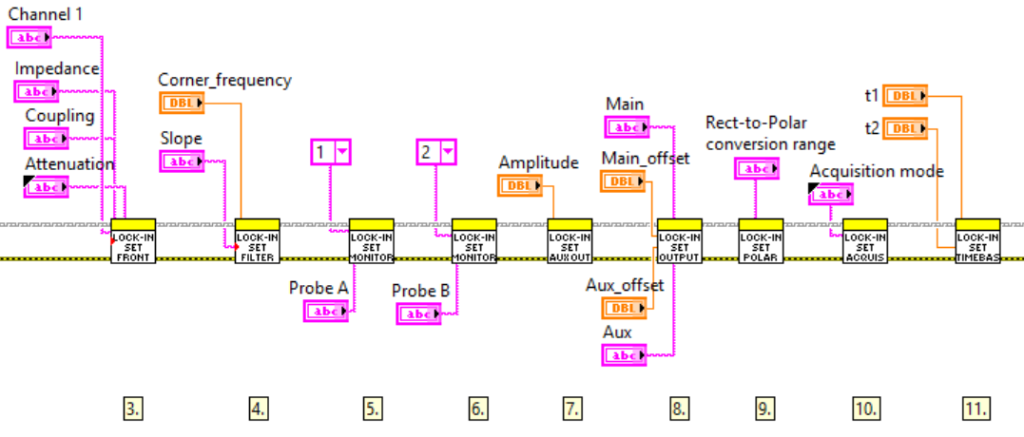
Figure 4: VIs to set up the parameters for LIA.
For Loop for automated frequency sweep
A For Loop is utilized to iterate the frequency sweep and data acquisition process. We create three customizable parameters (step 12) for the loop: number of steps, frequency step, and initial frequency. At the beginning of each iteration, the program calculates the LO’s frequency based on \(i times text{frequency step} + text{initial frequency}\). Then, this number is split into two, passed to the Set Demod palette as the frequency input (step 13), as well as used as the x-axis location for the magnitude vs. frequency plot (the transfer function plot).
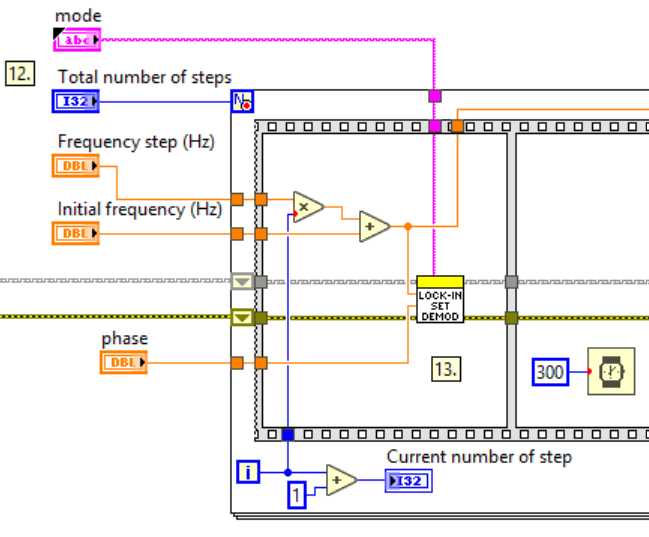
Figure 5: For Loop to iterate the frequency sweep and data acquisition.
To ensure that the LO is properly set and stable before the data acquisition, a flat sequence structure is used to separate the setup portion and data acquisition portion. After a 300-ms waiting period, the Get Data command is sent to Moku to acquire one frame of time-series voltage data. The raw data is unbundled and converted into multiple numeric arrays suitable for post-processing and visualization. A Mean function calculates the average value of the main channel’s numeric array. The result is then normalized against the output voltage, converted to a logarithmic scale (dB), and displayed as the y-axis value of the transfer function graph on the front panel.
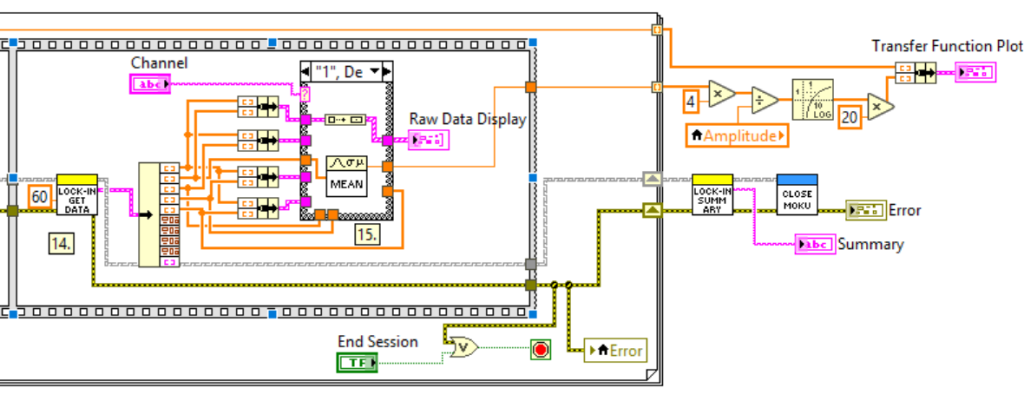
Figure 6: Data acquisition, parsing, average, and display.
Measure the Filter Transfer Function
To measure the transfer function of the DUT — a bandpass filter (Mini-Circuits BBP-10.7+) [1] — we configure the initial frequency to 7.4 MHz, set the frequency step to 100 kHz, and specify 76 total steps for the sweep.
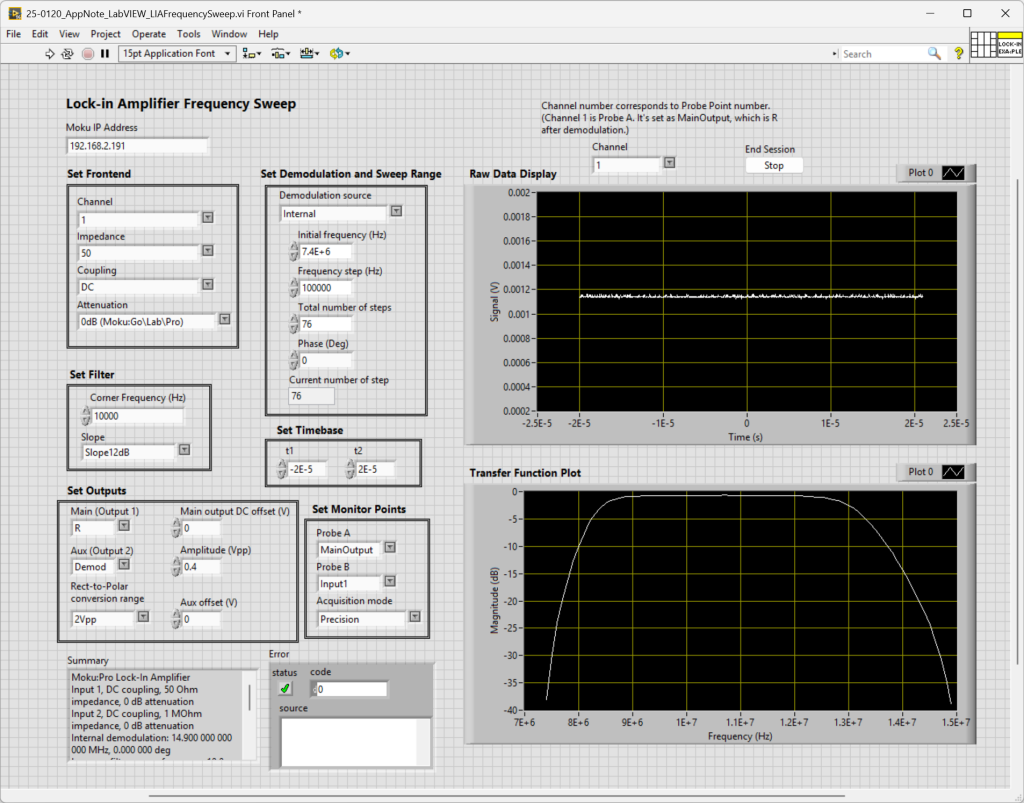
Figure 7: Frequency sweep analysis with a bandpass filter.
The LabVIEW VI automatically performs a frequency sweep of the local oscillator (LO) and plots the magnitude (gain) response of the bandpass filter. From the transfer function plot, we observe that the filter’s passband ranges from approximately 9 MHz to 12.5 MHz, which aligns well with its specified performance characteristics. The attenuation of approximately -0.7 dB across the passband is attributed to the insertion loss of the filter. [1]
References
[1] Mini-Circuits BBP-10.7+ bandpass filter: https://www.minicircuits.com/pdfs/BBP-10.7+.pdf