In this series, we provide a practical reference for designing and debugging loops by presenting a short introduction to feedback control as encountered in the frequency domain.
4.1 Introduction
All properties of a loop are determined by its open-loop transfer function (OLTF), labeled G, and it is this quantity that we must modify in order to achieve the required performance objectives. However, the transfer functions of the plant and sensor are generally fixed, with the only available degrees of freedom found in the controller. We thus tune the controller transfer function C, to modify the OLTF. Frequency-domain tuning of this type is often termed loop shaping.
Part 1 establishes the definition of a transfer function and provides the components from which one can construct control loop block diagrams to model elaborate systems. In Part 2 we demonstrate how feedback control systems can be used to suppress disturbances or track a process set point. The complications associated with noisy sensors are also discussed. Unlike open-loop systems, devices under feedback control have the potential to become unstable and there is tension between performance and robustness. Ultimately, delays in signal propagation can impose the most stringent limit. These issues are treated in Part 3. In the frequency domain, most parameters of a feedback system can be linked to its open-loop transfer function. Here in Part 4 we explain how to measure this important quantity and provide a list of functions often used in shaping it. Part 5 describes one method of avoiding actuator saturation and, in doing so, introduces ideas useful to the treatment of multiple actuators. Our series concludes in with the study of the PID controller. This common control architecture is generally considered from a time-domain point-of-view; we illustrate the complementary frequency-domain representation.
4.2 Design principles
Based on the discussions in the previous parts of this series, the design rules are as follows:
- Make |G| as large as possible to suppress disturbances and track the set point well (see (2.1))
- Make |G| as small as possible so as to not corrupt our measurements with sensor noise (see (2.2))
- All the while maintaining good stability/robustness (see §3.2)
The task is further complicated by the relationship between the slope of the OLTF and its phase
\(|G| sim f_n Rightarrow angle G sim n times 90^{circ}\).
To realize high gain, we must have steep slopes, which rob the loop of phase and push it towards instability.
Finding a valid loop seems like an impossible task until one realizes that these competing requirements generally apply over different frequency bands. Disturbances are largest at low frequencies, stability is defined only by behavior around unity gain and sensor noise is most often dominant at higher frequencies.
Thus, we construct a controller from basic elements (see §A) to realize high gain at low frequencies , acceptable phase margin at the UGF, and low gain at high frequencies (see e.g. the loop of Figure 3.1).
Loop shaping is an iterative process. The first loops serve only to achieve basic closed-loop control and enable system characterization and model verification (see §4.3). It may be that the free-running noise or plant/sensor transfer functions are not known or cannot be measured open-loop. From this point, one can quantify the free-running (by ‘undoing’ the effects of the measured loop) and closed-loop outputs. Then, one can discuss the feasibility of the requirements and start to optimize the loop in the presence of real-world effects such as delays, resonances, saturation etc.
With practice and experience, tuning loops will become second nature, with techniques such as increasing gain to reduce noise, adding compensators to recover a few degrees of phase, notching resonances, and more..
4.3 Measuring the OLTF
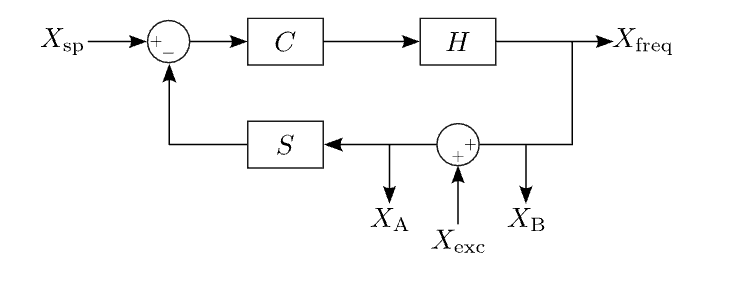
Figure 4.1: Combat output disturbance with feedforward.
The open-loop transfer function may be measured experimentally using a Frequency Response Analyzer . If the system allows it, such measurements may truly be made with the loop open, simply by connecting the components in series and measuring the response. More often, representative dynamics may only be probed around the desired operating point, i.e. with a system under closed-loop control.
Fortunately, it is possible to measure the OLTF from measurements taken when the loop is closed. Introducing an adder at any point in the loop allows the injection of a stimulus or excitation signal, \(X_{exc}\). The ratio of the signals on either side of the adder,
\(X_A = frac{1}{1+HCS}X_{exc}\) and
\(X_A = frac{1}{1+HCS}X_{exc}\),
gives the negative of the OLTF,
\(X_A/X_B = -HCS\),
Here we have ignored DC terms related to \(X_{sp}\) as we are interested only in the AC response to \(X_{exc}\). In practice, such terms will not survive the coherent detection process in the Frequency Response Analyzer.
Generally, the ratio \(X_A/X_B\) is measured directly, as opposed to combining two independent measurements. In this way it can be difficult to achieve good SNR at low and high frequencies due to dynamic range limitations (see Figure 4.2). Often loops are measured only around unity gain with resulting data used to anchor analytical models.
Closing the loop for the first time to enable OLTF measurements can be difficult. The most efficient approach is to build a model using assumed, measured or specified transfer functions of the individual components. From this approximate description of the system a basic functional loop can be implemented.
4.3.1 OLTF measurements with Moku
The Moku Frequency Response Analyzer can be used to make measurements of the OLTF in Multi-Instrument Mode with the PID Controller instrument being used as an adder (see Figure 4.3). The Frequency Response Analyzer should be used in In÷Out mode, with equal amplitudes set for both output channels (even if only one output is to be used). The output of the Math channel with equation −B/A gives the desired result.
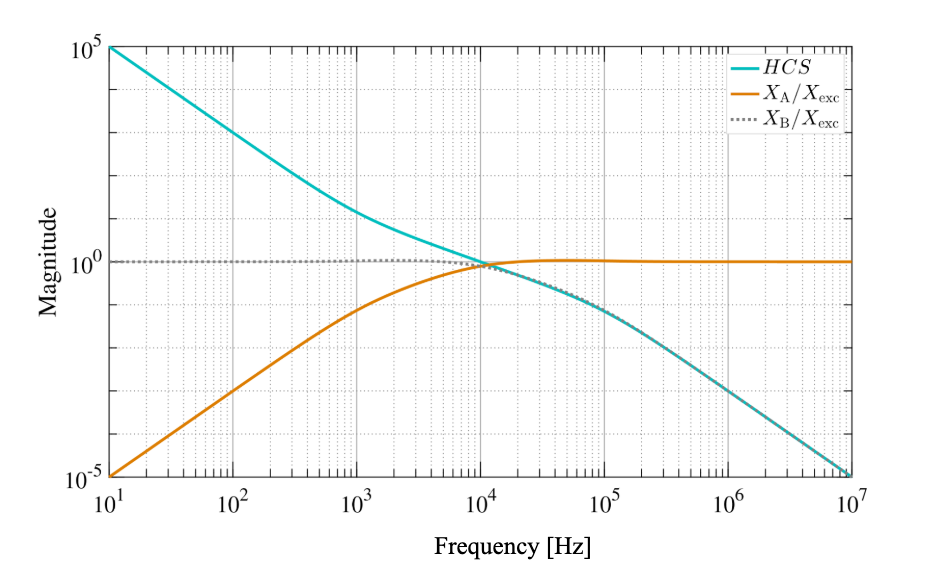
Figure 4.2: Magnitudes of \(X_A/X_{exc}\) and \(X_B/X_{esc}\) for a typical open-loop transfer function HCS. At high and low frequencies it can be challenging to make high-fidelity measurements of both quantities simultaneously as their responses differ by several orders of magnitude. As such, open-loop transfer function measurements are often made only around unity gain.
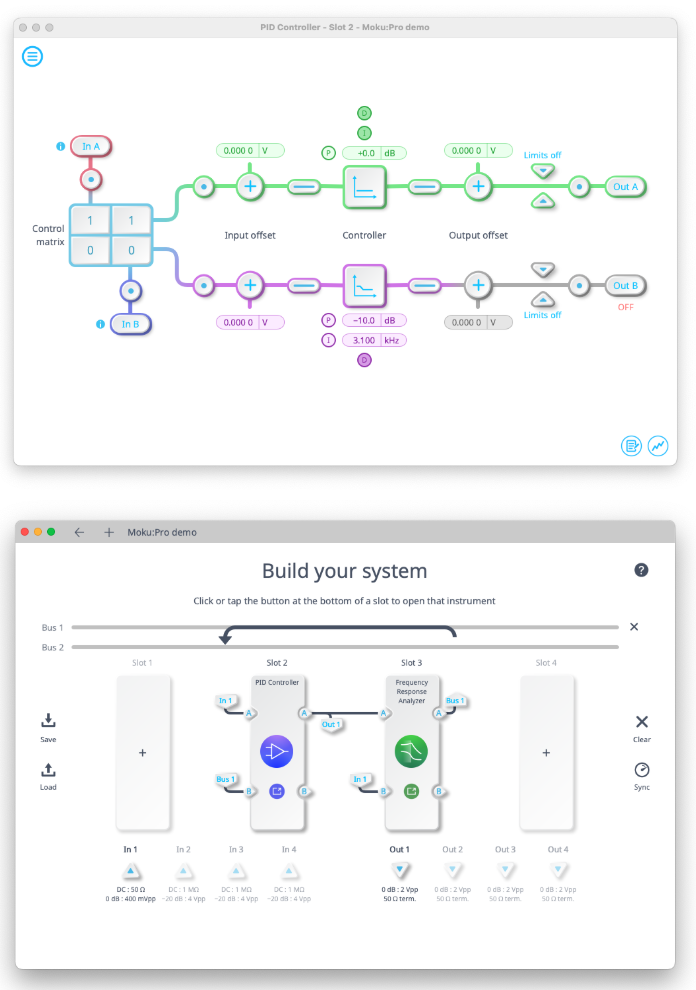
Figure 4.3: Moku’s Multi-Instrument Mode enables measurements of a system’s open-loop transfer function using the Frequency Response Analyzer and PID Controller instruments. Configured as shown above, the PID Controller plays the role of an adder, enabling excitation signals to be injected. A simple summing node could equally be constructed using Moku Cloud Compile.
4.4 Summary
Optimizing loop shape is generally the most time-consuming stage of creating a feedback control system. However, guided by a good model and OLTF measurements made using the process outlined above, we need not operate blind. Implementing the design principles (high gain at noisy frequencies; low gain elsewhere, all the time with an eye on stability) using a collection of the basic functions detailed in Appendix A is a proven strategy for success.
Next, in Part 5, we’ll consider how to manage a loop that works for a short period but loses lock when an actuator saturates.
Appendix A: Useful expressions
We present here a series of expressions which the reader may find useful when modelling their systems or designing controller transfer functions. These expressions have been evaluated and are plotted in Figure 4.4. Here, \(omega_0\) describes the corner or center frequency in angular units. The dimensionless quantity Q is related to the filter’s full-width half-maximum (FWHM) bandwidth ∆ via \(Q = omega_0 / Delta\).
We also note that the solutions of the equation
\(s^2 + left(omega_0 / Qright)s + omega_0^2 = 0\)
are
\(s = -frac{omega_0}{2Q} pm i omega_0 sqrt{1- left( frac{1}{2Q} right)^2}\).
- Poles and zeros
\(H_p(s) = frac{1}{1+s / omega_0}\)
\(H_z(s) = 1+s / omega_0\)
- Complex poles and zeros (second order)
\(H_p(s) = frac{omega_0^2}{s^2 + left(omega_0 / Qright)s + omega_0^2}\)
\(H_z(s) = frac{s^2 + left(omega_0 / Qright)s + omega_0^2}{omega_0^2}\)
- Notch/resonant gain
\(H_{notch/res}(s) = frac{s^2 + left(omega_0 / Q_zright)s + omega_0^2}{s^2 + left(omega_0 / Q_pright)s + omega_0^2}\)
The gain or attenuation of the filter at \(omega_0\) is given by \(Q_p/Q_z\) and its Q is approximately \(Q_p\).
- High pass
\(H_{hp}(s) = frac{s^2}{s^2 + left(omega_0 / Qright)s + omega_0^2}\)
- Bandpass
\(H_{bp}(s) = frac{left(omega_0 / Qright)s}{s^2 + left(omega_0 / Qright)s + omega_0^2}\)
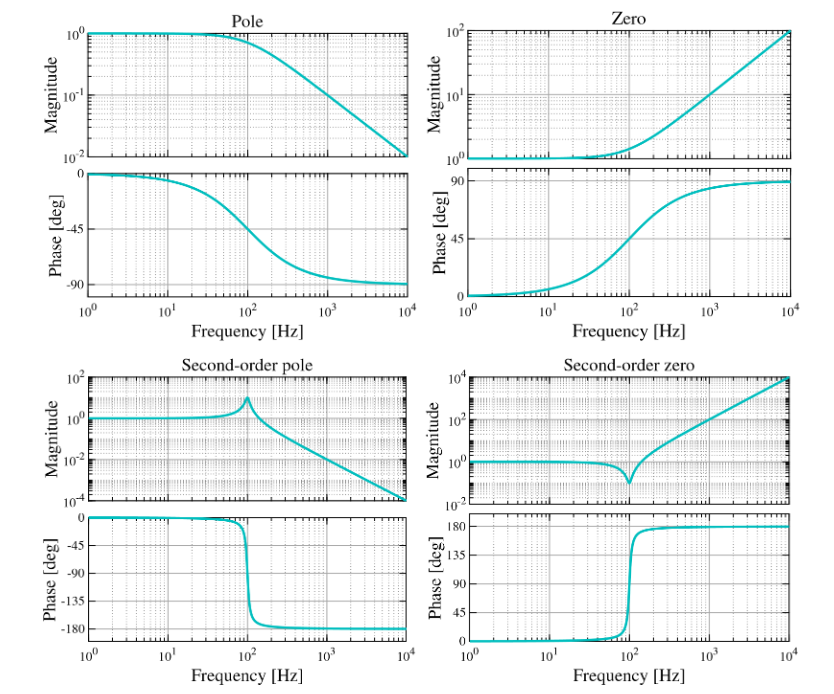
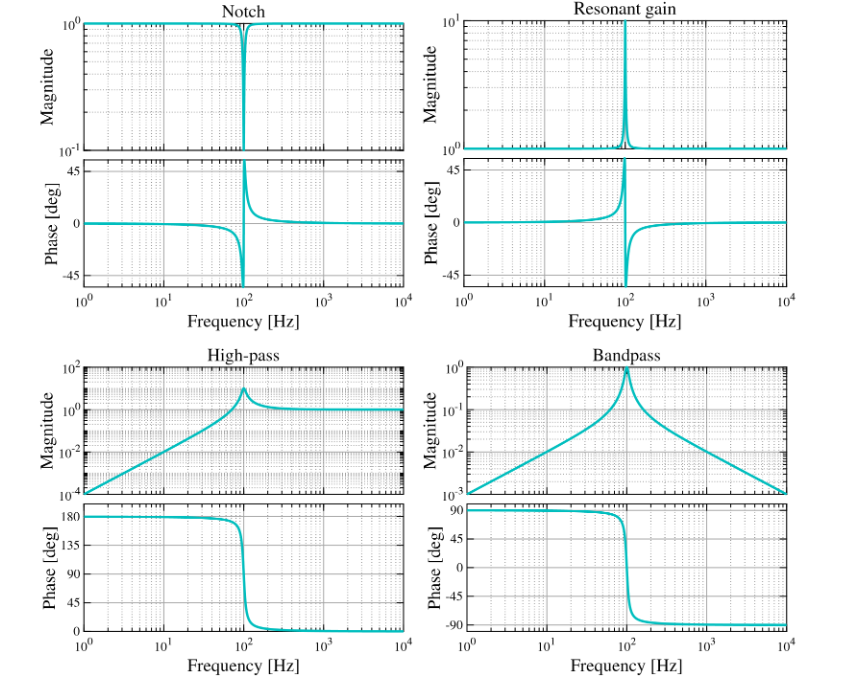
Figure 4.4: The ‘useful expressions’ detailed above plotted for arbitrarily chosen parameters (\(omega_0\) =100 Hz , Q = 10, gain/attenuation= 10) to show their functional forms.
