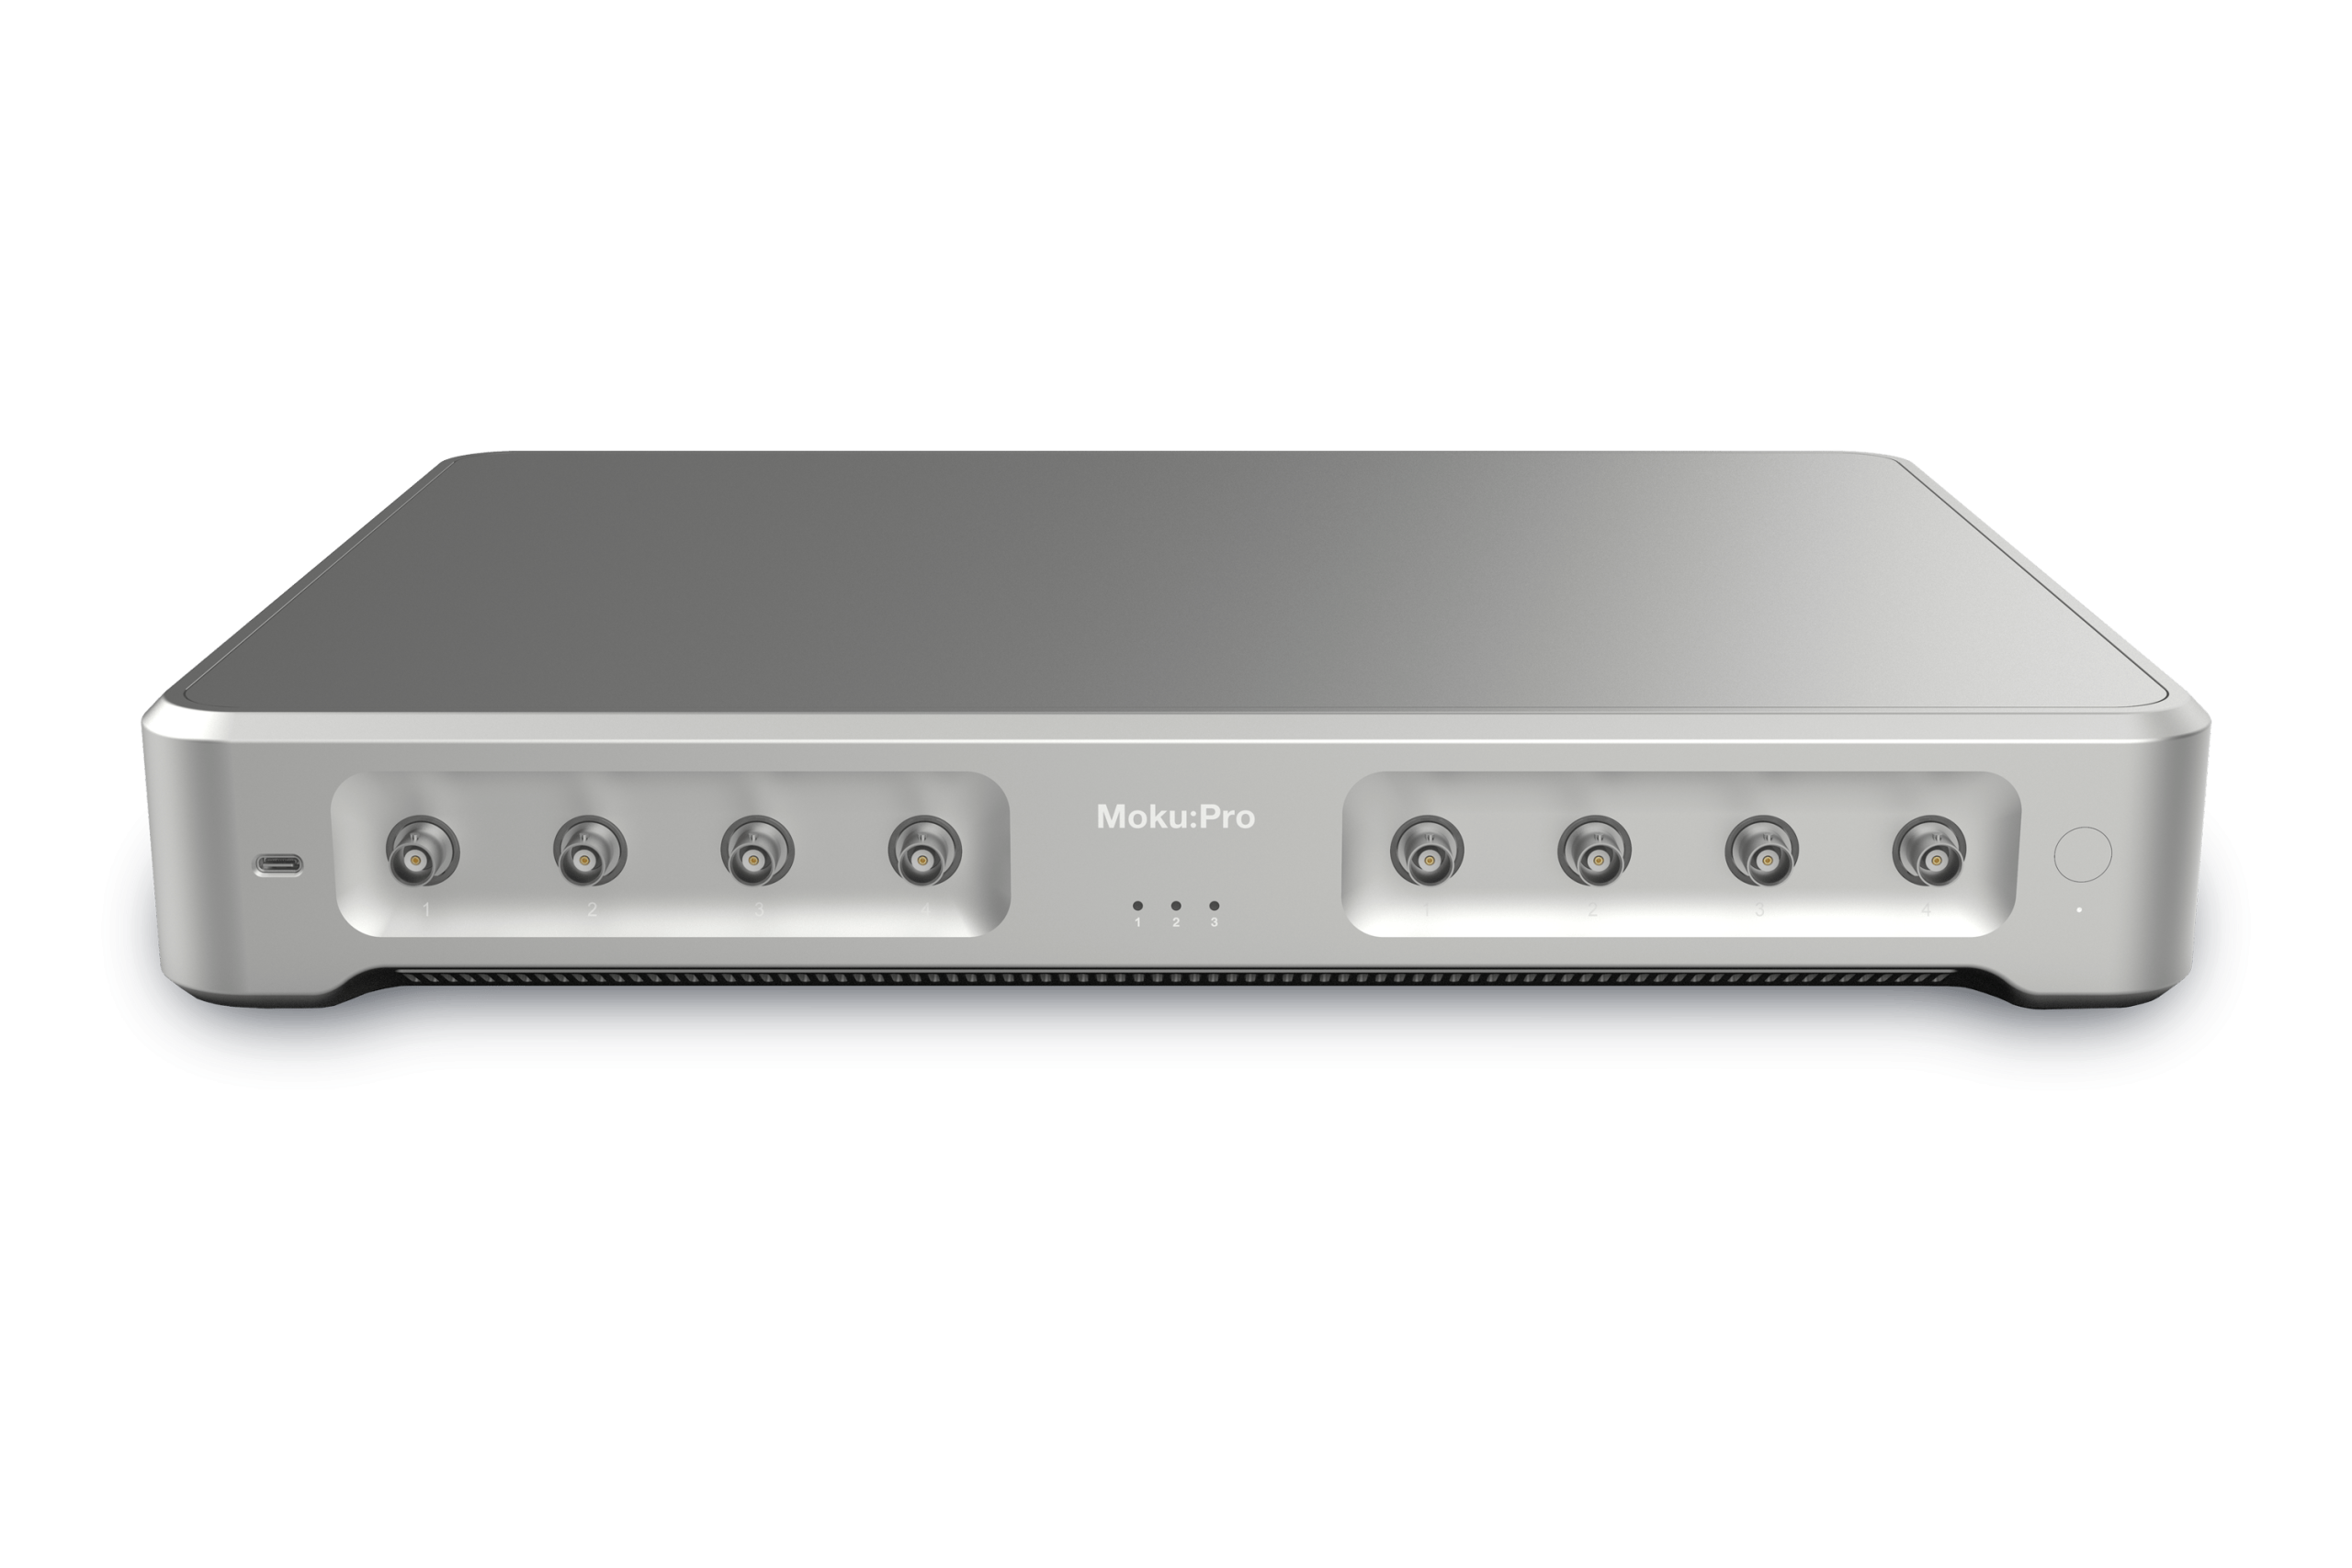
This application note serves as a follow-up to Part 1 of this series, Improving SNR measurement with a boxcar averager. This app note explores the configuration and operational principles of dual boxcar averagers, with an emphasis on their implementation using Moku Cloud Compile on Moku:Pro.
The boxcar averager is a widely used instrument that plays a crucial role in improving the signal-to-noise ratio (SNR) for measuring low-duty-cycle signals. By integrating the signal within narrow gates triggered by specific events, it effectively isolates noise contributions between pulses. Averaging multiple gating events further enhances the SNR of the measurements. This application note details the implementation of a boxcar averager on Moku:Pro using Moku Cloud Compile.
The boxcar tool is available here. For a downloadable guide on how to get started with Moku:Pro, click here.
Working principles of a boxcar averager
Boxcar averagers and lock-in amplifiers are instrumental in enhancing the SNR performance when detecting repetitive signals. A boxcar averager applies a time-domain boxcar window to the input signal, effectively mitigating temporal noise components outside the imposed boxcar window; whereas a lock-in amplifier deploys a narrow-bandwidth filter to extract signals within a small range around a central frequency and to reject noises beyond the passband. Therefore, a boxcar averager is particularly suitable for processing low-duty-cycle signals, as the majority of the time-domain signals in such scenarios are usually noise.
Figure 1 illustrates the operational principle of a boxcar averager. A user-defined trigger signal activates a boxcar gate window after a certain delay from the trigger. The gate window allows the input signal to be added up over the window width. The instrument then averages the integration of n results obtained from the boxcar integrator and adjusts the output with a gain stage for any necessary attenuation or amplification.
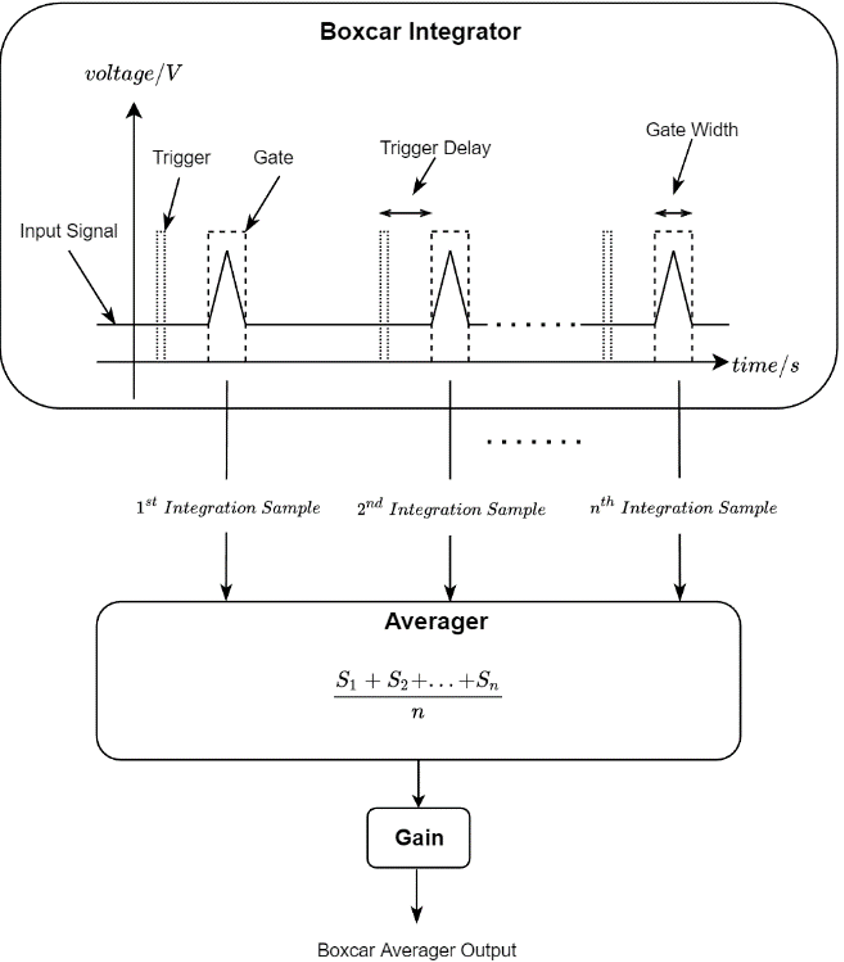
Figure 1: Operational principle of a boxcar averager. The input signal is integrated within a boxcar window which is activated by a trigger signal. A trigger delay is introduced between the boxcar window and the trigger edge to compensate for system delay. The integrated results are averaged and then pass through a gain stage to generate a boxcar averager output.
The fundamental structure of a boxcar averager comprises two key components: the boxcar integrator (gate) and the averager. The boxcar integrator filters the input signals, eliminating undesirable noise arising from the silent window with no signal of interest. Subsequently, an averager processes the output from the boxcar integrator to conduct additional signal averaging before producing the final output.
Now, let’s delve into real signals processed using a boxcar averager. Figure 2 presents a plot of the trigger signal alongside the pulse signal. Notably, there’s an observable delay between the rising edge of the trigger signal and the corresponding pulse signal. This delay is anticipated due to inherent delays introduced by electrical components within the signal pathway.
To align the boxcar integration window and the pulse signal, one can manually introduce a delay in the integration process relative to the trigger occurrence. This temporal adjustment is represented by the trigger delay parameter in a boxcar averager. In Figure 2, the trigger delay is approximately 176 nanoseconds, while the gate width spans 320 nanoseconds, effectively encompassing the entire pulse signal.

Figure 2: The trigger signal (orange trace) has an amplitude of 150 mV. Following a delay of 176 ns, the boxcar window with a width of 320 nanoseconds is activated and measured.
After configuring the trigger delay and the gate width, the focus shifts to further reducing noise level through averaging the boxcar integration results. In this process, the results from S1 through S5 are averaged to compute the final output.

Figure 3: Calculate the average of five periods of boxcar integration (labeled as S1 through S5 ) to enhance the SNR.
Implementing a boxcar averager
The objective of this section is to provide a comprehensive guide on implementing a boxcar averager, available from the Liquid Instruments Github as illustrated by a step-by-step flowchart in Figure 4. The general procedures can be described as follows:
(1) Adjusting the trigger level for appropriate triggering
Set the trigger level within the range from the noise floor to the peak value of the trigger signal.
(2) Synchronizing the boxcar gate window with the pulse signal and configuring the gate width
Select an appropriate boxcar gate width and find a suitable trigger delay. In optical experiments, the trigger signal often precedes the pulse signal due to optical path delay and photodetector delay. In such scenarios, the compensation for the trigger delay will be crucial.
(3) Selecting the length of the averager
Select a suitable number of averaging cycles to achieve a balance between sufficient SNR and speed.
(4) Adjusting the gain stage
Apply attenuation or amplification to the result from step 3 to prevent output saturation or minimize potential quantization errors, maximizing the use of Moku’s output range.

Figure 4: Operation flowchart for implementing a boxcar averager.
In the following sections, we will walk through the procedures for configuring a boxcar averager on Moku:Pro via interfacing with a Python control panel and Moku Cloud Compile (MCC) control registers, respectively.
Controlling a boxcar averager with Python
Below are instructions for implementing the steps of boxcar averaging via the Python control panel.
(1) Adjusting the trigger level
Given a trigger signal with 150 mV amplitude in this experiment, selecting a signal level of 75 mV ensures stable triggering of the boxcar integrations. Please note that the boxcar window only appears upon appropriate system triggering; otherwise, neither the stable pulse signal nor the trigger signal will be visible.
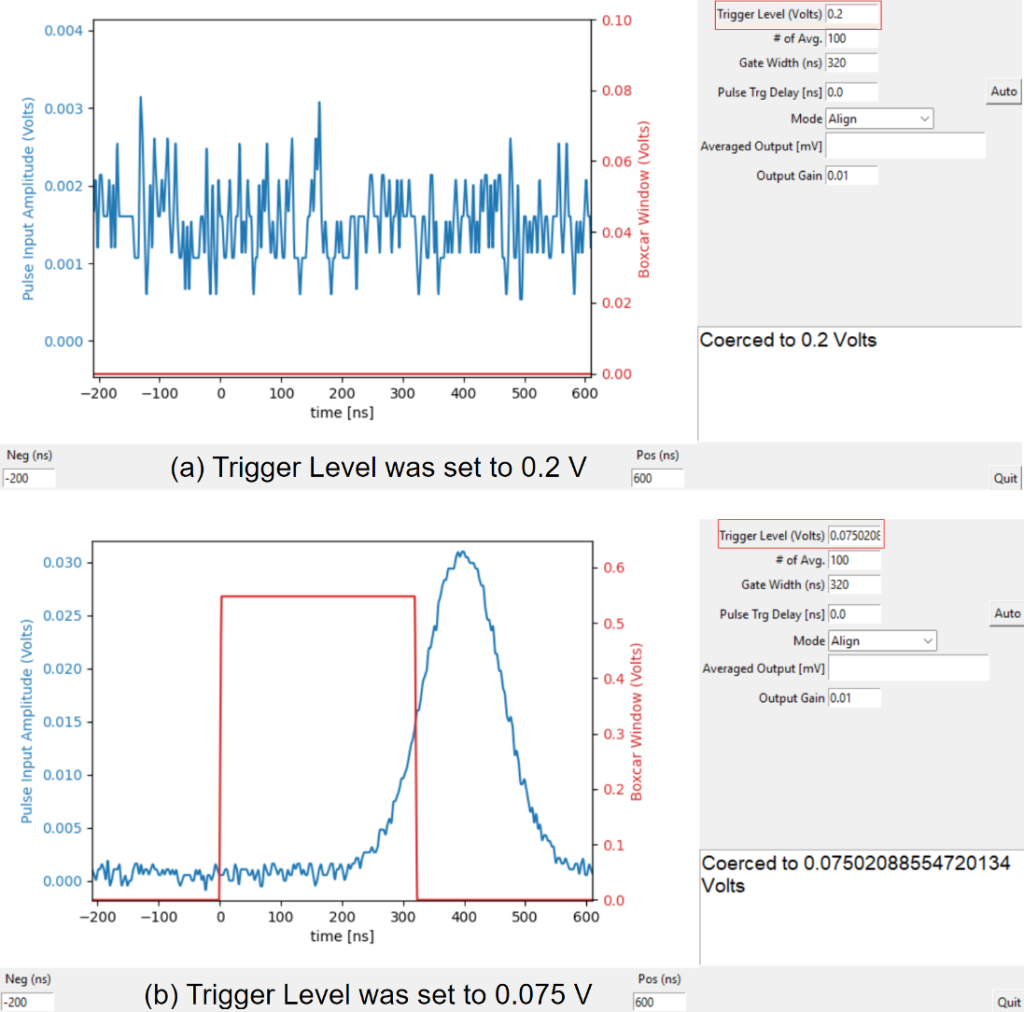
Figure 5: System responses under different trigger level settings. (a) The trigger level 0.2 V is higher than the trigger signal amplitude 0.15 V. Consequently, the boxcar window fails to trigger, resulting in the absence of both boxcar window and pulse signal. (b) Setting the trigger level to 0.075 V, equivalent to half of the trigger signal’s amplitude, successfully activates both the boxcar window and the pulse signal.
(2) Aligning the triggered boxcar gate window with the pulse signal and configuring the gate width
This can be accomplished through either an iterative adjust-and-observe process or by utilizing the Auto button. The auto delay function automatically identifies the peak location of the pulse signal and calculates the time difference from the pulse peak to the midpoint of the boxcar window, thereby adjusting the trigger delay accordingly.
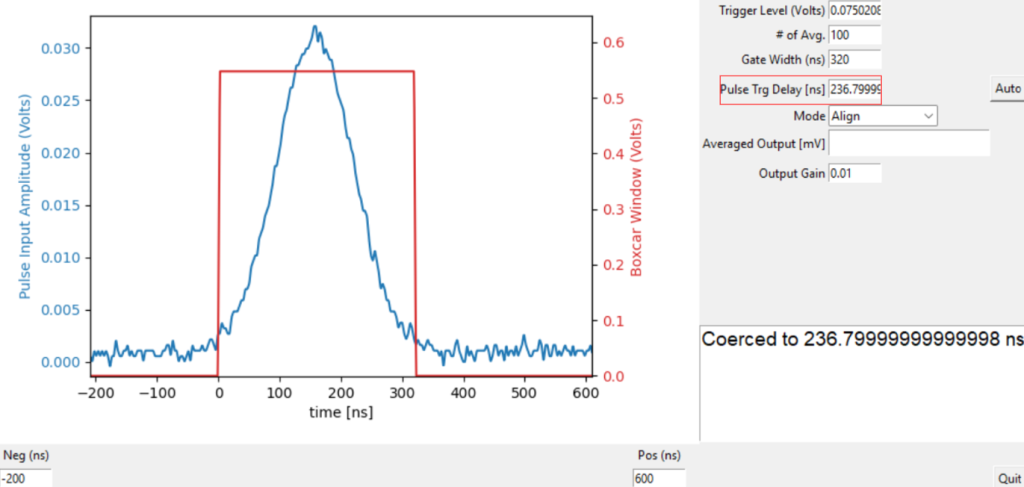
Figure 6: The Pulse Trigger Delay is adjusted to 236.8 ns to align the boxcar window with the pulse signal.
The gate width is also an important parameter to optimize the SNR. Interestingly, the optimal setting for the gate width does not necessarily involve capturing the entire pulse signal; instead, capturing the majority will often suffice. This strategy optimizes the SNR by excluding sections of the pulse signal with lower signal power compared to noise power. Essentially, it allows for the removal of segments where the signal power is negligible compared to the noise power.
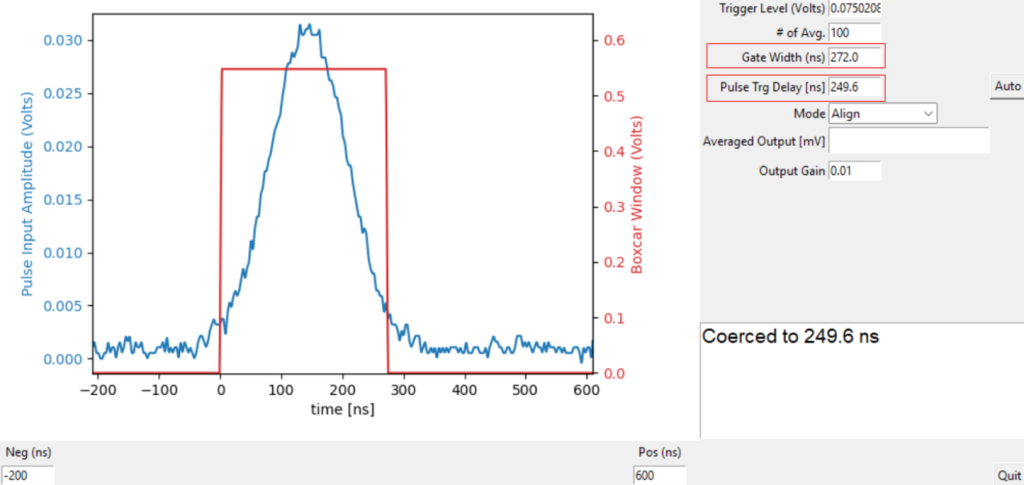
Figure 7: To optimize SNR, the boxcar width is adjusted to capture only the majority of the signal. Then the trigger delay is accordingly adjusted to 249.6 ns to realign the pulse and boxcar window.
(3) Selecting number of averaging periods and adjusting the gain stage
Changing the mode from “Align” to “Average Output” displays the averaged output signal in the data readout box.
Please note that the output of the boxcar averager is the summation of n boxcar integrated results instead of the average. This is because implementing a divider on FPGA is time-consuming and requires significant resources. It would be more efficient to output the integrated results rather than the actual average. The averaged boxcar integrations can be calculated using the following equation:

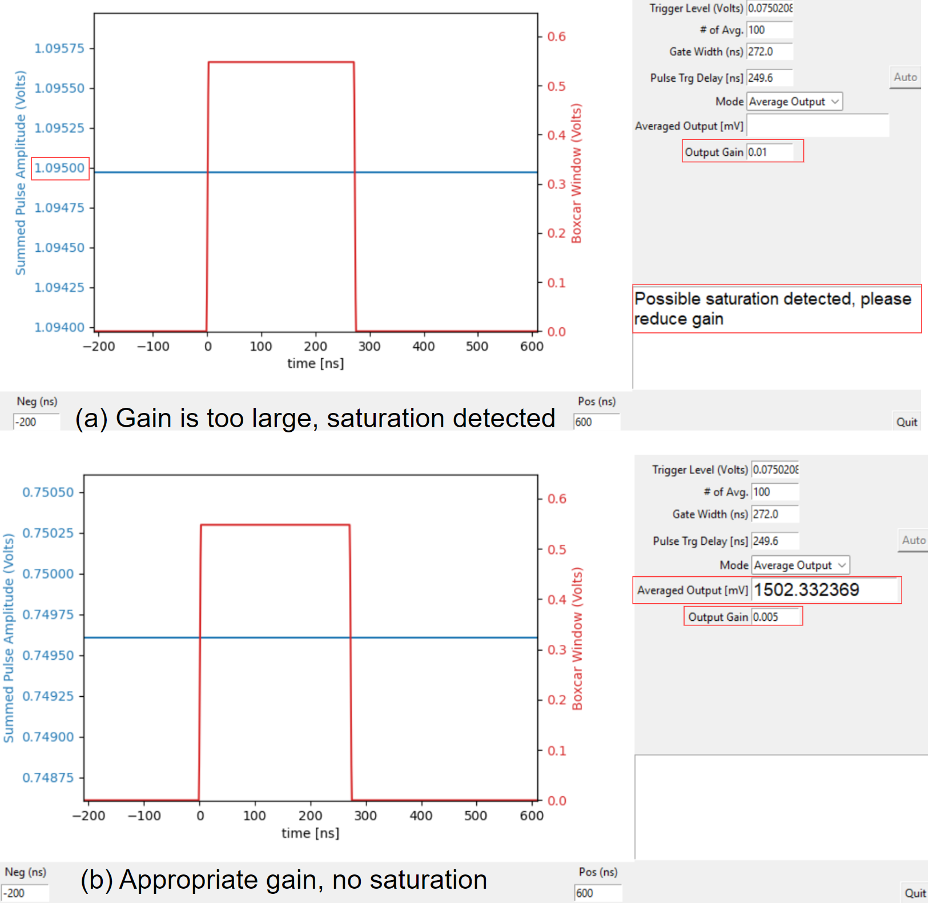
Figure 8: Change the Mode from “Align” to “Average Output” to read output values. Then configure the Output Gain to avoid quantization errors or output saturation.
MCC Control registers
Moku:Pro offers a convenient feature allowing direct control over the registers for implementing the boxcar averager. A detailed summary of the data types assigned to input, control, and output ports is presented in Table 1. The practical configurations of the control registers in Moku:Pro align with the specifications outlined in this table. Users can achieve full configuration of the boxcar averager’s functionality by adjusting control registers 0 to 5, providing the same level of control as the Python control panel.
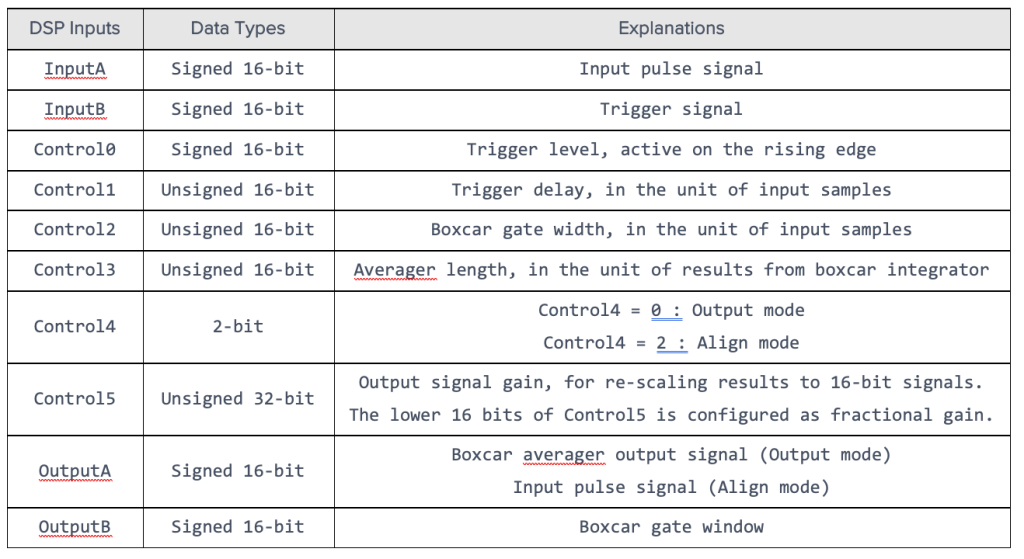
Table 1: Configurations of Boxcar Averager input, control, and output ports.
Moku:Pro was set up as shown in Figure 9. In this configuration, Moku:Pro operates in Multi-Instrument Mode, enabling the implementation of the boxcar averager in Slot 1 and the output monitoring in Slot 2. The MCC block in Slot 1 utilizes In 1 for signal input and In 2 for trigger input. The resulting outputs, Out A and Out B, from the MCC block are then connected to Oscilloscope in Slot 2 to visualize the boxcar averager output signals.
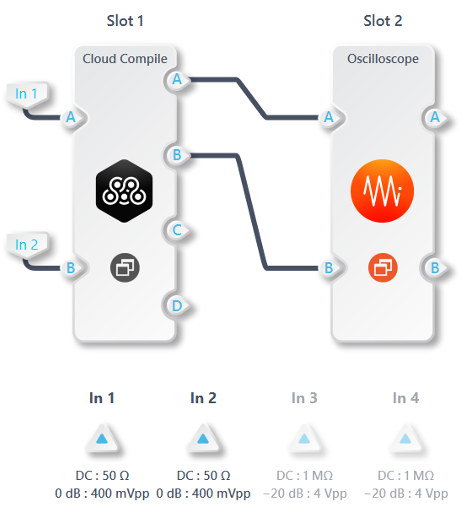
Figure 9: Multi-Instrument Mode configuration of Moku:Pro. In 1 is the signal input and connected to In A, and In 2 is the trigger signal. The two outputs of the boxcar averager, Out A and Out B, are connected to Oscilloscope to display the results.
The control registers in the MCC block were configured with the values shown in Figure 10. The trigger level was set to 2,244, corresponding to a trigger threshold amplitude of 75 mV (2244 LSB, where LSB stands for least significant bit, divided by 29925 LSBs/V, which is Moku:Pro’s digital resolution).
Prior to the alignment process, the trigger delay can be set to 0. For a gate width of 320 ns, its control register is configured as 100 (obtained by dividing 320 ns by the clock period of the Moku:Pro, 3.2 ns). Additionally, the average length was set to 100, indicating that the output is an average derived from 100 individual boxcar integrations. This value can be fine-tuned based on the quality of the final output.
The gain control is set to 65,536, effectively configuring the least significant 16 bits (fractional bits) as all zero and the integer gain (the most significant 16 bits) as one. This setting establishes a unit gain for the boxcar averager output. If noticeable quantization errors occur, this value can be increased to amplify the output. For instance, setting this control register to 655,360 would provide a 10x gain on the signal. Conversely, if saturation is observed, the value can be adjusted to 32,768 to apply a 0.5x attenuation to the signal.
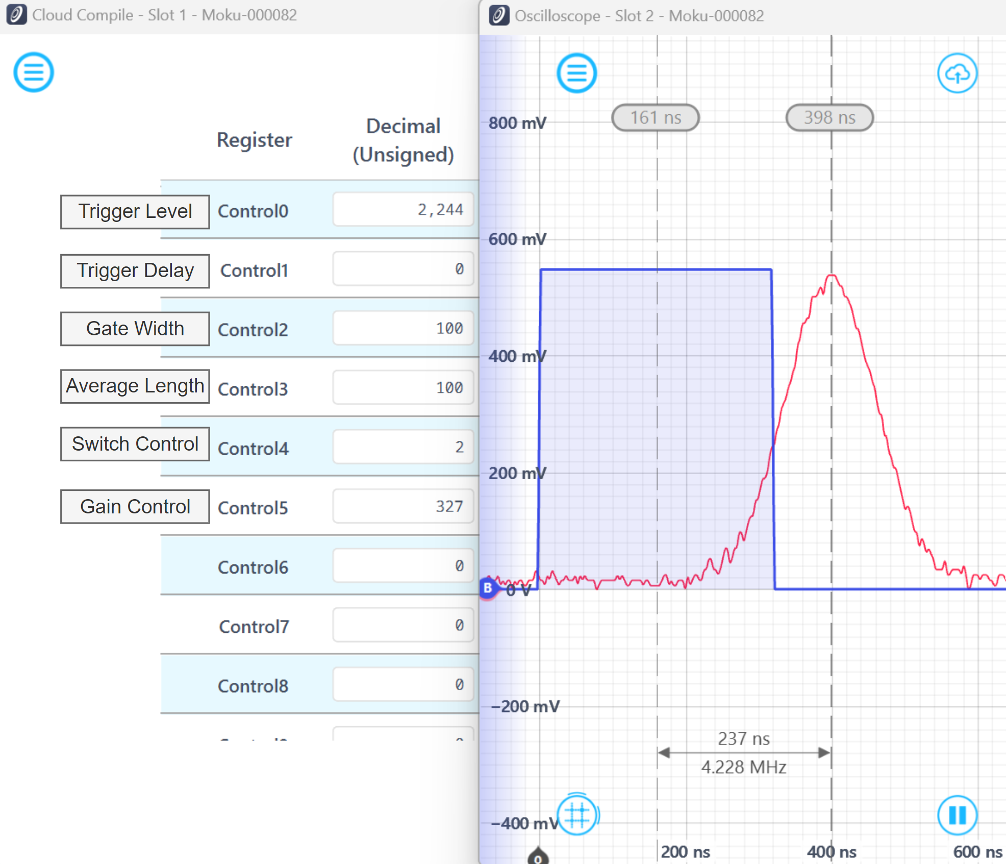
Figure 10: Trigger level is set to 2,244 (75 mV) and gate width is set as 100 for an initial width of 320 ns. Switch control is set to 2 for simultaneously visualizing the boxcar window and input signal. The trigger delay is set to 0 for clear observation of the native delay in the system. The blue trace represents the boxcar window, and the red trace is the pulse signal. The time difference between the peak and the midpoint of the boxcar window is measured at 237 ns.
Figure 10 reveals that the blue trace has a 237 ns leading interval compared to the red trace before applying trigger delay compensation. Accordingly, the adjustment was made by setting trigger delay to 74 clock periods. As indicated in Figure 11, this adjustment successfully aligned the blue and red traces, confirming that all the integrated input signals are valid pulse signals.
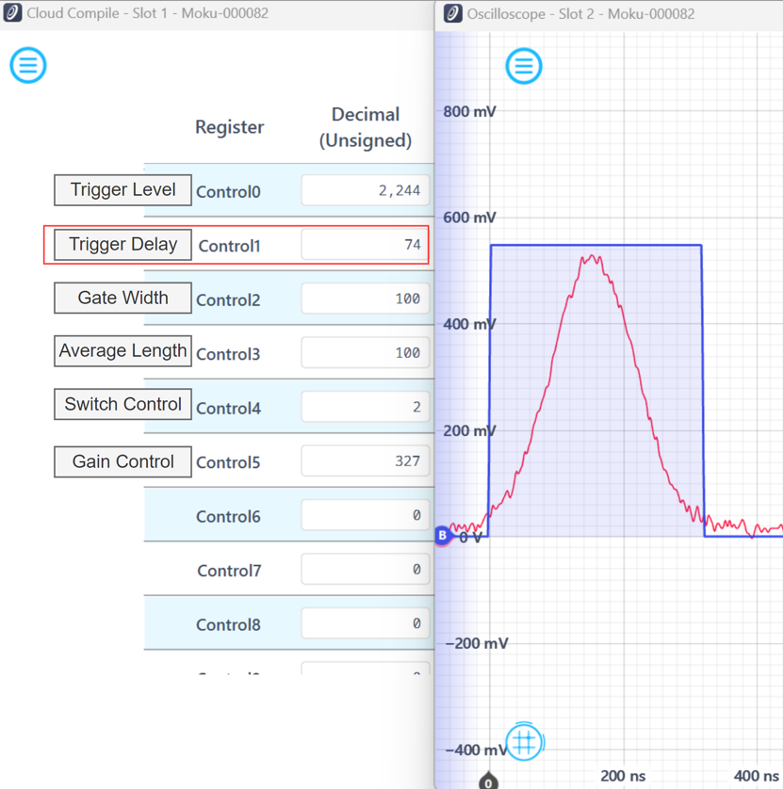
Figure 11: The trigger delay is adjusted to 74 to introduce a 236.8 ns delay to the trigger signal, successfully aligning the blue (boxcar window) and red (pulse signal) traces.
To enhance the SNR, the gate width was adjusted to 272 ns to discard unnecessary segments of the pulse signal that have a lower signal power relative to the noise power. The trigger delay is then correspondingly recalibrated to re-align the modified boxcar window with the pulse signal.
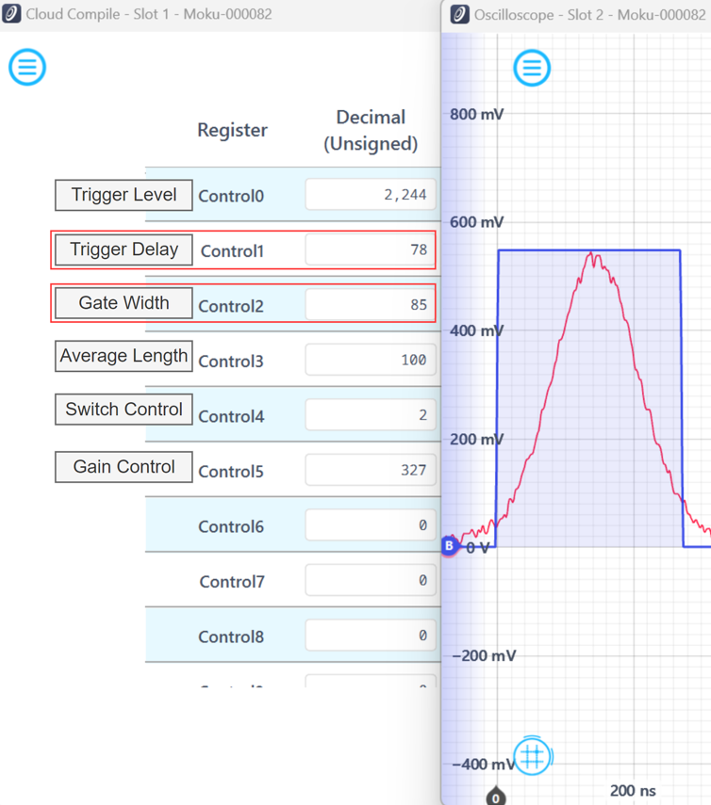
Figure 12: Gate width and trigger delay are fine-tuned to eliminate extraneous segments of the pulse signal, thereby improving the SNR in final results.
After configuring the parameters, set the switch control value to 0 to activate the transmission of the boxcar averager results through MCC’s Out A port.
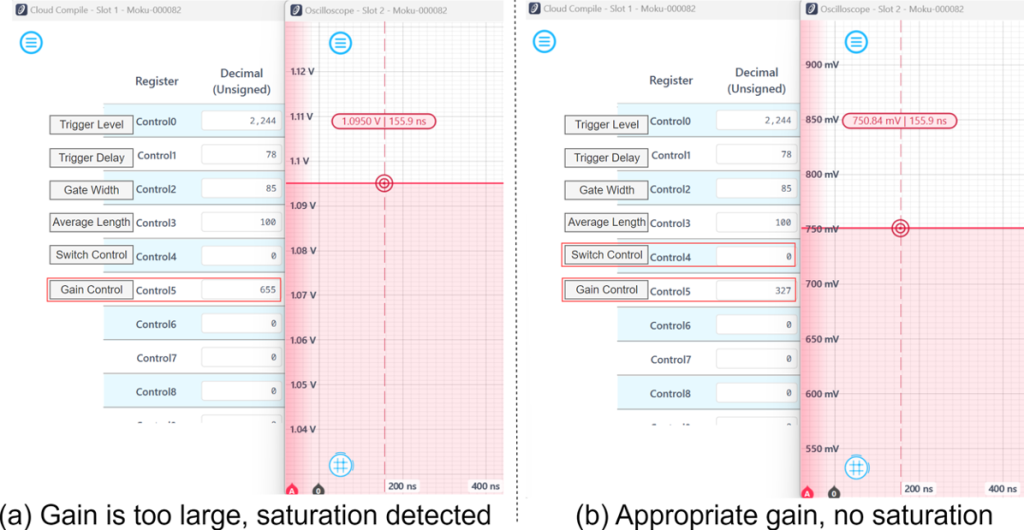
Figure 13: Switch control is configured to activate the boxcar averager output, and gain control is adjusted to 327 to scale down the value by a factor of 0.00499, preventing output saturation shown in (a). The actual output value can be recovered by using Eq. (1).
Discussions
This section outlines the limitations of the current boxcar averager. Additionally, we propose a potential enhancement to address more complex applications.
Maximal gate width
The gate width is 16 bits in size, which translates to a maximum of 65536 samples; hence, the largest achievable gate length is 209.715 µs on Moku:Pro, 524.288 µs on Moku:Lab, and 2.097 ms on Moku:Go. This calculation can be extended to trigger delay that is also 16-bit, and the maximum attainable trigger delay remains the same as the gate length. Additional trigger delay can be introduced through applying a phase-locked loop or a finite impulse response (FIR) filter.
Dual boxcar averager
In certain experimental scenarios, the excitation or stimulus pulses are configured to operate at half the frequency of the measured signal pulses, as seen in applications like pump-probe spectroscopy utilizing a laser modulation frequency set at half the laser repetition rate. In such instances, the actual signal that carries information about the excited state of the object is present only in every second pulse, while the first pulse contains the background level. To isolate and extract the desired signal, a dual boxcar averaging approach becomes essential, which involves taking the difference between the first and second pulses. Importantly, this subtraction process serves a dual purpose by not only extracting the relevant signal but also contributing to the elimination of DC baselines in the acquired signals.
The adaptability facilitated by MCC makes the implementation of a dual boxcar averager straightforward. Detailed insights into this aspect will be provided in the upcoming application note.
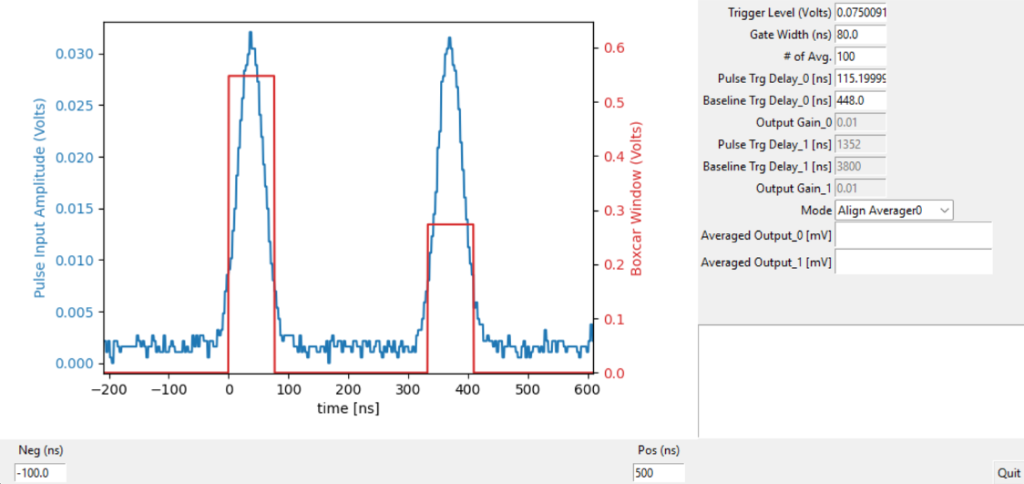
Figure 14: Each trigger activates two boxcar windows (high: pulse boxcar window; low: baseline boxcar window) to integrate two probe pulses (with & without pump) simultaneously. The output is the difference between the two integration results.
Summary
This application note provides insights into the principle of a boxcar averager. It demonstrates the implementation and functionality of a boxcar averager using Moku Cloud Compile (MCC) on a Moku:Pro. To explore the Simulink example for the boxcar averager, click here. The configuration of the boxcar averager can be achieved through either the Python control panel or direct control registers. Additionally, this application note addresses potential improvements for future iterations.
Questions?
Get answers to FAQs in our Knowledge Base
If you have a question about a device feature or instrument function, check out our extensive Knowledge Base to find the answers you’re looking for. You can also quickly see popular articles and refine your search by product or topic.
Join our User Forum to stay connected
Want to request a new feature? Have a support tip to share? From use case examples to new feature announcements and more, the User Forum is your one-stop shop for product updates, as well as connection to Liquid Instruments and our global user community.
