Introduction
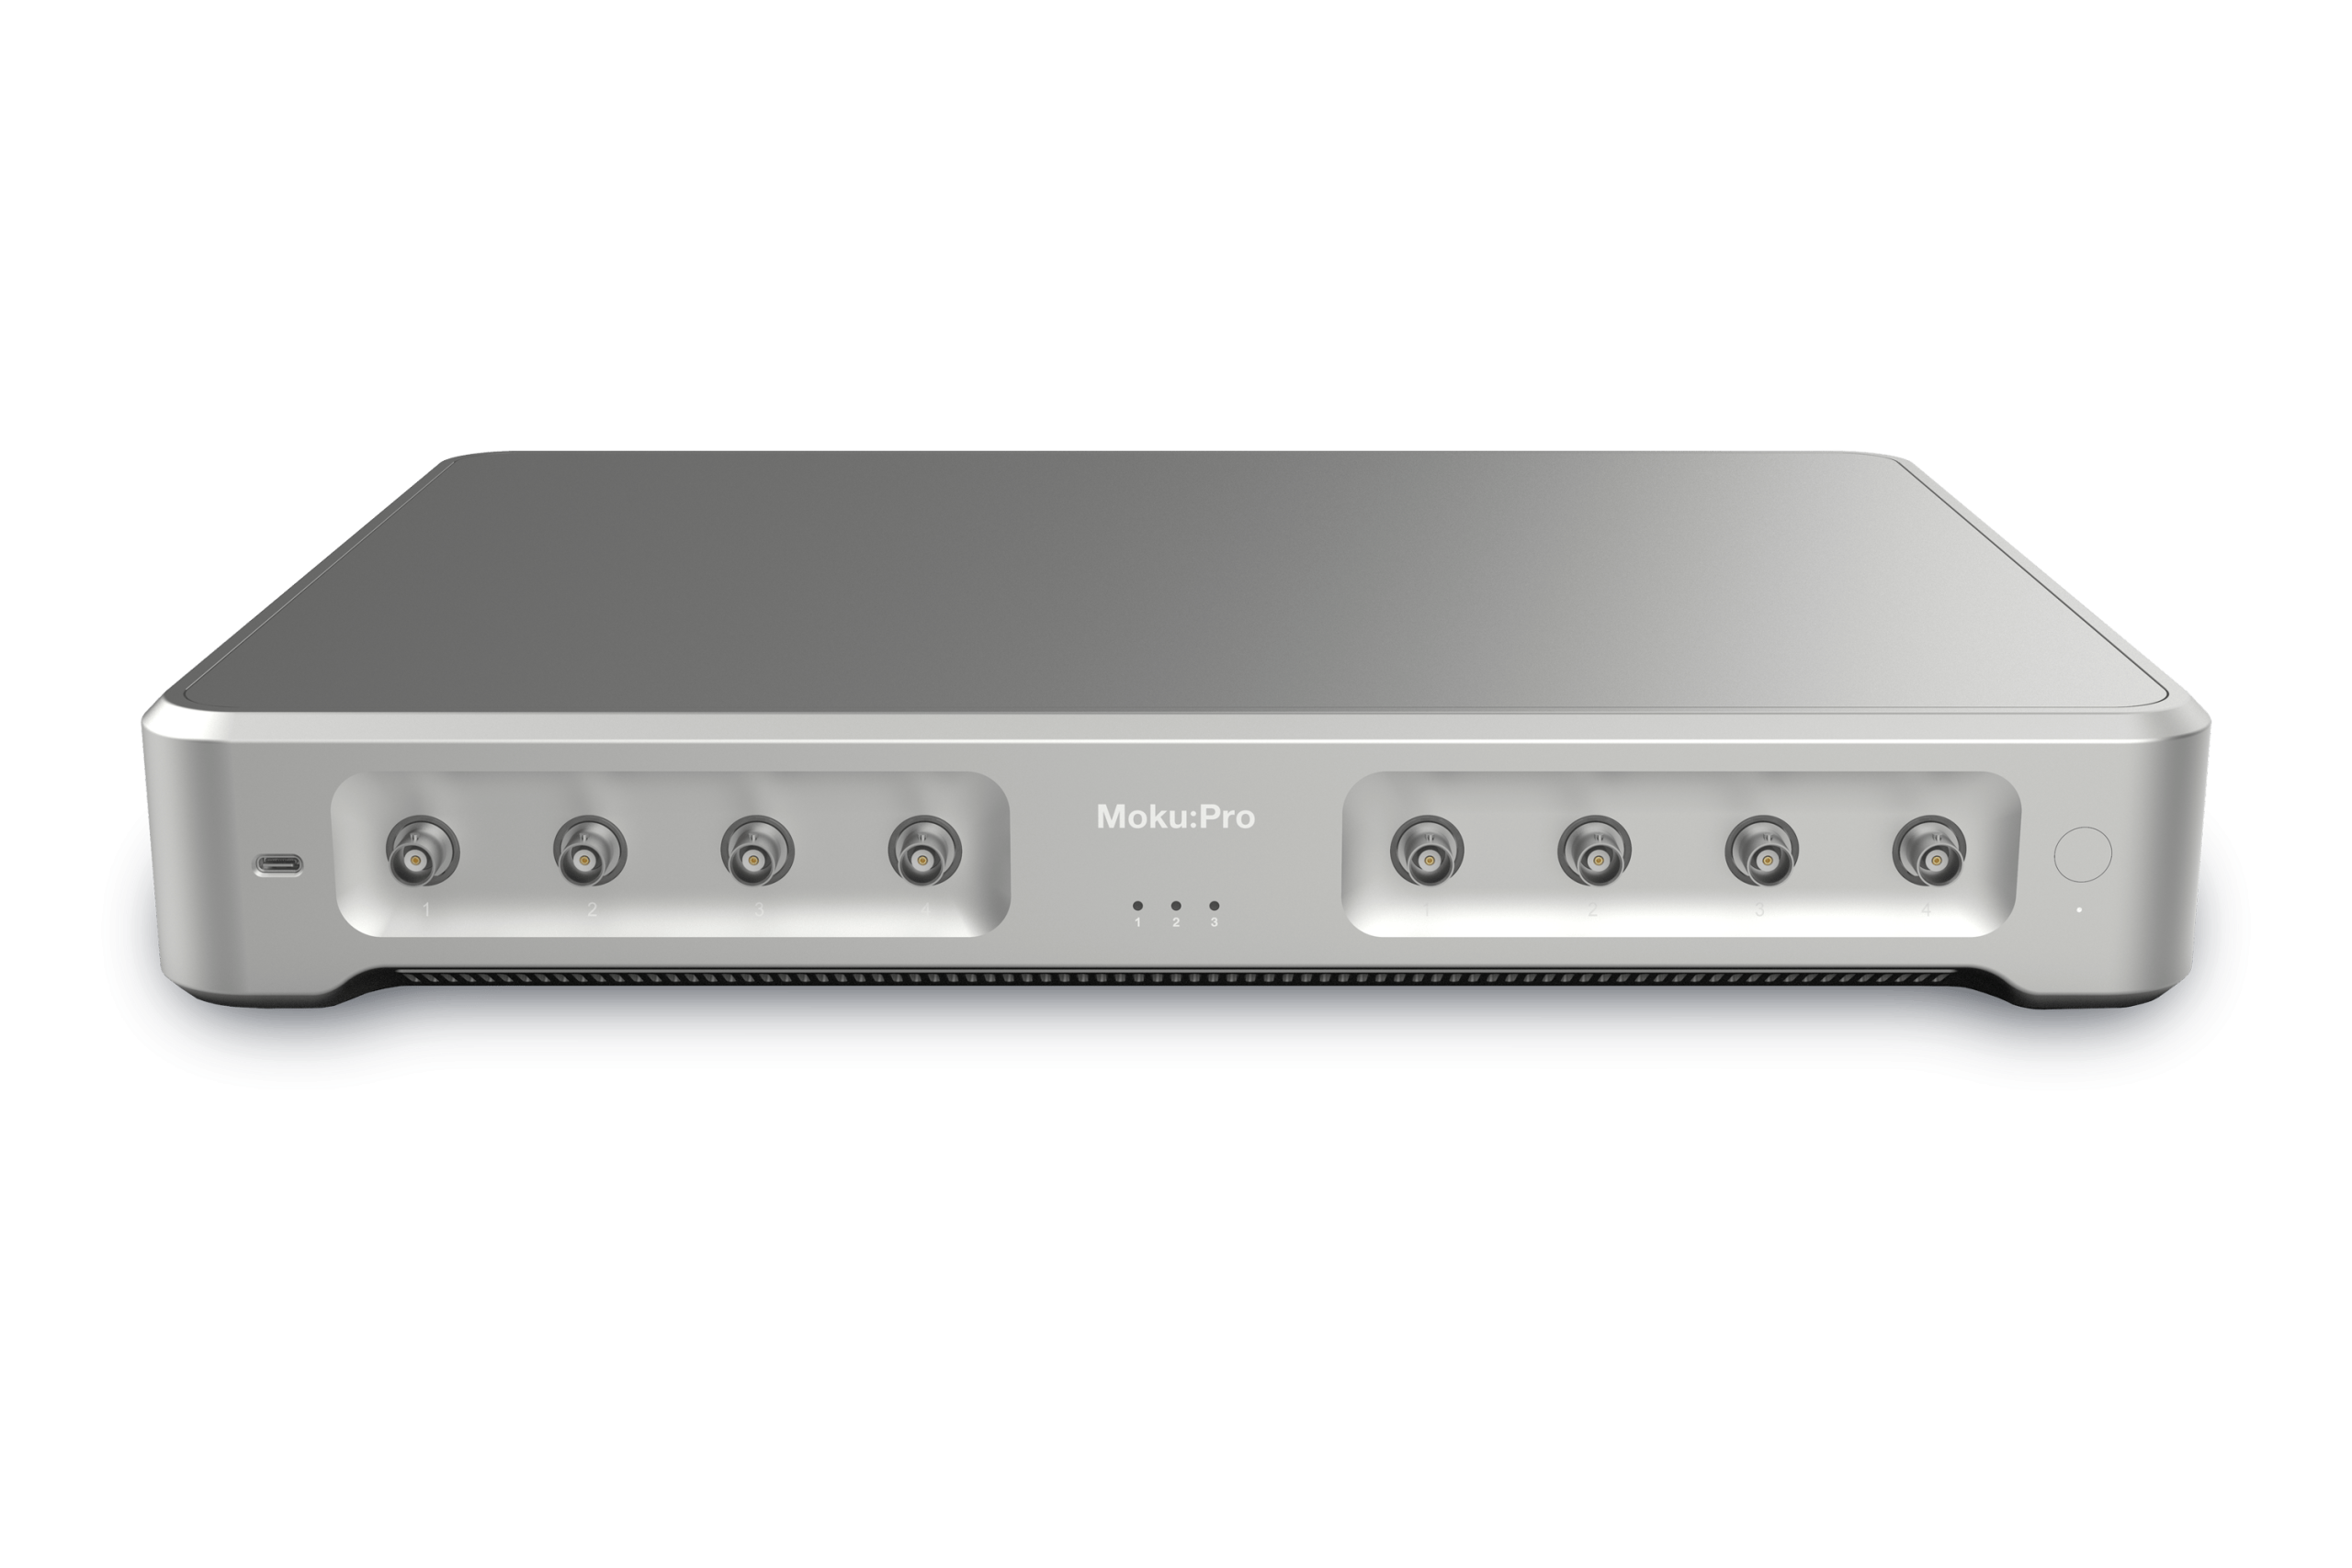
The Moku:Pro Frequency Response Analyzer (FRA) is designed to drive a device under test (DUT) with a swept sine wave and retrieve the amplitude and phase responses by a direct-conversion receiver. Before the 2.4.0 software update, the measured amplitude response could be represented as either the absolute amplitude in dBm or relative In÷Out amplitude in dB. A dynamic reference mode is now available on Moku:Pro in the latest version of Moku software. In this mode, the amplitude response is measured in In÷In1 (dB) which normalizes each input signal using the signal on Input 1. Thus, the FRA can continuously measure the amplitude of the driving signal at the input of the DUT and dynamically change the denominator for the relative amplitude calculation.
In this blog post, we will introduce how to use the In÷In1 measurement mode to isolate the frequency response of a single component in a multi-stage filter and increase the measurement’s dynamic range by shaping the driving signal.
As of version 3.0, Dynamic Amplitude adjustments are also available. Find out more here.
Isolate the frequency response of a multi-stage filter
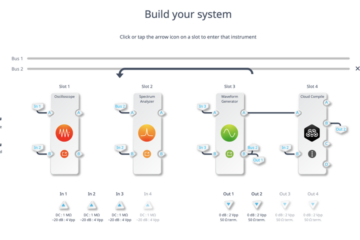
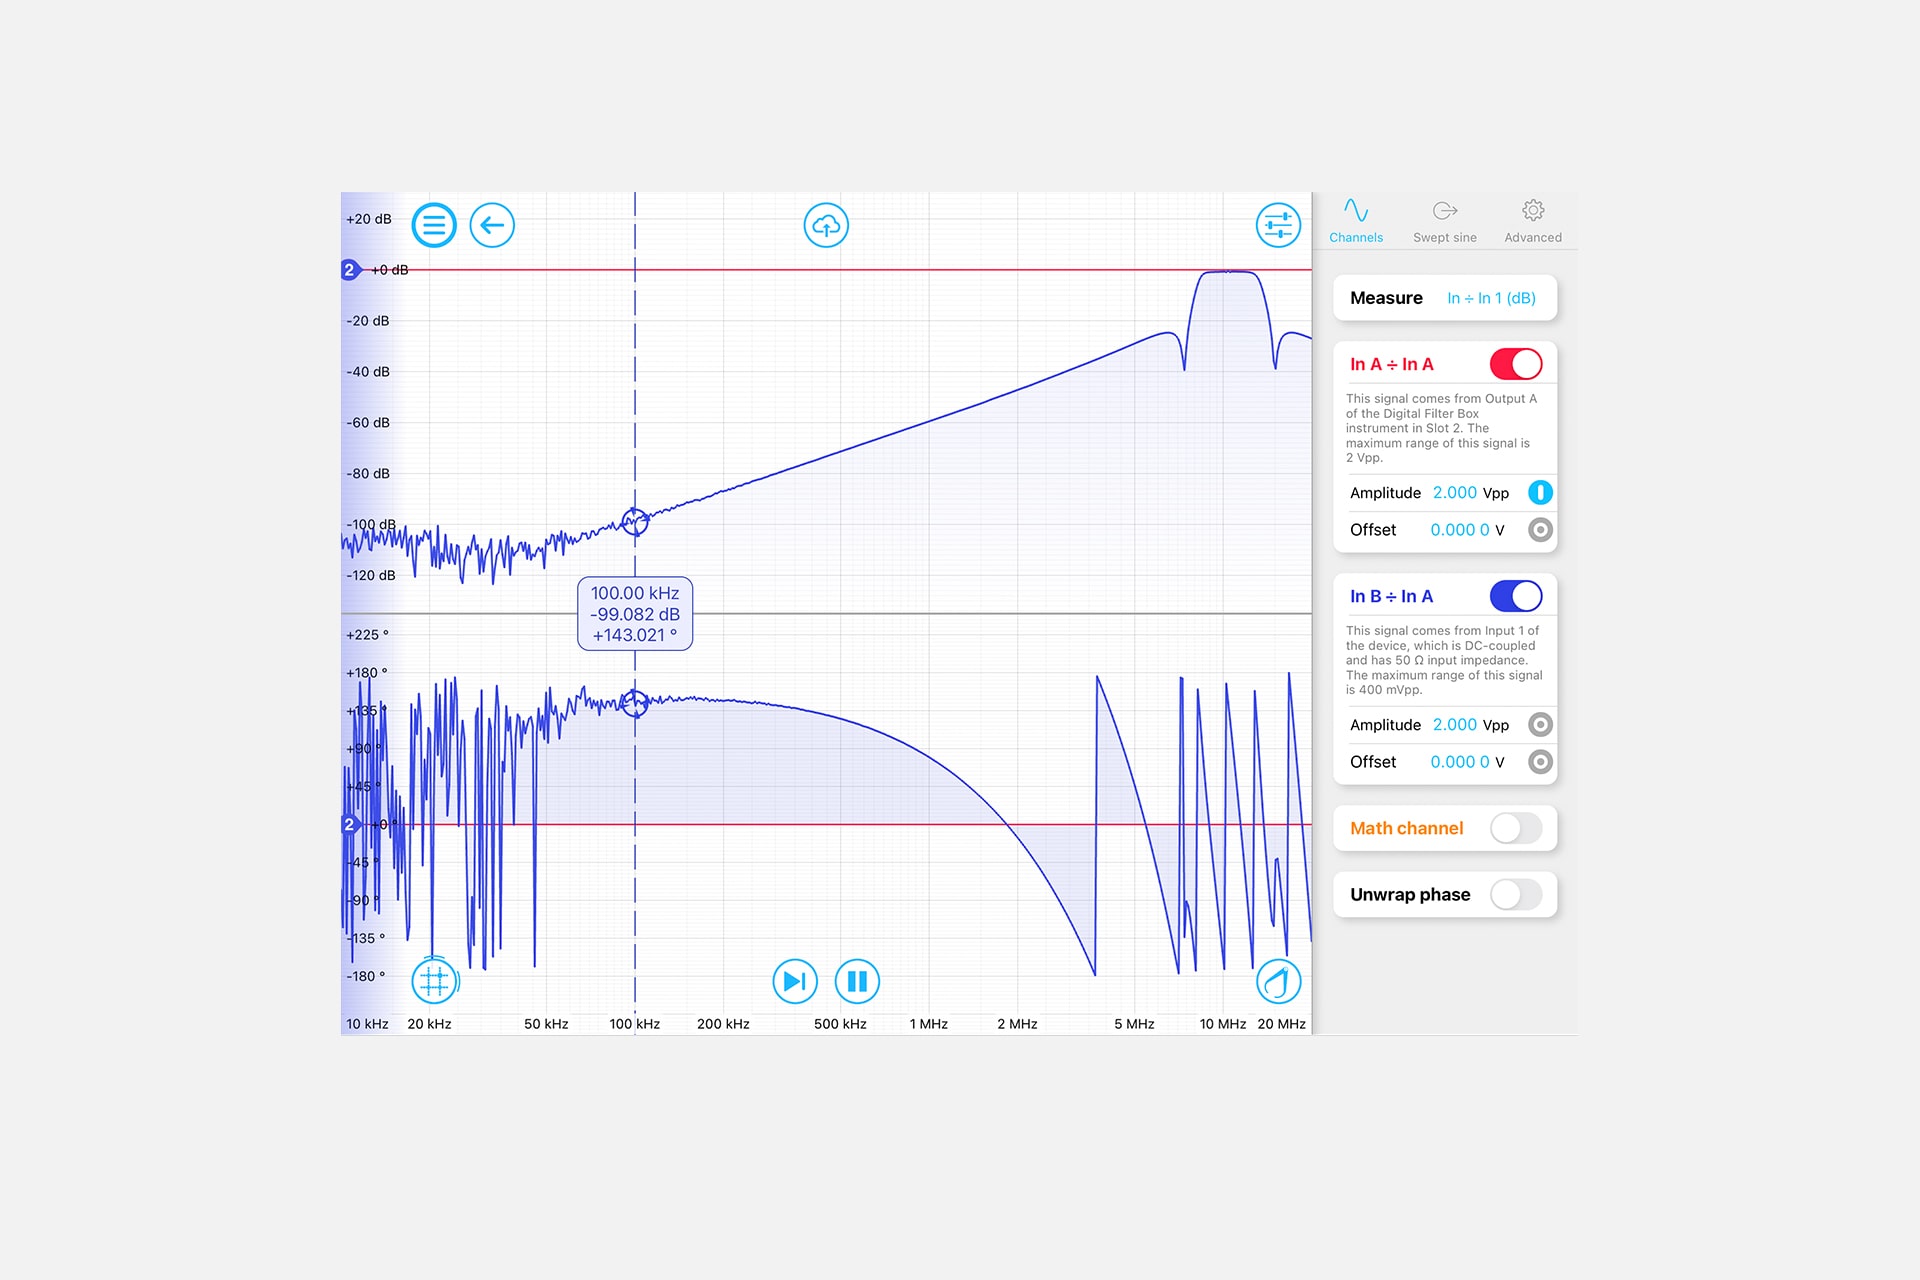
In many designs, an electronic filter is made by combining multiple filters into a multi-stage filter. The In÷In1 mode allows users to continuously probe the driving signal at the input of the DUT and use it as the reference for the relative amplitude calculation. Therefore, the frequency response of a subsequent DUT can be isolated from the overall frequency response of the system without changing the driving point. In this example, a two-stage filter was created using two Digital Filter Box instruments in Multi-Instrument Mode (MIM). An FRA is deployed to probe the frequency response after each filter stage, as shown in Figure 1.

Figure 1: A two-stage filter was created and measured by the FRA in MiM
By configuring the FRA in In÷Out mode, as shown in Figure 2(a), the first-stage (red) and the overall transfer function (blue) were measured. The isolated frequency response (blue) of the second stage was retrieved by switching to In÷In1 mode as shown in Figure 2(b).

Figure 2: The measured frequency response of the two-stage filter with (a) In÷Out (dB), and (b) In÷In1 (dB) modes
Extending the measurement dynamic range
The upper and lower voltage limits which determine the dynamic range are bounded by the input range and analog front-end noise. For DUTs with high attenuation, a high amplitude driving source elevates the minimal response of the DUT. Therefore, a very high attenuation can be measured in dB. On the other hand, a high driving voltage may saturate the input for DUTs with low attenuation. For a DUT whose amplitude response varies strongly with frequency, it is hard to measure the frequency response with high dynamic range using a constant driving source, as shown in Figure 3. A bandpass filter was connected in between the input and output of Moku:Pro. The solid red trace was captured with a 2 Vpp driving output, and the faint red trace was captured with a 100 mVpp driving output. The higher output amplitude provided a significantly better floor below 100 kHz. However, the measurement was clipped at the passband.
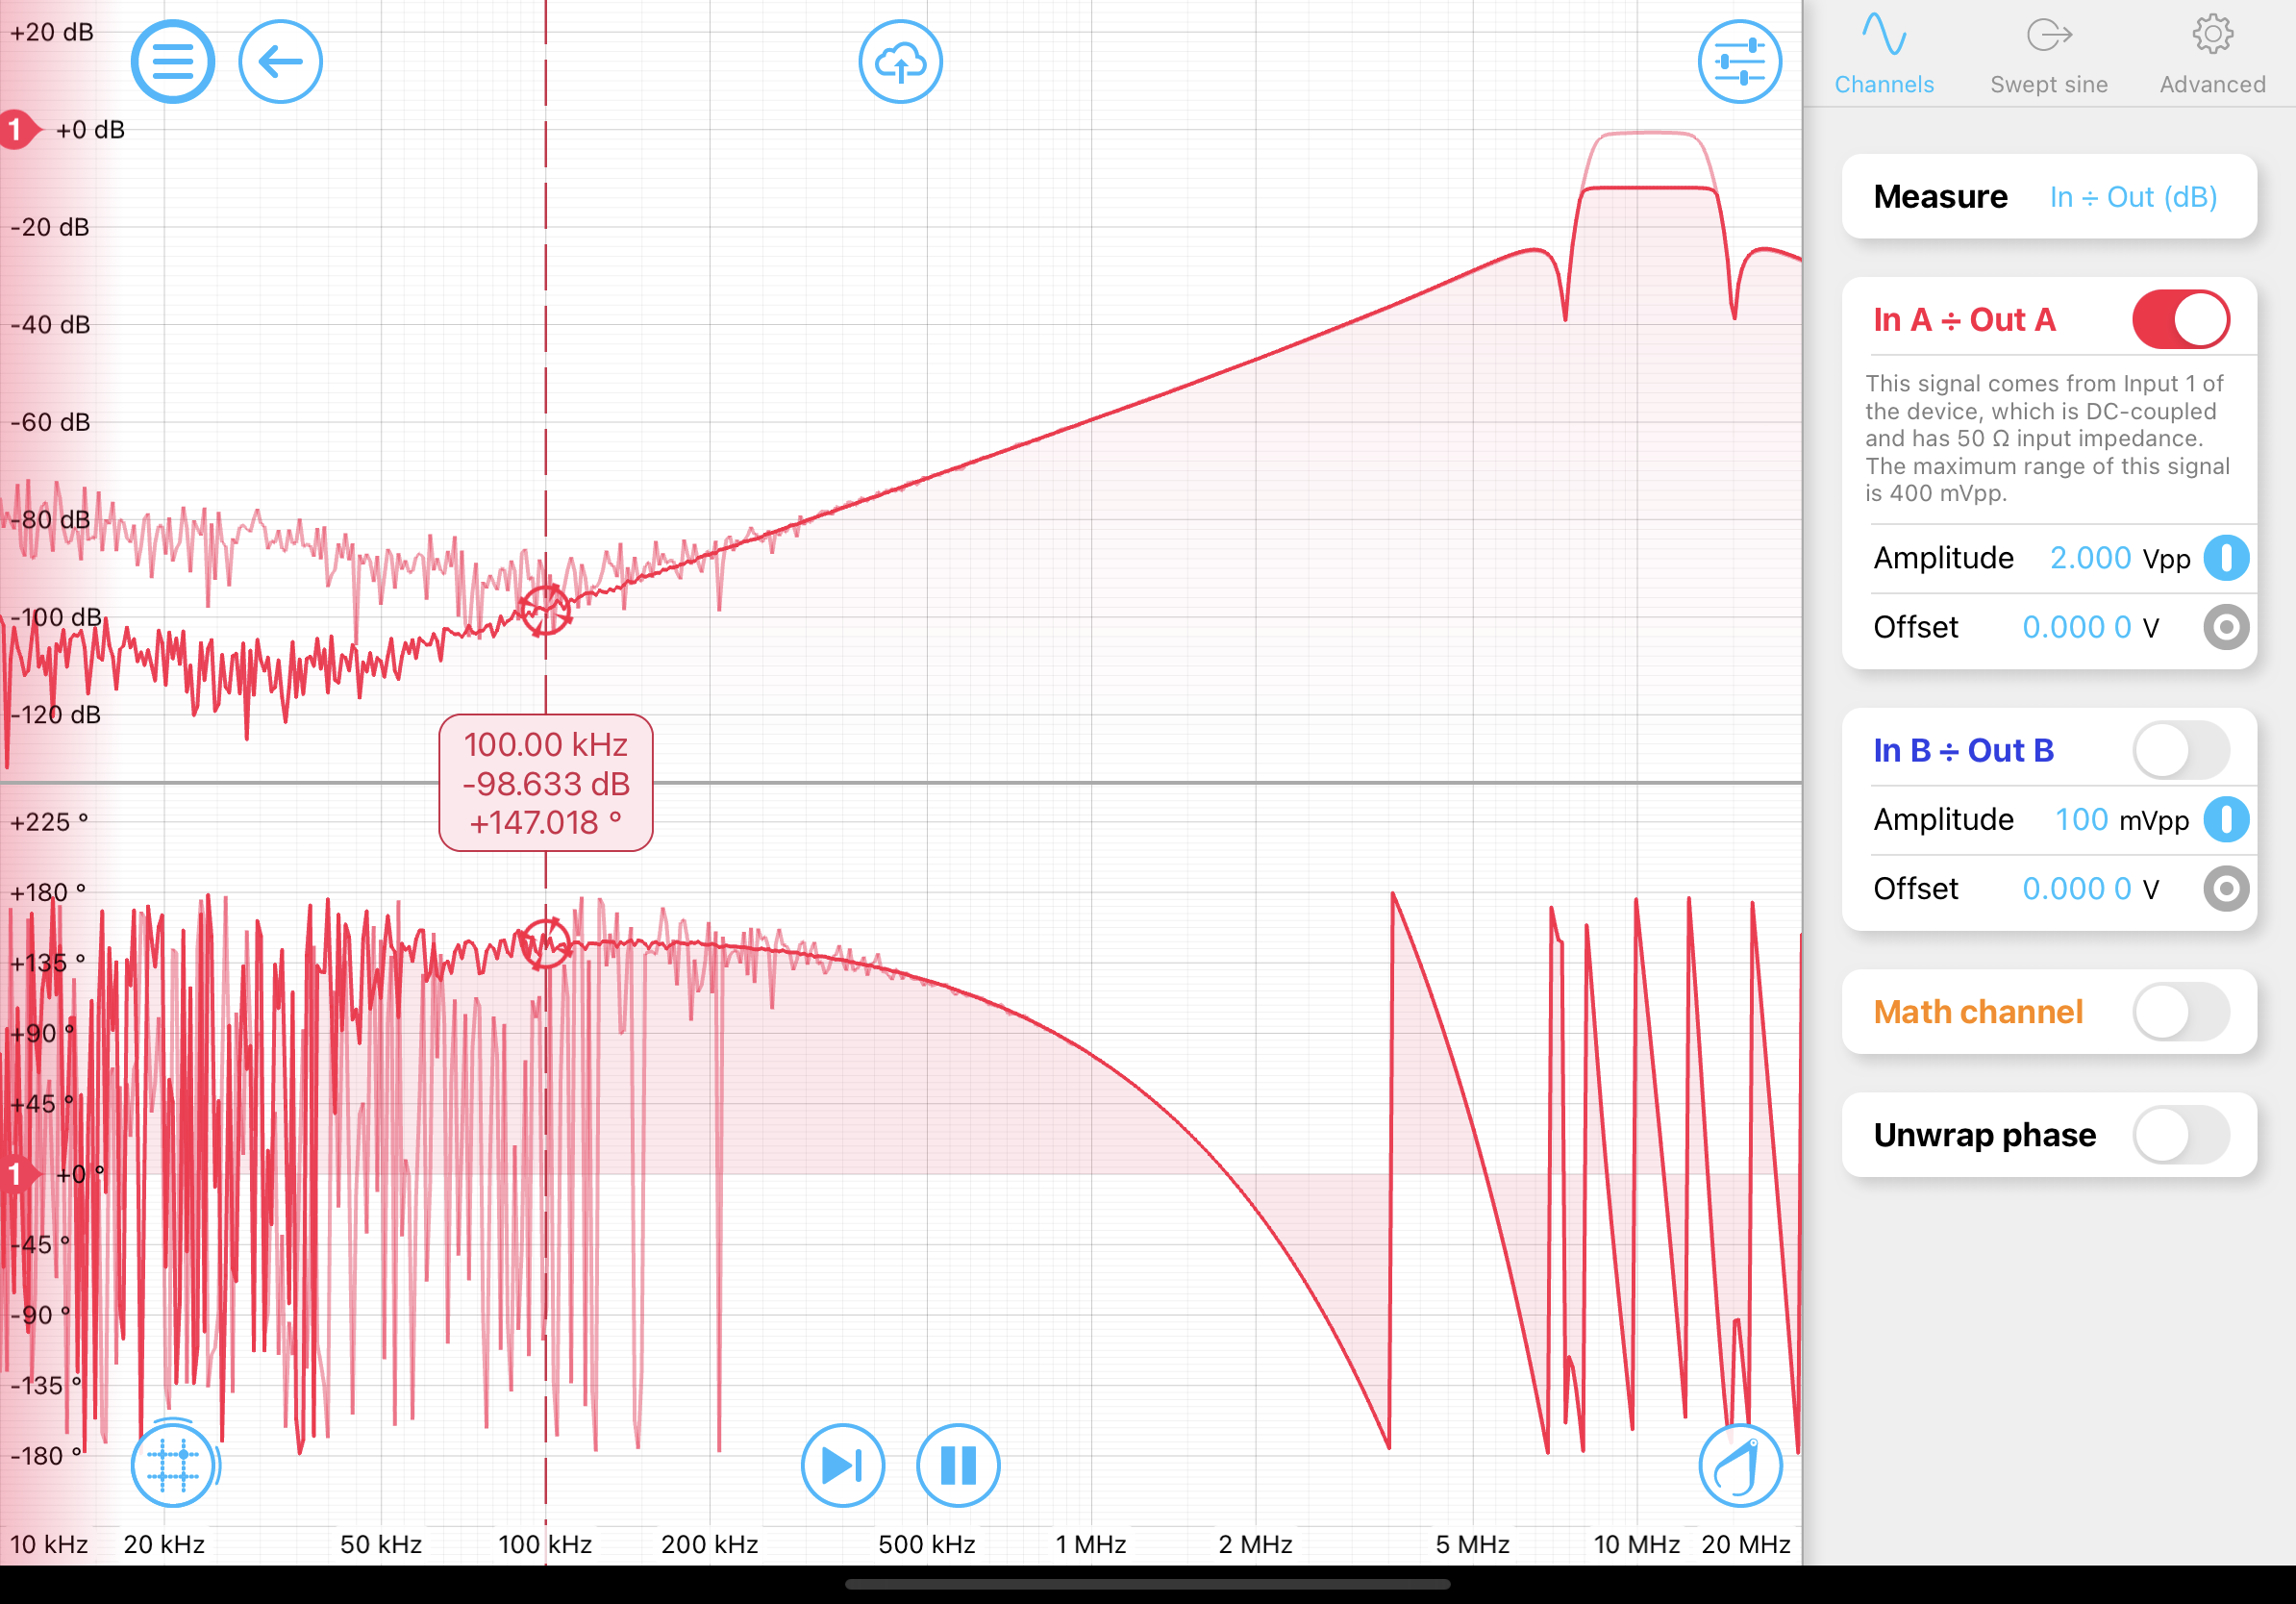
Figure 3: Frequency responses of a bandpass filter with 2 Vpp (solid red) and 100 mVpp (faint red) driving signal
In this example, instead of using a constant output power, the swept sine wave from the FRA was first shaped by a digital filter in another instrument slot allowing a higher output power in the DUT’s stop band and lower output power in the DUT’s passband, as shown in Figure 4(a). Then, the shaped output was sent back to Input A of the FRA as the reference, and to Output 1 to drive the DUT. With In÷In1 mode enabled, the dynamic range of the measured frequency response was significantly improved, as shown in Figure 4(b).

Figure 4: The frequency response of the bandpass filter with a shaped swept sine wave. (a) The MiM configuration and the filter setting; (b) The measured high dynamic range frequency response
In summary, In÷In1 mode in the FRA can isolate the frequency response of a subcomponent from a more complicated system and shape the swept-sine output to provide larger measurement dynamic range. To learn more about the new features for the 2.4.0 update, read the release blog here.
Have questions or want a printable version?
Please contact us at support@liquidinstruments.com
