Raman effect was first discovered in the 1920s by C.V. Raman1, 2. It is a widely used spectroscopic method to determine the vibrational modes of molecules3, 4. Compared to other analytical chemistry methods, spectroscopic approaches provide high spatial resolution. No direct contact is required to obtain chemical information. The vibrational spectrum offers reasonable chemical specificity without the need for additional labels. However, the spontaneous Raman effect is a weak scattering process. For imaging and microscopy applications, it can take hours of signal integration time to acquire a single field of view5. Therefore, coherent Raman scattering methods, such as stimulated Raman scattering effect, are now widely used for Raman imaging. In this application note, we will describe how the Moku:Lab Lock-in Amplifier is implemented in a state-of-art stimulated Raman imaging setup at Boston University.

Introduction to stimulated Raman scattering microscopy
Raman spectroscopy is a non-destructive analytical chemistry technique. It directly probes the vibrational mode of samples. Compared to electronic spectroscopy, Raman spectroscopy, including stimulated Raman spectroscopy, provides high chemical specificity without the need for fluorescent labels. The sample can be interrogated in a completely contact-free and label-free manner, preventing perturbations to the system6,7. Infrared (IR) spectroscopy is another commonly-used method for obtaining vibrational spectra. The selection rule for IR and Raman spectroscopy is different; IR spectroscopy is sensitive to changes in dipole, and Raman is sensitive to changes in polarizability4. This makes IR and Raman good tools for a specific set of chemical bonds. For imaging and microscopy applications, there are two other important factors to be considered when choosing between IR or Raman spectroscopy: 1) Spatial resolution requirement. IR spectroscopy uses IR light as a light source. Raman can use visible or near-IR (NIR) lasers for excitation. As the visible or NIR lasers have a much shorter wavelength, the spatial resolution for Raman microscopes can reach in the sub-micron range. On the other hand, IR light has a wavelength of several microns. The spatial resolution is considered poor for many microscopy applications. 2) Water has strong absorption in the IR region. For a water-rich environment (such as biological samples), IR can suffer from strong background absorption. Therefore, Raman is preferred in some cases.
Raman scattering is very weak compared to the dominant Rayleigh scattering. A long integration time of several seconds is typically required to get a reasonable signal-to-noise ratio. This may not be a problem for regular spectroscopy, but for spectroscopic imaging it may take several hours to get a single field of view. To enhance the signal, several different approaches have been developed over the years. The plasmon-based methods, such as surface-enhanced Raman spectroscopy, further reduce the limit-of-detection to the single-molecule level8. In contrast, the induced inhomogeneity of the nanoparticles make it difficult for imaging. The more promising approach for imaging scientists is the nonlinear optics-enhanced coherent Raman scattering methods: stimulated Raman scattering (SRS) and coherent anti-Stokes Raman scattering (CARS).

Figure 1: The FM signal at 10 MHz generated by Moku:Lab’s Waveform Generator
The Coherent Raman effect was first discovered in the 1960s6. In the late 1990s and 2000s, thanks to the advances in ultrafast mode-locked lasers, Sunney Xie and co-workers pioneered the use of CARS9 and SRS10 for label-free chemical microscopy. Since then, these techniques have been widely used in chemistry, biology, and material science studies6,7,11. CARS and stimulated Raman scattering have many similarities; these nonlinear optical processes typically happen under the same conditions and the instrumental setups are almost identical. However, there are a few differences; just like spontaneous Raman, CARS signal (Figure 1, ωas anti-Stokes) occurs at a different wavelength compared to the incoming laser beams (ωp, pump, ωs Stokes). it is easy to separate the signal from the incident lights with short-pass filters. The total amount of photons that arrive at the detector is small, and more sensitive photon detectors, such as photomultiplier tubes (PMTs) are used for detection. However, CARS suffers from backgrounds that are generated by other non-resonant nonlinear optical effects. These effects not only limit the practical limit-of-detection for CARS measurements, but also distort the spectrum (compared to the molecular vibrational resonances). On the other hand, SRS signals are not interfered with by most other nonlinear optical effects. However, SRS is a stimulated emission process. The signal occurs at the same wavelength as the incident lights. The SRS effect only slightly increases/decreases the number of photons for the Stokes and pump beam, respectively. The changes are so small that they cannot be measured by regular time-domain measurement methods. Therefore, optical pump-probe techniques with lock-in detection are required for SRS.
Optical pump-probe technique and lock-in detection
The pump-probe method is a widely adopted method for detecting multi-photon processes in stimulated Raman scattering microscopy. The experiment typically involves two ultrafast (picosecond or femtosecond) laser beams. One beam illuminates the sample at all times, while the second beam is AM-modulated at a constant frequency. Therefore, any change or perturbation induced by the second beam is transferred to the first beam at the modulation frequency. On the detector, an optical filter is used to block the modulated beam. Only the unmodulated wavelength is detected. As the signal only occurs near the modulation frequency, a lock-in amplifier (LIA) is typically used to amplify the signal. A lock-in amplifier uses the homodyne detection method, where it mixes the incoming signal with a sinusoidal local oscillator at the modulation frequency. Then it sends the signal through a low-pass filter and voltage amplifier (optional) and outputs to a digitizer or an oscilloscope. This ensures only the signal that is very close to the modulation frequency is amplified and detected. Signals at other frequencies (such as the laser repetition frequency or DC background) are rejected. This makes the lock-in amplifier an essential tool for pump-probe detection. More detailed explanations about lock-in amplifiers can be found in the following videos: https://youtu.be/H2O2ADqEkHM and https://youtu.be/M0Q91_ns2Cg.
For stimulated Raman scattering in particular, the two beams (pump and Stokes) are tuned with an energy difference that precisely matches the Raman shift of interest. In theory, either the pump or the Stokes beam can be modulated where the other beam is used for detection. If the pump beam is modulated, the SRS process induces a slight increase in Stokes beam with the pump beam on. At the detector, the pump beam is blocked, and only the Stokes beam is detected. This is called stimulated Raman gain (SRG) detection. If the Stokes beam is modulated, the SRS process induces a slight decrease in the pump beam with the Stokes beam on. At the detector, the Stokes beam is blocked, and only the pump beam is detected. This is called stimulated Raman loss (SRL) detection. For the example use case presented in this application note, an SRL scheme is implemented as the photodetector is optimized for the pump wavelength.

Figure 2: SRL and SRG detections for SRS microscopy
Stimulated Raman scattering experiment setup with Moku:Lab
Laser
The generation of stimulated Raman scattering requires two ultrafast laser pulses overlapping on the sample, both spatially and temporally. To get the stable temporal overlaps, today’s SRS microscopes typically use a single Ti:Sapphire laser to generate both the pump and Stokes beam. Both picosecond and femtosecond lasers can be used for SRS measurement. Picosecond lasers provide finer spectral profiles. High spectral resolution can be achieved without the need for additional optics. Unlike spontaneous Raman, where all Raman shifts can be measured simultaneously with a single-color laser, stimulated Raman requires wavelength tuning to measure additional spectral points, and tuning the laser wavelength limits the rate of measurement when acquiring spectroscopic images. On the other hand, femtosecond lasers natively have a broad spectrum. A technique called “spectral focusing” can be used to quickly tune the energy difference between the pump and the Stokes beam. A spectroscopic image can be acquired in a much shorter time frame. However, this method also significantly increases the optical complexity of the system. A pair of diffraction gratings or high refractive index material (such as SF57 glass rods) needs to be added into the beam path, and the spectral range is limited. A detailed explanation on the spectral focusing method can be found in a recent publication12.
In short, if a single Raman shift is interested at a time, a picosecond laser is much simpler to set up. A femtosecond laser is preferred for fast hyperspectral image acquisition, at the cost of system complexity. Moku:Lab LIA can be paired with both picosecond and femtosecond lasers. In the use case presented in this application note, a femtosecond laser (Spectra-physics Mai Tai) was used along with SF57 glass rods for spectral focusing.
Modulation, delay stage, and scan heads
The pump and Stokes beam are typically modulated by an acousto-optic modulator (AOM) or an electro-optic modulator (EOM). The modulation frequency is typically in the MHz range. This helps to reduce the background generated by photo-thermal expansion and lift the image acquisition speed. In this application note, the pump beam was modulated by an AOM at around 2 MHz.
To align the pump and Stokes beam temporally, a motorized delay stage is used to adjust the pathlength of either or both beam paths. For femtosecond SRS with spectral focusing, the delay stage is also used to fine-tune the energy difference between the pump and Stokes beam.
Like most other nonlinear optical microscopies, a beam-scanning method is typically used for CARS and SRS image acquisition. A pair of galvo-galvo or galvo-resonant scan heads are placed before the objective. In the presented case, a pair of galvo mirrors (GVS 102, Thorlabs) were used.
Objective/condenser, detector, and data acquisition
After the scan heads, the beam is then directed to the objective to form a tightly-focused point on the sample. A high numerical aperture (NA) water or oil immersion objective is preferred for establishing the phase-matching conditions for coherent Raman scattering. The light is then collected in the forward direction and refocused on to the photodetector. To ensure the collection efficiency, an oil-immersion objective is recommended. In the presented case, a 60X 1.2 NA water immersion objective (UPLSASP 60XW, Olympus) was used.
Once the light is collected by the condenser, it is then refocused onto a photodiode after an optical filter to block the modulating beam. The signal from the photodiode is then sent to the lock-in amplifier (a preamp/transimpedance amplifier may be required dependent on the photodiode configuration). The lock-in amplifier mixes the signal with the local oscillator and converts the AC signal at the modulation frequency to a DC output. It is then sent to the data acquisition system to form an image. In this application, a Hamamatsu S3994-01 paired with a home-built transimpedance amplifier were used to detect the leftover light after the optical filter. The signal was then sent to Moku:Lab’s LIA for AC signal amplification and conversation. The input was demodulated with external (PLL) mode. A 7 μs, 2nd order low-pass filter was used after the mixer. The demodulated signal was then sent to the analog output after a 10 dB gain. The output from the LIA was digitized by a NI DAQ system, and the images were generated by a home-built NI virtual instrument.

Figure 3: SRS microscope with Moku:Lab LIA
Results and discussion
To test the Moku:Lab LIA performance, a droplet of dimethyl sulfoxide (DMSO) was sandwiched between two coverslips. The edge of the droplet was then imaged by the stimulated Raman scattering microscope. The laser was tuned with a 798 nm pump (30 mW) and 1040 nm Stokes (150 mW) before the scan heads. In total, 100 images were acquired across the entire spectrum range. The time constant of the LIA was set to be 7 μs. Figure 4 illustrates the X-Y profile of the droplet edge, and a Z-profile (Raman spectrum) is plotted on the right. The two main peaks induced by C-H bond vibrational resonance can be clearly observed.
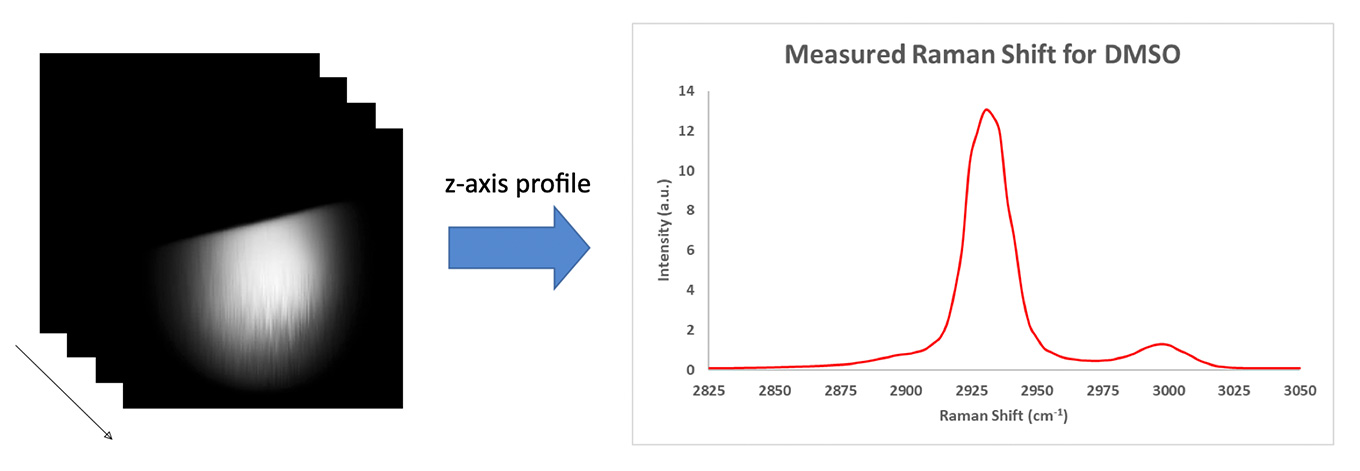
Figure 4: Hyperspectral SRS images of a DMSO droplet
To access the signal-to-noise ratio (SNR) of the image, the brightest image (near 2930 cm-1) is used. The SNR was calculated by the mean intensity of a 10 by 10 box in the droplet area over the standard deviation of 10 by 10 box in the background area. An SNR of 1100 was observed.
Acknowledgment
We would like to thank Prof. Ji-Xin Cheng, Peng Lin, and Haonan Lin at Boston University providing us the details of their experiment, explanation of the use of Moku:Lab and feedback.
References
- Raman, C. V. (1922). The molecular scattering of light. University of Calcutta.
- Raman, C. V. (1928). A new radiation.
- Long, D. A. (1977). Raman spectroscopy. New York, 1-12.
- Colthup, N. (2012). Introduction to infrared and Raman spectroscopy. Elsevier.
- Zhang, S., Song, Z., Godaliyadda, G. D. P., Ye, D. H., Chowdhury, A. U., Sengupta, A., … & Simpson, G. J. (2018). Dynamic sparse sampling for confocal Raman microscopy. Analytical chemistry, 90(7), 4461-4469.
- Prince, R. C., Frontiera, R. R., & Potma, E. O. (2017). Stimulated Raman scattering: from bulk to nano. Chemical reviews, 117(7), 5070-5094.
- Zhang, C., & Cheng, J. X. (2018). Perspective: Coherent Raman scattering microscopy, the future is bright. APL Photonics, 3(9), 090901.
- Nie, S., & Emory, S. R. (1997). Probing single molecules and single nanoparticles by surface-enhanced Raman scattering. Science, 275(5303), 1102-1106.
- Zumbusch, A., Holtom, G. R., & Xie, X. S. (1999). Three-dimensional vibrational imaging by coherent anti-Stokes Raman scattering. Physical review letters, 82(20), 4142.
- Freudiger, C. W., Min, W., Saar, B. G., Lu, S., Holtom, G. R., He, C., … & Xie, X. S. (2008). Label-free biomedical imaging with high sensitivity by stimulated Raman scattering microscopy. Science, 322(5909), 1857-1861.
- Cheng, J. X., & Xie, X. S. (Eds.). (2016). Coherent Raman scattering microscopy. CRC press.
- Liao, C. S., Huang, K. C., Hong, W., Chen, A. J., Karanja, C., Wang, P., … & Cheng, J. X. (2016). Stimulated Raman spectroscopic imaging by microsecond delay-line tuning. Optica, 3(12), 1377-1380.
Have questions or want a printable version?
Please contact us at support@liquidinstruments.com