






This recap and Q+A complement our webinar, entitled “Advancing time interval measurement techniques with FPGA-based instrumentation,” which we co-hosted with Optics.org on May 22, 2024. If you weren’t able to attend live, you can register now for on-demand access. In addition to a webinar summary, we’re providing in-depth answers to select audience questions below.
Webinar recap
The presentation consisted of three segments. First, we introduced the concept of time interval analysis and discussed common features and functions of time interval measurements devices, such as event detecting, counting, time stamping, and statistical analysis. We explored the various applications in which time interval analyzers are used, focusing on three specifically: oscillator characterization, photon counting, and free-space optical communications. We also discussed some issues with modern time interval instrumentation and software. Next, we presented the Moku Time & Frequency Analyzer as an instrument that addresses many of the issues raised earlier, by virtue of its fine digital resolution, high data throughput, and live histogram generation. Finally, we concluded the talk with a live demonstration of the Moku Time & Frequency Analyzer, configuring the instrument for each of the use cases presented.
Questions from the audience
Is the 780 fs figure the theoretical resolution? What is the actual measurement resolution?
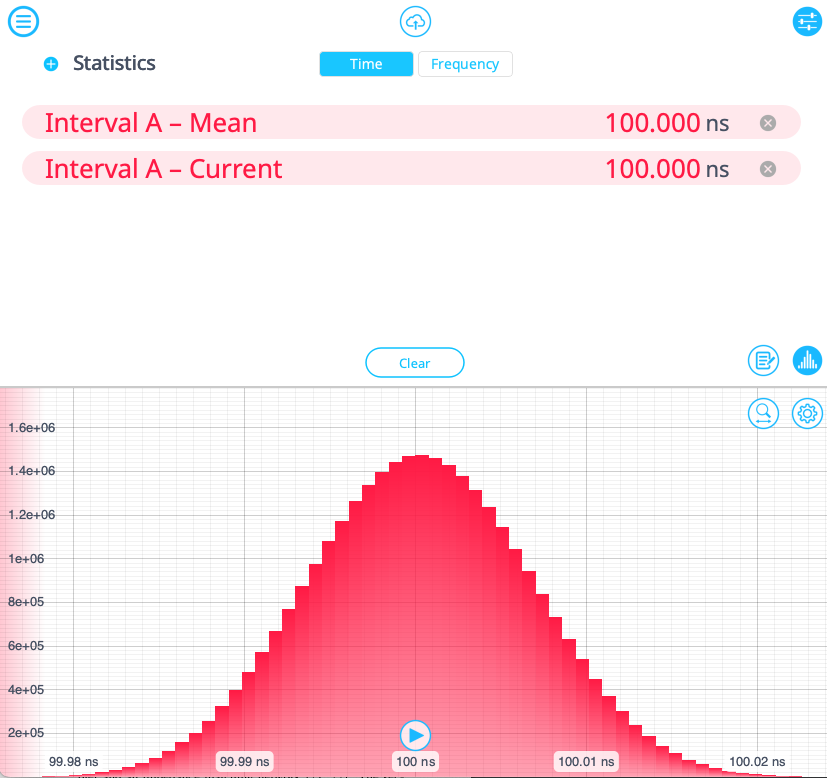
The Moku Time & Frequency analyzer has a digital resolution of 780 fs when deployed on Moku:Pro. This number represents the minimum detectable time difference between two events, or the minimum bin width when using the histogram function. The RMS jitter of the Time & Frequency Analyzer is <20 ps, and this number is sometimes referred to as the single-shot resolution. Jitter leads to fluctuations in time when measured from shot to shot and results in the broadening of the histogram as seen in Figure 1, whereas the width of the bins themselves corresponds to the digital resolution. Averaging repeated measurements can help compensate for random jitter.
How can the minimum time interval be shorter than the sampling rate?
Moku:Pro has a maximum input sampling rate of 5 GS/s, which corresponds to a period of 200 ps. While counting these clock cycles is certainly a useful method for measuring longer time intervals, this only provides a coarse time measurement, and will always round events off to the next cycle. In order to achieve a fine resolution and measure events that occur in between clock cycles, a hybrid method must be used. Continue reading further for more specifics on this measurement technique.
What is the principle of time measurement? Is it a delay chain/delay line chip? How is the internal minimum delay line calibrated?
In other time-to-digital converters (TDCs), fine time measurement is performed through use of an interpolator, which can measure periods of time that are smaller than the clock period. This is accomplished with a tapped delay line, which uses a series of fixed delays and latches to calculate the time difference between the start and stop signal. Note that tapped delay lines, however, are not suited for measurement of long time periods and are combined (hybridized) with the coarse measurement data to return the full time interval information. Moku hardware is entirely based on a reconfigurable FPGA and does not have a physical delay line or specialized chip. Thus, there is no need for delay line calibration. The time-to-digital converter (TDC) is implemented entirely via the FPGA, with the interpolation and hybridization performed by digital signal processing algorithms. The efficiency and speed of the FPGA hardware allows the Moku Time & Frequency Analyzer to distinguish between events with a time resolution of down to 780 fs.
Can the Time & Frequency Analyzer perform real-time processing? What is the internal delay?
Yes. Another advantage of the FPGA platform is its high data throughput, and the Moku Time & Frequency Analyzer takes advantage of this feature with gapless, zero-dead-time event detection and real-time generation of statistics and histograms. Instantaneous measurements of interval counts or lengths can be used to provide feedback via the instrument’s analog output feature. The input to output delay of the Time & Frequency Analyzer is below 500 ns.
Does the software support photon coincidence counting?
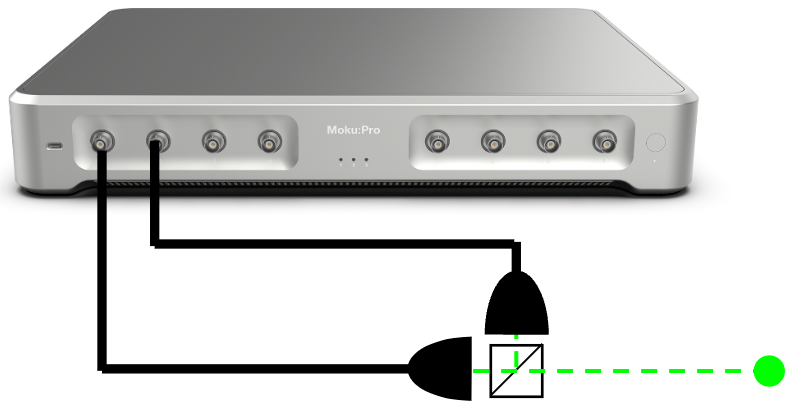
Yes. Photon counting is a feature that was commonly requested by our users, so the Time & Frequency Analyzer was designed from the beginning with this function in mind. With zero-dead-time event detection and live histogram and statistical information, the Moku provides an efficient platform for photon counting experiments. One common photon counting method is the Hanbury Brown-Twiss experiment, which one can easily set up using Moku:Pro, as seen in Figure 2 below. A pair of photodiodes are connected to Inputs 1 and 2 on the Moku, which receive photons produced by a light source. The Moku Time & Frequency Analyzer collects information on the time intervals between a photon event on Detector A and one on Detector B, producing a histogram of the results that informs the nature of the light source. See this application note on Hanbury Brown-Twiss experiments for more information. Specifically, the key figure of merit in these measurements is the number of coincidences, or how many times the photodiodes record an event simultaneously. On the histogram, this would correspond to the time bin t = τ, where τ is the relative delay between the signal paths of the photodiodes. To recover exact values from the histograms generated by the Time & Frequency Analyzer, first collect the data in real-time, or use the embedded Data Logger instrument. Histogram times and counts can then be transferred to your PC via the cloud button (read below for more details), or through the Python API.
Can it be used for distance measurement and other LiDAR applications?
Yes. In applications such as radar and LiDAR, distances to objects are typically determined by time-of-flight measurements, which is the amount of time it takes for a signal to travel to the object then reflect and return back to the detector. It is important to have a small time resolution in these measurements, as this limits the precision of distances that can be measured. The Moku Time & Frequency Analyzer has a low digital resolution of 780 fs, with a single-shot resolution of <20 ps, making it an efficient choice for optical communications needs.
Do I have to use an SD card to collect data, or can I directly use the button on the software interface to log data?
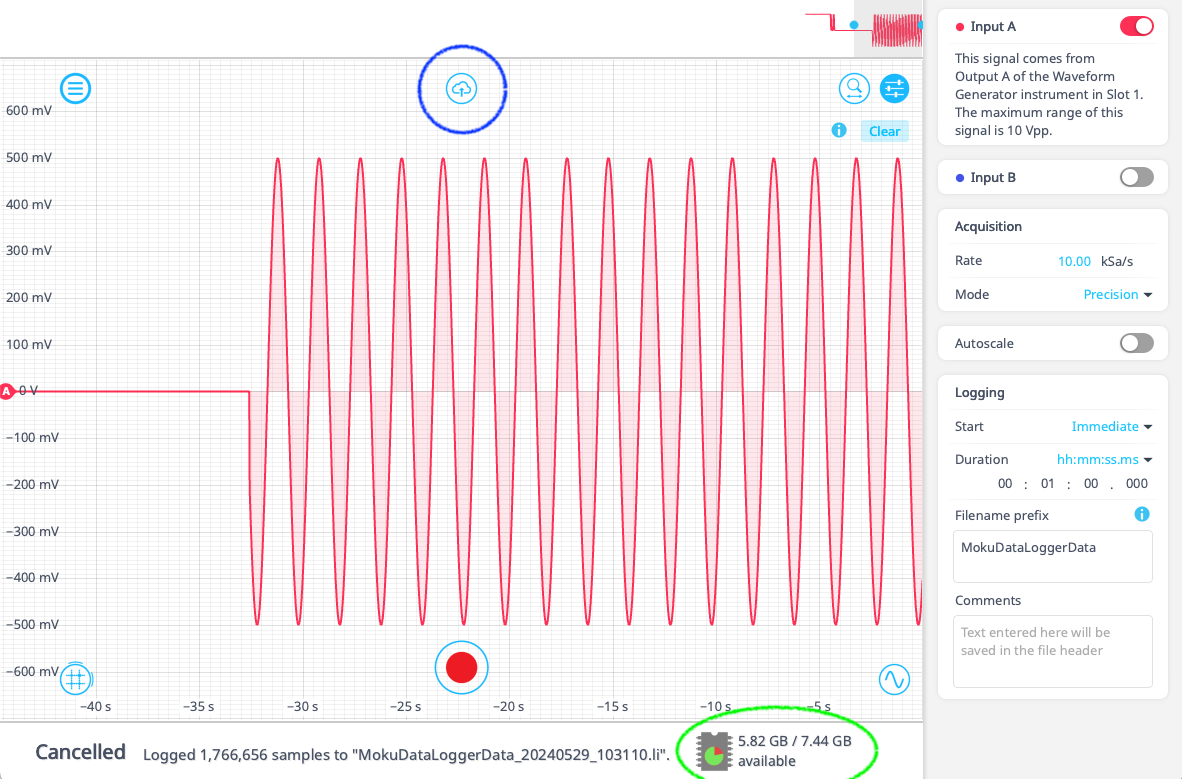
Although SD cards are certainly an option for Moku:Pro, they are not required for data collection. All Moku devices have the ability to log data directly to its internal memory, which can be transferred via Wi-Fi, USB or Ethernet to a measurement PC. You can see the amount of available memory on your device by using the Moku Data Logger instrument (or any embedded version). Manage or transfer your files by clicking on the cloud icon; see Figure 3 for details.
Thank you for viewing our webinar. We look forward to seeing you again!For more insightful demonstrations, check out our webinar library for on-demand viewing.
More questions?
Get answers to FAQs in our Knowledge Base
If you have a question about a device feature or instrument function, check out our extensive Knowledge Base to find the answers you’re looking for. You can also quickly see popular articles and refine your search by product or topic.
Join our User Forum to stay connected
Want to request a new feature? Have a support tip to share? From use case examples to new feature announcements and more, the User Forum is your one-stop shop for product updates, as well as connection to Liquid Instruments and our global user community.