As our world becomes more connected by global communications networks, the need for secure, robust, and high-bandwidth techniques for transmitting data has grown rapidly. While this has been traditionally accomplished with RF frequency modulation, as well as optical transmission via fiber, the field of free-space optical (FSO) communications has developed as a strong alternative. Read on to learn more about FSO measurement techniques, as well as the benefits and challenges of using this method of data transmission.
Why use FSO over other techniques?
FSO communication can be an alternative to both RF and optical fiber transmission. Compared to RF modulation, which is usually performed with a base frequency in the range of a few gigahertz (wavelength 6 cm), FSO carriers are typically in the near-IR to IR regime, or a wavelength between 780 and 1600 nm. This significantly larger frequency allows for a much wider bandwidth, increasing the data transmission rate. These frequencies also avoid the “spectrum crunch” associated with the licensed frequency bands used by many RF and wireless devices.
While fiber-based transmission also has these same advantages, it is complemented by FSO techniques in a number of ways. Although fiber transmission can be incredibly efficient in dense, urban environments, the cost of fiber installation can skyrocket when the distance between nodes becomes farther apart. For this reason, FSO could take the place of optical fibers when communicating with hard-to-reach or remote areas on Earth. Moreover, FSO is crucial for applications such as satellite and deep-space communications, where use of optical fibers is not possible.
Lastly, because FSO data is transmitted point-to-point, it can be performed with relatively low-power transmitters and receivers, saving costs on equipment. This also makes the signal harder to directly intercept, making the communication more secure.
How are FSO communications performed?
While the implementation of FSO schemes can quickly grow in complication, the basic procedure can be broken down into four steps.
- Generation of the carrier wave: A near-IR or IR laser produces the carrier wave at a given frequency. The carrier wave can be continuous-wave (cw) or pulsed, and there are ways to encode data using both methods. The carrier must be carefully aligned so that the output points directly toward the intended receiver circuit.
- Modulation of the carrier: Data can be encoded using a variety of techniques based on the nature of the carrier wave. For a cw carrier, digital data is represented by changes in the amplitude, frequency, or phase of the wave. An example of amplitude-shift keying (ASK) is shown in Figure 1a. Digital bits of 0 or 1 are represented by voltage pulses, which then are mixed with the carrier, resulting in a wave that has abrupt changes in amplitude. These changes in amplitude can then be recovered by demodulation. A specific case of ASK where the amplitude of the resulting value is either zero or nonzero is known as on-off keying (OOK). The OOK method is a highly efficient way to transmit data. For pulsed carriers, the data can be encoded via changes in the width, amplitude, or position of the pulses. An example of this is pulse-position modulation, shown in Figure 1b. Clock pulses are produced at regular intervals, and the time between these pulses is subdivided into a number of intervals (2, 4, 16, etc.). The position of the data pulse relative to the clock pulse determines the value of that bit. This technique, referred to as M-PPM, where M is the number of time subdivisions, is also an extremely robust and popular way to encode data in communications.
- Detection of the signal: There are two common ways for the receiver to decode the signal, depending on the nature of the carrier. The first is coherent detection, which uses an interferometer and lock-in amplifier to demodulate the signal. Using a local oscillator as a reference, the changes in the phase and amplitude can be extracted. The second method is direct, or non-coherent, detection, which directly measures the frequency, timing, and intensity of the laser pulses using a photodiode. A time interval analyzer can be used to measure the differential time between pulses, or the arrival time of the pulse relative to a common clock signal. This time value can then be converted into an analog amplitude.
- Analysis of the data: Next, the analog data is passed to a comparator, which recovers the digital data from the amplitude of the demodulated data. For example, if the signal exceeds a certain threshold, it is digitized as a 1, and if it falls below the threshold, it is a 0. After this procedure, the data has been transmitted to the new location once and digitized once again, allowing it to perform whatever purpose it was intended for.
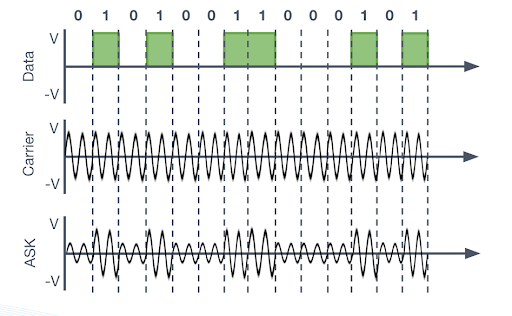
Figure 1a: Amplitude-shift keying sequence, showing the initial digital data and carrier wave. When mixed, the carrier wave will undergo abrupt changes in amplitude.
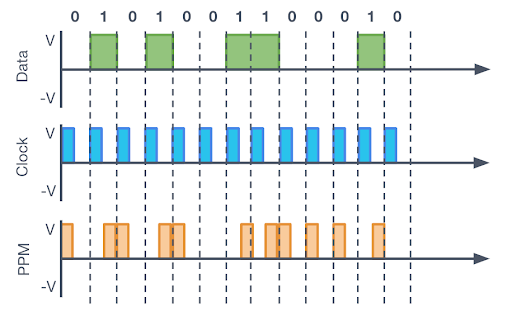
Figure 1b: PPM sequence with the same initial data set. The carrier wave is pulsed, so the data is encoded in the pulse edge relative to the carrier wave.
What are the challenges of FSO communications?
Despite certain advantages when compared to RF and optical fiber transmission techniques, FSO communication also has its own distinct challenges that must be overcome. Some of these challenges include absorption and scattering of the transmission beam by the atmosphere — including fog, rain, and snow — which leads to heavy attenuation of signals. This makes FSO communication in inclement weather especially tricky. However, even during favorable weather conditions, the receivers can be subjected to background noise from the sun, and natural changes in temperature or pressure (also known as atmospheric turbulence) can cause small alignment changes in the laser beam. The reliance of FSO communications on direct line-of-sight contact between the transmitter and receiver can make this approach problematic, as any beam divergence or misalignment will cause a sharp drop in the received signal.
Fortunately, some of these issues can be mitigated through hardware. Carrier stabilization can be performed through the use of active optics, or closed-control loops that can adjust and realign the laser beam in real time. Simple, power-efficient modulation schemes such as OOK and M-PPM can help make the system robust against interference and attenuation from the environment. Finally, ultra-sensitive detectors, such as low-noise lock-in amplifiers, can help pick out the carrier signal from the background noise present in the system. Further improvements can be made by adding redundancy and implementing RF/FSO hybrid systems, although these are outside the scope of this blog.
The advantages of FPGA-based instrumentation for FSO communication
Built on a reconfigurable FPGA chassis, the Moku platform from Liquid Instruments provides a full suite of software-defined instruments for test and measurement. Originally built for precise detection of gravitational waves, Moku offers several specialized instruments to detect optical signals, either by coherent or non-coherent methods.
The versatility of the Moku platform makes it ideal for implementing FSO procedures. For example, the Moku Lock-in Amplifier can measure cw signals with ultra-low dynamic reserve, and with Multi-Instrument Mode, Moku can simultaneously deploy up to four Lock-in Amplifiers side-by-side for high-efficiency multi-frequency analysis. If you are using direct detection methods, the Moku Time & Frequency Analyzer features a digital bin resolution of 780 fs, real-time histogram generation, and the ability to output an analog signal proportional to a measured time interval, making it a great choice for M-PPM data, as shown in Figure 2.
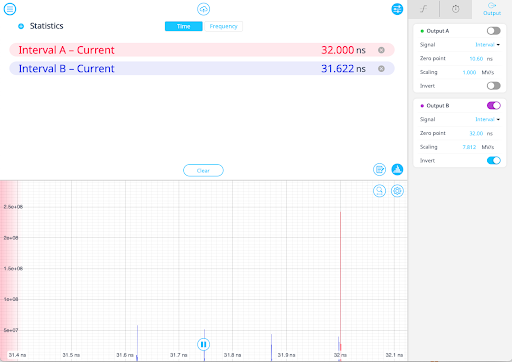
Figure 2: A histogram of the 4-PPM data as monitored by the Moku Time & Frequency Analyzer. Interval A, the clock rate, is shown as a tall peak in red at 32 ns. Four blue peaks are also shown, corresponding to the four possible pulse positions within the clock cycle.
On the signal production side, the Moku Waveform Generator easily implements amplitude and phase modulation on an input signal, allowing you to encode data on your carrier signal via an acousto-optic or electro-optic modulator (AOM/EOM). The carrier itself can be stabilized through a closed feedback loop provided by the Moku Laser Lock Box, which replaces a traditional laser-locking system with an all-in-one locking mechanism. All of these tools can be run simultaneously through Moku Multi-Instrument Mode, enabling flexible and rapid prototyping.
To learn expert tips on how to leverage the Moku platform for fast and efficient development of FSO technology, check out our webinar recording on the topic. You’ll learn how to use the Moku Lock-in Amplifier and Time & Frequency Analyzer for both coherent and direct detection of optical signals. You’ll also see how to deploy these instruments simultaneously in Multi-Instrument Mode for maximum versatility, plus digital and analog modulation methods such as phase-shift keying (PSK) and pulse-position modulation (PPM) covered in a live demo.
Questions?
Get answers to FAQs in our Knowledge Base
If you have a question about a device feature or instrument function, check out our extensive Knowledge Base to find the answers you’re looking for. You can also quickly see popular articles and refine your search by product or topic.
Join our User Forum to stay connected
Want to request a new feature? Have a support tip to share? From use case examples to new feature announcements and more, the User Forum is your one-stop shop for product updates, as well as connection to Liquid Instruments and our global user community.