






This recap and Q+A complement our webinar, entitled Free-space optical communications with FPGA-based instrumentation, which we co-hosted with Physics World on October 2, 2024. If you weren’t able to attend live, you can register now for on-demand access. In addition to a webinar summary, we’re providing in-depth answers to select audience questions below.
Webinar recap
During this presentation, we gave an overview of free-space optical (FSO) communications, including advantages, challenges, and critical measurement techniques. We introduced the FPGA-based Moku platform and its reconfigurable suite of test and measurement instruments, including the Moku Waveform Generator, Lock-in Amplifier, and Time & Frequency Analyzer, which provide a streamlined approach to optical communications development. In a live demonstration, we deployed these instruments simultaneously using Multi-Instrument Mode. We then generated a sequence of digital data and encoded it onto a carrier wave in two different ways: through amplitude-shift keying (ASK) and pulse-position modulation (PPM). Finally, we detected and decoded the waveforms with the Moku Lock-in Amplifier and Time & Frequency Analyzer.
Audience questions
How do you program different voltage levels using the Moku Logic Analyzer / Pattern Generator?
In the webinar demo, we generated a pattern of four discrete voltage levels that repeated indefinitely, which we then encoded onto a carrier wave. It is important to note that the Moku Logic Analyzer / Pattern Generator instrument can function very differently depending on whether you are working with the individual instrument or using it in Multi-Instrument Mode, and also the hardware you are using. When used by itself on a Moku:Pro device, Logic Analyzer instrument utilizes the four physical input ports, plus the external trigger port, and is only capable of decoding 5-bit numbers. But when used in Multi-Instrument Mode, the Logic Analyzer can both send and receive 16-bit signed integers from other Moku instruments. To access the Pattern Generator feature, click on the pulse symbol in the bottom right corner of the Moku Logic Analyzer, as shown in Figure 1. From here, you can change the values of the bits to program your sequence. Bits 0 through 14 control the magnitude of the output voltage (with bit 0 having the smallest effect and 14 having the largest), while bit 15 controls the sign — allowing for output voltages scaled from -5 to +5 V. For more information, check out this video explaining how to use the Pattern Generator to make sequences on Moku:Pro.
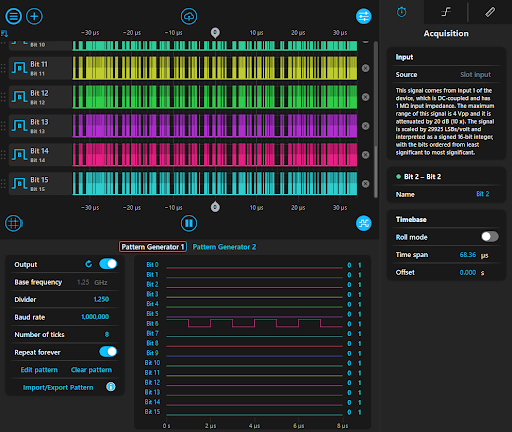
Figure 1: To access the Pattern Generator feature, click on the pulse symbol in the bottom right corner of the Moku Logic Analyzer instrument.
Is the Phasemeter instrument just a Lock-in Amplifier with a PLL on the input?
The Moku Phasemeter and Lock-in Amplifier are similar in that they can both perform dual-phase demodulation on incoming signals to determine the phase and amplitude information. There are, however, several key differences. The Phasemeter does indeed rely on a phase-locked loop (PLL) to detect and lock on to the incoming signal. Instead of a fixed-frequency oscillator, the LO signal is provided by a numerically controlled oscillator (NCO). When a phase deviation between the input and LO signal is detected, the NCO will adjust its frequency to match the input, creating a closed feedback loop that can measure amplitude, frequency, and phase accumulation with microradian precision. Furthermore, because the phase difference is measured via an integrator, the Phasemeter can measure full, unwrapped phase information — useful if you anticipate large phase shifts in your experiment. The Phasemeter does, however, have a lower range of frequency operation than the Lock-in Amplifier (300 MHz vs. 600 MHz, respectively), and requires a strong periodic signal to lock on to. A PLL can also easily be implemented with the Lock-in Amplifier, using the Moku Waveform Generator as the NCO. If you require high bandwidth or have a weak or intermittent signal, the Lock-in Amplifier is often the superior choice.
Can Moku be used for related techniques such as quantum key distribution?
Quantum key distribution is a technique in the field of quantum cryptography that relies on the generation and detection of entangled photon pairs to increase the security of data transmission. While the generation of such entangled pairs typically relies on powerful lasers and nonlinear crystals, the Moku PID Controller and Laser Lock Box can be used for stabilizing the laser in such setups. To see how the PID Controller is deployed in a real setup, check out this case study. The Moku Time & Frequency Analyzer also makes an excellent coincidence detector for entangled photon pairs. In a typical Hanbury-Brown-Twiss setup, the Time & Frequency Analyzer detects photon arrival events produced by a pair of photodiodes. With zero dead-time between intervals, a digital bin resolution of 0.78 ps, and the ability to timetag events at a speed of up to 10M events/s, use the Time & Frequency Analyzer to accurately measure coincidence rates and correlation functions.
Can the Moku Oscilloscope show constellation diagrams?
In techniques such as quadrature amplitude modulation, information is encoded in two carrier waves that are 90° out of phase with one another. After demodulating and recovering these baseband signals, the results are typically analyzed using a constellation diagram, which shows the relative I and Q quadrature plots. These values typically fall within tight clusters (hence the “constellations”), and the performance of the system can be evaluated by the resolution of the clusters relative to each other. The Moku Oscilloscope features an X-Y mode to show both baseband signals plotted against each other. To access this, enable the Math channel on the right-hand panel. Change the symbol to “XY,” as shown in Figure 2. While the Oscilloscope currently doesn’t offer specialized tools for analyzing constellation diagrams, such as EVM, it does provide quick feedback. Plus, it’s easy to export Oscilloscope traces to your host PC via the cloud share button at the top of the interface.
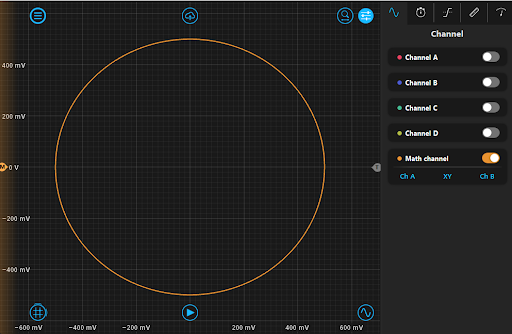
Figure 2: Use the X-Y function on the Math channel in the Moku Oscilloscope to view two traces plotted against each other.
How is the sub-picosecond timing accuracy achieved on the Moku Time & Frequency Analyzer?
Moku:Pro has a maximum input sampling rate of 5 GS/s, which corresponds to a clock period of 200 ps. This means that simply counting clock cycles does not provide enough resolution. To measure events that occur in between clock cycles with fine resolution, you must use a hybrid method. In time-to-digital converters (TDCs), fine time measurement is accomplished by interpolation via a tapped delay line, which uses a series of fixed delays and latches to calculate the time difference between the start and stop signal. It’s important to know, however, that tapped delay lines are not suited for measurement of long time periods. They are combined (or hybridized) with the coarse measurement data to return the complete time interval information. Moku devices are entirely based on reconfigurable FPGAs. They do not have physical delay lines or specialized chips. The time-to-digital converter (TDC) is implemented entirely via the FPGA, with the interpolation and hybridization performed by digital signal processing algorithms. The efficiency and speed of the FPGA-based hardware allows the Moku Time & Frequency Analyzer to distinguish between events with a minimum time resolution of 780 fs. Thank you for viewing our webinar. We look forward to seeing you again.For more insightful demonstrations, check out our webinar library for on-demand viewing.
More questions?
Get answers to FAQs in our Knowledge Base
If you have a question about a device feature or instrument function, check out our extensive Knowledge Base to find the answers you’re looking for. You can also quickly see popular articles and refine your search by product or topic.
Join our User Forum to stay connected
Want to request a new feature? Have a support tip to share? From use case examples to new feature announcements and more, the User Forum is your one-stop shop for product updates, as well as connection to Liquid Instruments and our global user community.