






What is frequency response analysis?
Engineers use a frequency response analyzer, sometimes called a Bode analyzer, to drive a device under test (DUT) with a swept sine wave and record the amplitude and phase responses. By comparing the output voltage to the input voltage, you can measure the transfer function of electrical, mechanical, and optical systems.With the graphs of the system’s magnitude and phase response as a function of frequency, commonly referred to as a Bode plot, engineers can optimize the closed-loop response of control systems, characterize resonant behavior in nonlinear systems, design filters, and measure the bandwidth of different electronic or optical components.
What types of systems do engineers use frequency response analysis to study?
Scientists and engineers visualize the amplitude and phase responses for filters, amplifiers, matching networks, and more. This is a key step in designing integrated circuits to observe and plot the transfer function of the system. In addition to the transfer function, scientists can determine gain, attenuation, resonance, bandwidth, and phase lag across different frequencies. [1]
Understanding frequency response analysis plots
By using a swept sine signal, we can observe how the DUT responds to a wide variety of input frequencies. In the Bode plot seen in Figure 1, the top half shows us gain (db) vs. frequency (Hz), while the bottom half shows us phase (°) vs. frequency (Hz). To observe a wide range of frequencies, frequency is plotted on a logarithmic scale.
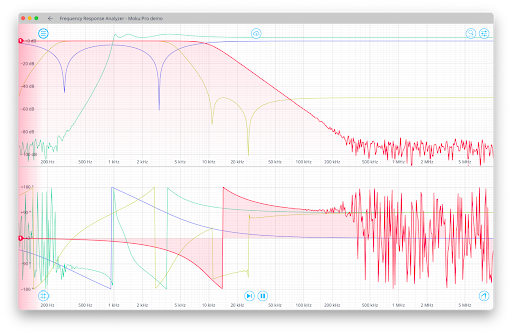
Figure 1: The Moku:Pro Frequency Response Analyzer display with amplitude vs. frequency on the top and phase vs. frequency on the bottom, sweeping from 100 Hz to 10 MHz.
How to use a frequency response analyzer
Using frequency response analysis to find DUT bandwidth of amplifiers and filters
A frequency response analyzer is often used to identify the bandwidth of amplifiers or filters. In filters, the -3 dB point provides information on the Q factor and how well the filter attenuates signals out of a desired frequency range. In amplifiers, the -3 dB point allows engineers to specify the operational range of the device and observe roll-off characteristics. [2]Here’s how to read a frequency response analyzer plot step-by-step to find the -3 dB point:
- Inspect the magnitude plot to identify the -3 dB point. This is also known as the half-power point of the DUT, meaning the output power has dropped to half of the peak value. This corresponds to the cutoff frequency of your DUT.
- Use cursors to find the maximum amplitude value. With another cursor, find where the magnitude has been reduced by 3 dB.
- Read the corresponding frequency to this -3 dB point to identify the bandwidth (Figure 2).
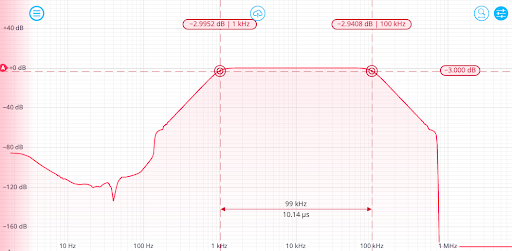
Figure 2: A 1 kHz to 100 kHz bandpass filter, identified through frequency response analysis.
Using frequency response analysis to determine resonant frequencies
When using a frequency response analyzer to identify resonant frequencies in optical devices, researchers look for peaks in the magnitude plot when measuring signal transmission, and dips when measuring reflection. These peaks or troughs correspond to frequencies where the optical system exhibits a heightened response to the applied input signal. Once they identify the resonant frequencies, researchers can work to minimize the impact of the resonances, sometimes with control systems using a PID controller.
Important frequency response analyzer settings to consider
When choosing a frequency response analyzer, pay attention to settings and specifications including the frequency range, number of data points, and advanced settings to minimize effects of noise or saturation. Increasing the number of points in the sweep increases the frequency resolution of the measurement, allowing you to capture narrower features over a wider frequency range. Settling time determines how long your instrument waits before performing measurements at each frequency in the sweep. This setting is particularly important when characterizing resonant systems with high Q-factors, allowing excitations to settle between measurements. In non-resonant systems, settling time can be used to account for transmission delays in cables.Some instruments, like the Moku Frequency Response Analyzer, contain advanced settings to further optimize measurement efficiency. The Dynamic Amplitude setting maximizes the dynamic range by automatically reducing the output signal amplitude when saturation is detected on the corresponding input. Some frequency response analyzers place an amplitude-limiting envelope around the data, but this limits the dynamic range of your measurement. By dynamically adjusting each point in the sweep, you can prevent saturation while maintaining high dynamic range.
Conclusion
There are many more ways to perform frequency response analysis in electronics testing, optics and photonics research, and more. Using frequency response analysis, scientists and engineers can make measurements from impedance and S-parameters to laser locking while characterizing closed-loop gain, phase margin, and loop disturbance rejection performance. Considering the performance of your individual device can help ensure the highest-quality results.[1] “Bandpass Filter Bode Plot and Analysis,” resources.pcb.cadence.com. https://resources.pcb.cadence.com/blog/2020-bandpass-filter-bode-plot-and-analysis [2] “Quality Factor and Bandwidth – Filters – Basics Electronics,” ecstudiosystems.com. https://ecstudiosystems.com/discover/textbooks/basic-electronics/filters/quality-factor-and-bandwidth/
More questions?
Get answers to FAQs in our Knowledge Base
If you have a question about a device feature or instrument function, check out our extensive Knowledge Base to find the answers you’re looking for. You can also quickly see popular articles and refine your search by product or topic.
Join our User Forum to stay connected
Want to request a new feature? Have a support tip to share? From use case examples to new feature announcements and more, the User Forum is your one-stop shop for product updates, as well as connection to Liquid Instruments and our global user community.