






In this blog, we will demonstrate how to set up and measure a transfer function for the Moku PID Controller using the Moku Python API. First, we will introduce the standalone PID Controller instrument and walk through the necessary Python commands to configure it, then we will measure the transfer function using the Moku Frequency Response Analyzer.
Understanding the PID Controller Block Diagram
In electronics applications, PID and control loops are often essential pieces of an automated test setup. For clarity, it is useful to examine the PID controller block diagram using the Moku UI, as seen in Fig. 1. The instrument’s block diagram shows two inputs fed into a control matrix, which allows signals to be added, subtracted, and multiplied. The signal then passes into one of two independent PID controllers, each with its own output, along with DC offsets, limiters, and switches. Additionally, probe points are available for viewing signals at various stages within the measurement chain.
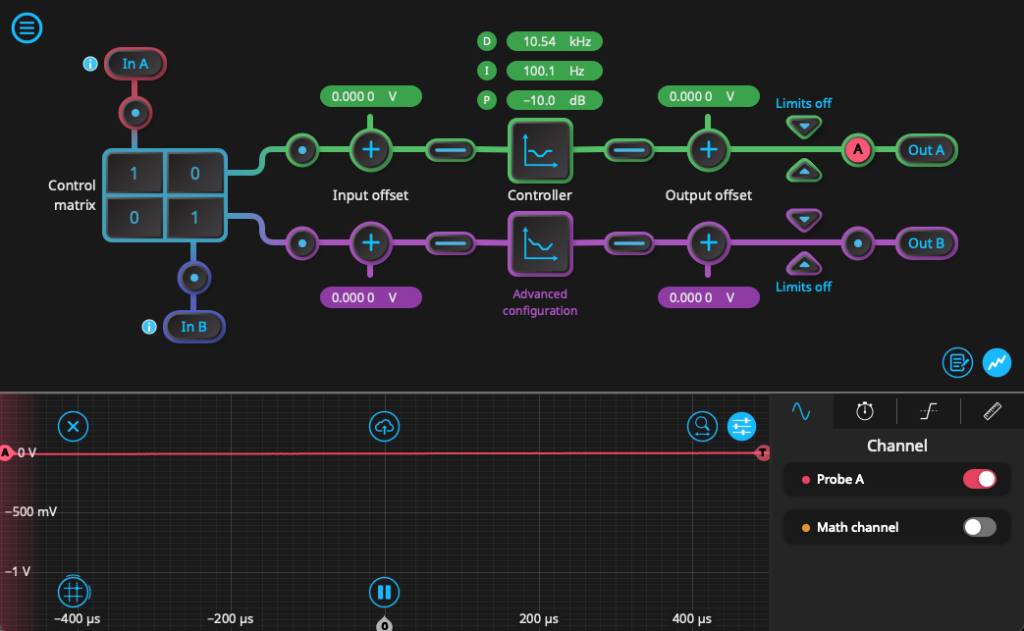
Figure 1. The Moku PID Controller block diagram. By selecting the PID block in the Moku UI, users can view the current transfer function in frequency space. The proportional gain and saturation levels are defined in units of dB, while crossover points are specified in Hz. Users can interact with these parameters by clicking and dragging, adjusting the values dynamically and seeing the transfer function update.
Defining the Transfer Function in Python
To automate the configuration and measurement of the transfer function, we use a Jupyter notebook, which is accessible from our Github. For those new to Python-based Moku control, detailed written and video tutorials on setting up the Python API are available in this blog. The processes for connecting to Moku and setting up Multi-Instrument Mode are covered in these tutorials, while here we only cover the essential commands for defining the PID function. There are three key commands to use when setting the transfer function, with the key difference being the user’s preference for defining the PID parameters either by gain or by crossover frequency. We’ve created two commands to accommodate either of these configurations. The first is the command set_by_frequency. This command defines the total gain, integrator saturation, and differential saturation parameters in dB, whereas the integrator, differentiator, and double integrator parameters are defined in terms of crossover frequency. As seen in the code snippet below, the command accepts up to seven keyword inputs, the first of which specifies the target channel. Users can add the other six keyword arguments to configure parameters accordingly. There are no default values; leaving a keyword undefined disables that parameter. An alternative command, which allows users to set PID parameters using gain values, is set_by_gain. When using this method, the proportional (P), integral (I), and derivative (D) values are specified in dB, while saturation values are expressed in Hz. These settings can also be accessed through the Moku UI; they are found under the “advanced mode” menu of the PID controller. The third command is summary, which retrieves a comprehensive list of instrument settings, including all current PID values. While this is universal to all Moku instruments, it’s particularly useful for the PID Controller, where the visual feedback from the UI is unavailable. An example of these three commands, with keyword arguments, can be seen in Fig. 2.
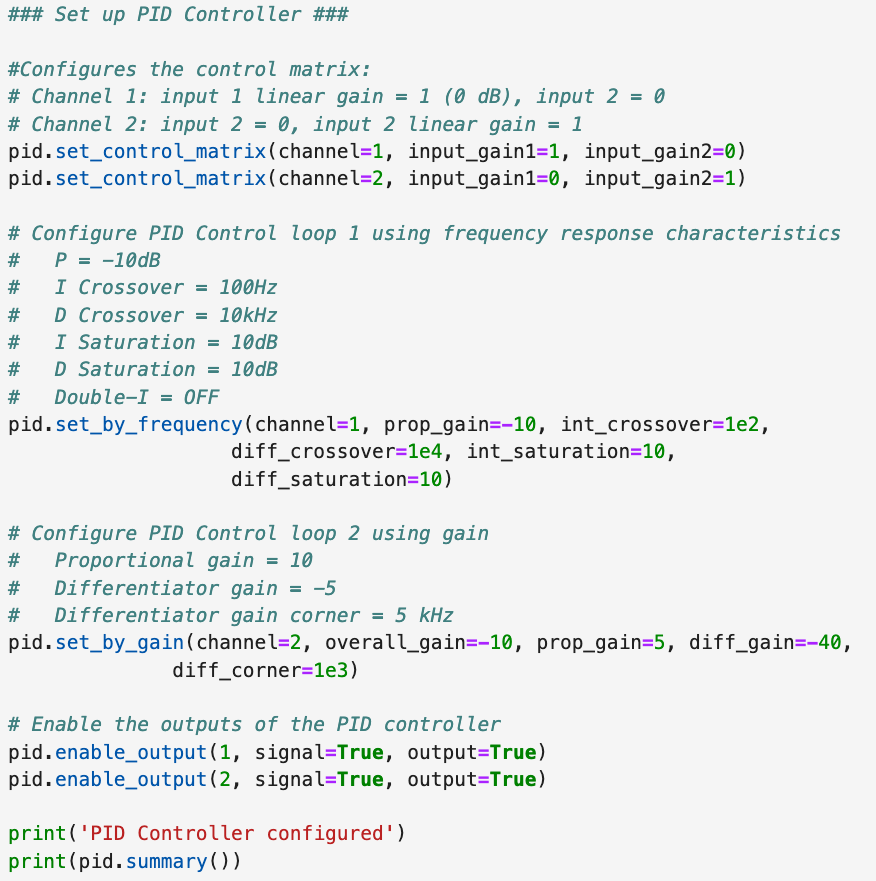
Figure 2. An example of Python code for the PID Controller, showing the multiple ways of configuring the transfer function.
Measuring the Transfer Function
We use the Moku Frequency Response Analyzer to measure the transfer function, deploying it alongside the PID controller in Multi-Instrument Mode. In this setup, the output from the Frequency Response Analyzer is fed into the PID controller. The signal then loops back to the input side, enabling the FRA to measure the difference between the input and output signals. A schematic of the Moku configuration is shown in Fig 3.
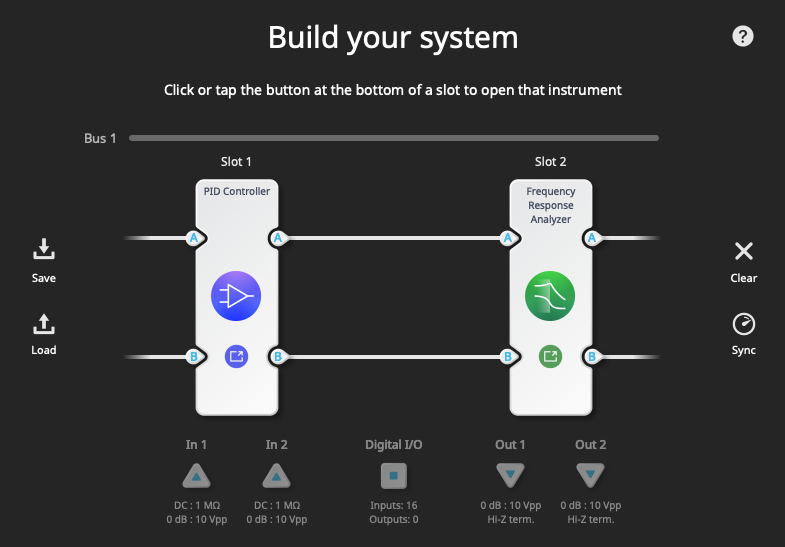
Figure 3. Moku PID Controller and Frequency Response Analyzer deployed in Multi-Instrument Mode. Continuing from the script introduced earlier, we focus on two essential Python commands. The first, set_output, defines the output parameters of the Frequency Response Analyzer. Since there are two outputs, the command is called twice — once for each channel. The first argument specifies the channel to be enabled, and the second argument sets the amplitude in volts. This command set_sweep configures the key parameters for the Frequency Response Analyzer’s sweep, and includes many keyword arguments. These keywords include the frequency range of the sweep, how many frequency points to measure, how long the instrument waits before starting data collection, and the duration over which data is averaged for each point. These minimum settling and averaging times can be defined in terms of number of cycles or length of time. For example, a settling time of 1 us and a settling cycle of 1 means that the instrument waits either 1 microsecond or 1 cycle at each sweep point, whichever is longer. The start_sweep command initiates the frequency sweep and provides an estimate of the measurement duration. The next command, get_data, retrieves the measured data. Setting the wait_complete keyword to True ensures the data transfer occurs only after the sweep finishes. If necessary, the timeout value can be adjusted to prevent the request from timing out. An example of the full set of commands, with keyword arguments, is shown in Fig. 4.
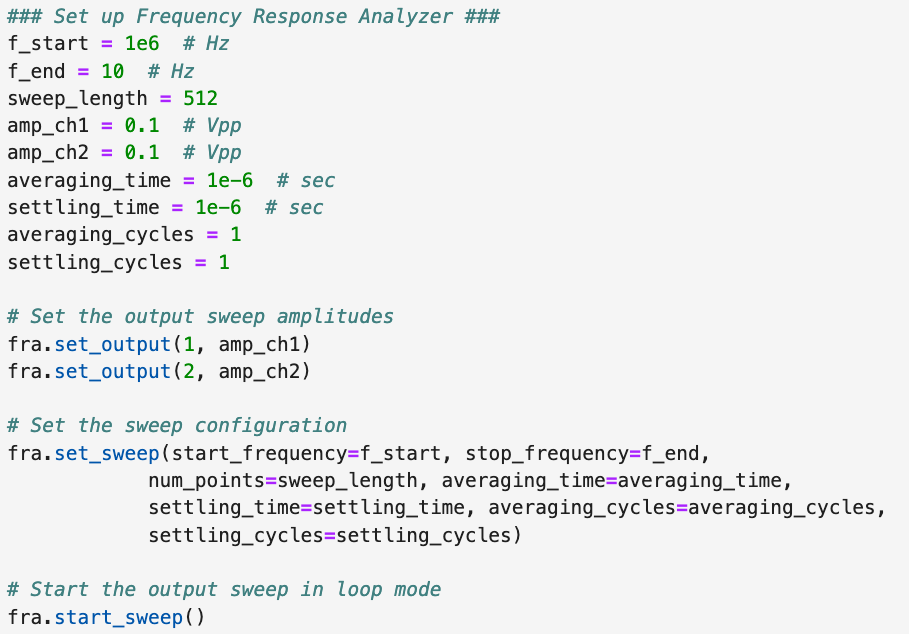
Figure 4. An example of Python code for the Frequency Response Analyzer.
Viewing and Plotting the Data
The data is returned in dictionary format with keys of ‘Ch1’ and ‘Ch2.’ It can be divided into two sets, which are also dictionaries, and plotted to display magnitude and phase versus frequency as shown in Fig 3. By comparing this plot with the transfer function shown in the PID controller UI, users can verify that the transfer function is providing the intended response to an input signal. Adjusting the PID controller settings will alter the transfer function, and produce corresponding changes in the plotted data.
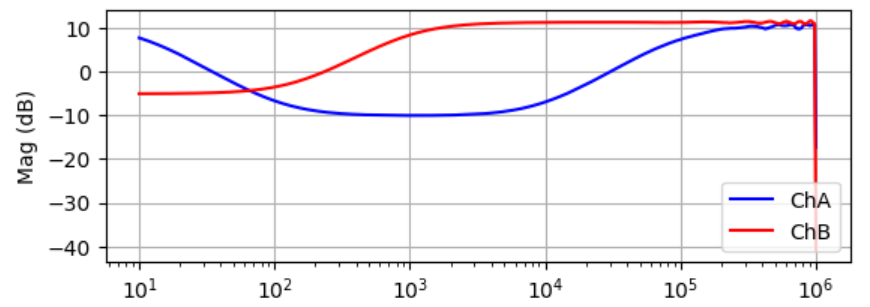
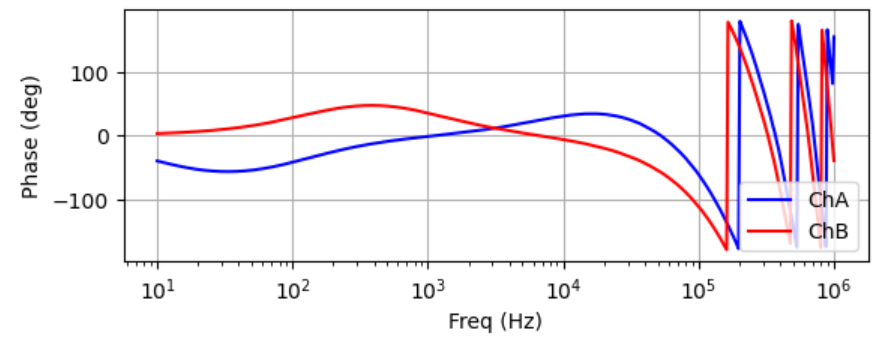
Figure 5. Magnitude and phase response data recovered from the Frequency Response Analyzer. This tutorial demonstrated how to define and measure a transfer function using the Moku PID controller and Frequency Response Analyzer through the Moku Python API. By following these steps and utilizing the provided commands, users can accurately configure their instruments and validate transfer functions.