




Please update your browser. For the best Liquid Instruments experience, update to the latest version of Chrome, Edge, Firefox, or Safari. Update Microsoft Edge.
Liquid Instruments Logo
Products
Hardware Platforms
Moku:Delta
Moku:Delta
New
For advanced design and validation
Moku:Pro
Moku:ProFor versatile test and measurement
Moku:Lab
Moku:LabFor experimental research labs
Moku:Go
Moku:GoFor quick testing and debugging
Compare Hardware
Compare HardwareView a side-by-side of all Moku hardware
Technologies
GenInst Studio
New
Generate personalized instruments
Integrated InstrumentsProfessional-grade instruments at your fingertips
Neural NetworkFPGA-powered neural network integration
Multi-Instrument ModeCombine instruments to create a customized test system
Moku CompileCode, compile, and deploy to your Moku's FPGA
Software
MokuOSDownload the Moku app for Windows, macOS, iPadOS & visionOS
APIsPython, MATLAB, LabVIEW
UtilitiesCommand line and graphical tools for file conversion
Instruments
Analysis
Oscilloscope
Spectrum Analyzer
Frequency Response Analyzer
Lock-in Amplifier
Phasemeter
Logic Analyzer / Pattern Generator
Time & Frequency Analyzer
Data Logger
Generation
Waveform Generator
Arbitrary Waveform Generator
Control & Conditioning
PID Controller
Digital Filter Box
FIR Filter Builder
Laser Lock Box
Custom & Utility
GenInst Studio
New
Gigabit Streamer
Custom Instrument
Neural Network
Multi-Instrument Mode
Applications
Optics and Photonics
Microscopy and Spectroscopy
Photon Counting
Quantum Optics
Aerospace and defense
A&D Instrumentation
Component Test
Automated Testing
Semiconductor Test
Control Systems and Bode Analysis
MEMS Testing
AI and Machine Learning
Generative Instrumentation
New
Neural Networks
Education
Education and Research
Resources
App Notes
Blog
Case Studies
Coursework
Guides
Product Documentation
Publications
Webinars
White Papers
Support
Company
Contact Us
About Us
Leadership
Partners
News & Updates
Press
Events Calendar
Careers
Store
Moku:Delta
Moku:Pro
Moku:Go
Upgrade Moku:Pro
Upgrade Moku:Lab
Upgrade Moku:Go
0
Get a quote Buy Now
Build personalized instruments with GenInst Studio in minutes, not months. | Register for the webinar
Blog

What is power spectral density (PSD), and why is it important?

Learn more about the applications, calculation methods, and practical uses of this critical measurement

July 11, 2024

    In this post, we explore the fundamentals of Power Spectral Density (PSD) and its importance in signal analysis. See how the Moku Phasemeter can simplify component test measurements and enhance your research.

    Phase measurement guide Explore the Moku Phasemeter

    Power spectral density (PSD) is a signal’s distribution of power at different frequencies. While a time-domain analysis watches how a signal changes over time, a frequency-domain analysis like PSD examines how much of the signal’s power is present at different frequencies. For example, Figure 1 shows that Input 1 of the Moku Phasemeter has measured a spike in PSD where the signal’s power is concentrated.

    When is power spectral density used?

    Power spectral density allows scientists and engineers to characterize broadband, random signals. This ability is useful in signal processing applications to analyze the frequency content of signals, which helps guide the design of relevant filters. In telecommunications, the PSD enables the analysis of bandwidth usage, noise characterization, and interfering signals. PSD is also useful in radar and sonar applications to track signals and targets of interest.

    What is amplitude spectral density?

    Amplitude spectral density is the measure of a signal’s amplitude at different frequencies; it’s also the square root of the power spectral density.

    How is power spectral density calculated?

    In the Moku Phasemeter, the power spectral density and amplitude spectral density are calculated using Welch’s method of overlapping periodograms, with a 50% overlap and a Hanning window. Depending on the sampling rate selected by the user, the number of points is either 512, 1024, or 2048.

    This method, shown in Figure 2, is a popular non-parametric way to calculate power spectral density, using fast Fourier transform (FFT) in the analysis. An FFT allows you to convert a signal from the time domain to the frequency domain. In summary, this method takes modified periodograms of each section and averages them.
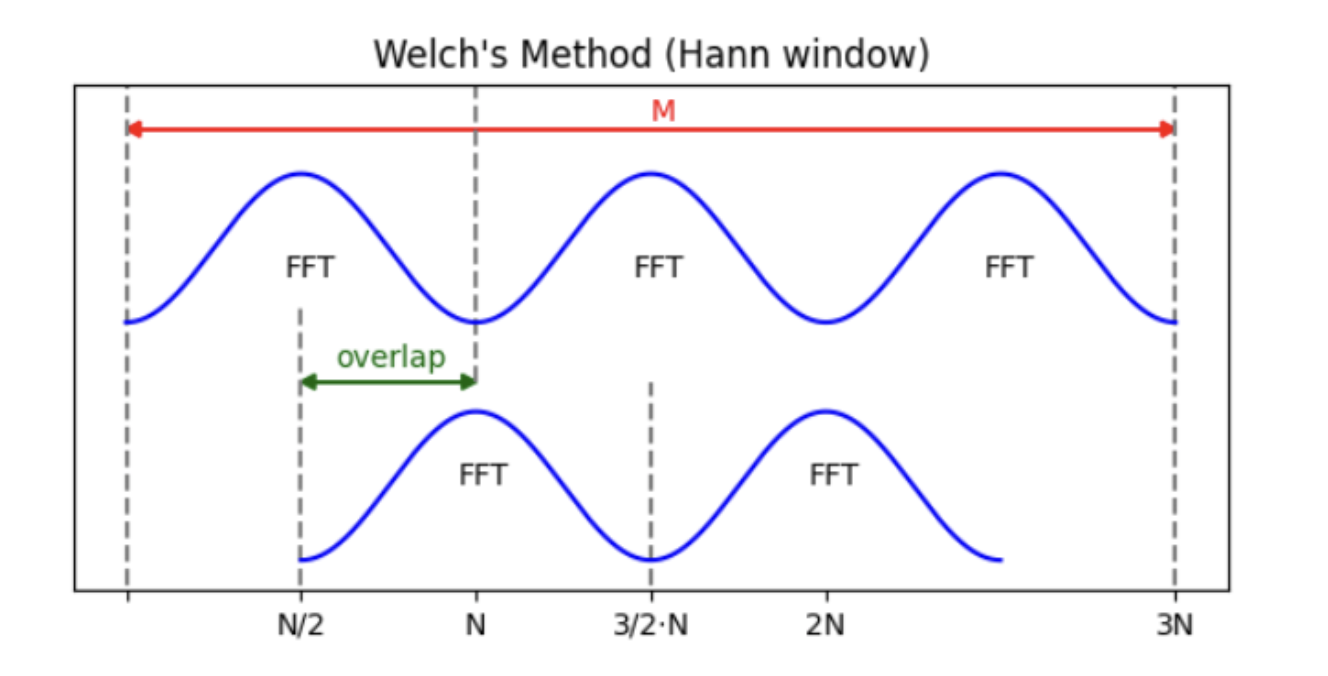
    Welch's method for Power Spectral Density calculations
    Figure 2: An example computation with a 50% overlap in windows, using Welch’s method.

    Power spectral density vs. Allan deviation

    Power spectral density is the frequency domain counterpart of Allan deviation, shown in Figure 3, which is a common statistical measure to analyze time series data for applications such as oscillator characterization and is the square root of Allan variance. Both values help to describe the stability of a system.
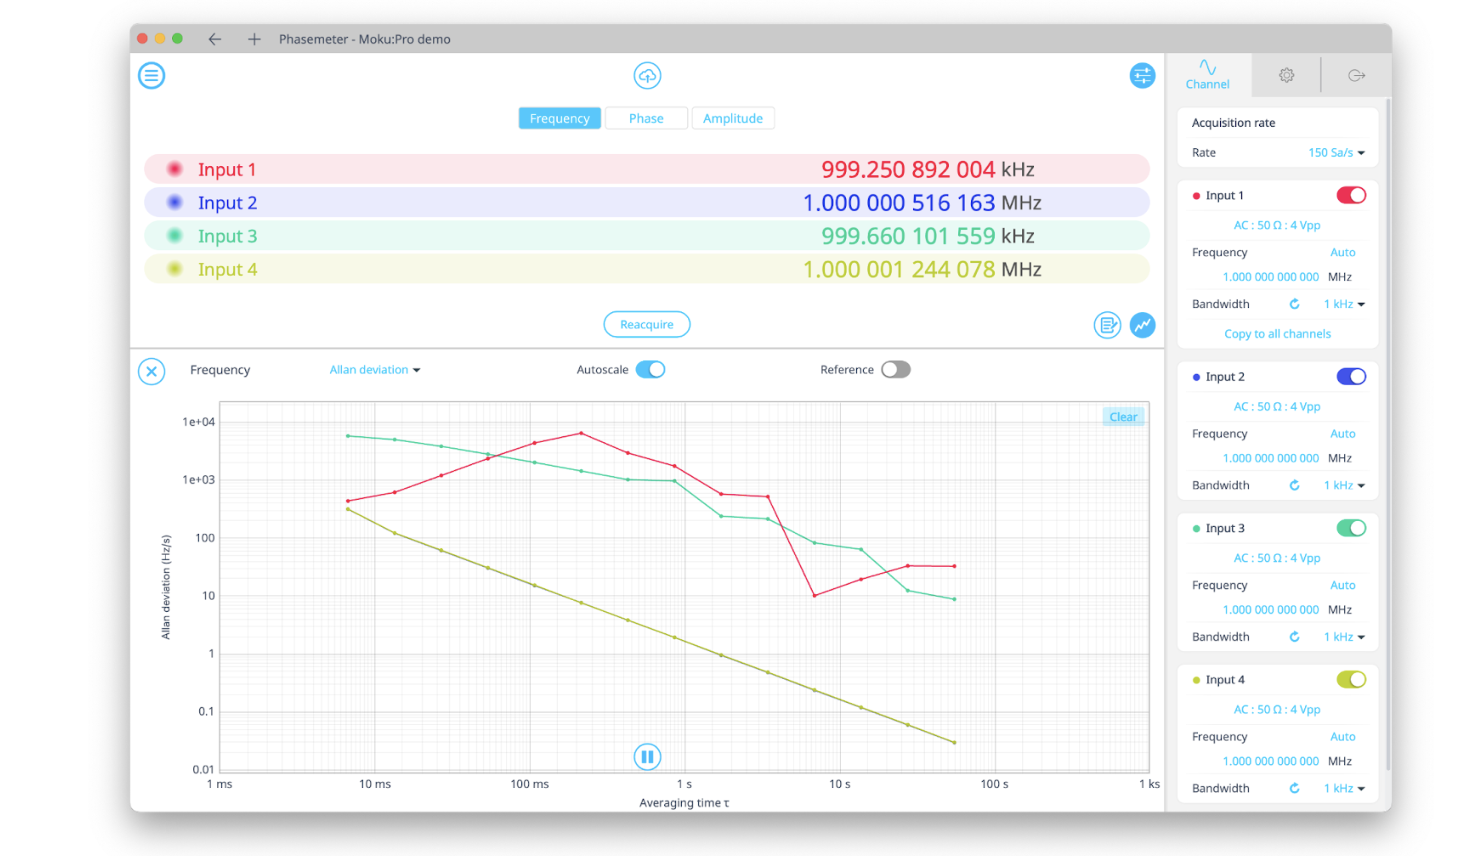
    Figure 3: The Moku Phasemeter offers built-in, real-time Allan deviation graphs.
    Figure 3: The Moku Phasemeter offers built-in, real-time Allan deviation graphs.

    Example: Using power spectral density for dark matter detection

    Dark matter detection usually involves an experiment searching for incredibly small signals within a vast sea of noise. These signals, or events, often occur at irregular intervals over long periods of time, making the data collected from these types of experiments very challenging and time-consuming to analyze.

    At Los Alamos National Laboratory, researchers used Moku:Pro to collect data, leveraging the flexible Moku Data Logger. Then, using the Moku Python API, they developed a technique to sift through these large data files in search of specific events. To detect low-amplitude events buried in noise, the team first used the Data Logger to track the background noise of the experimental setup. Then, they performed an FFT of this time-series data to determine the PSD.

    Next, the team supplied their digital acquisition software, called SPLENDAQ, as well as the PSD and an event template, resulting in the data shown in Figure 4. By using a PSD to characterize system noise, the researchers can easily detect extremely low-amplitude events.
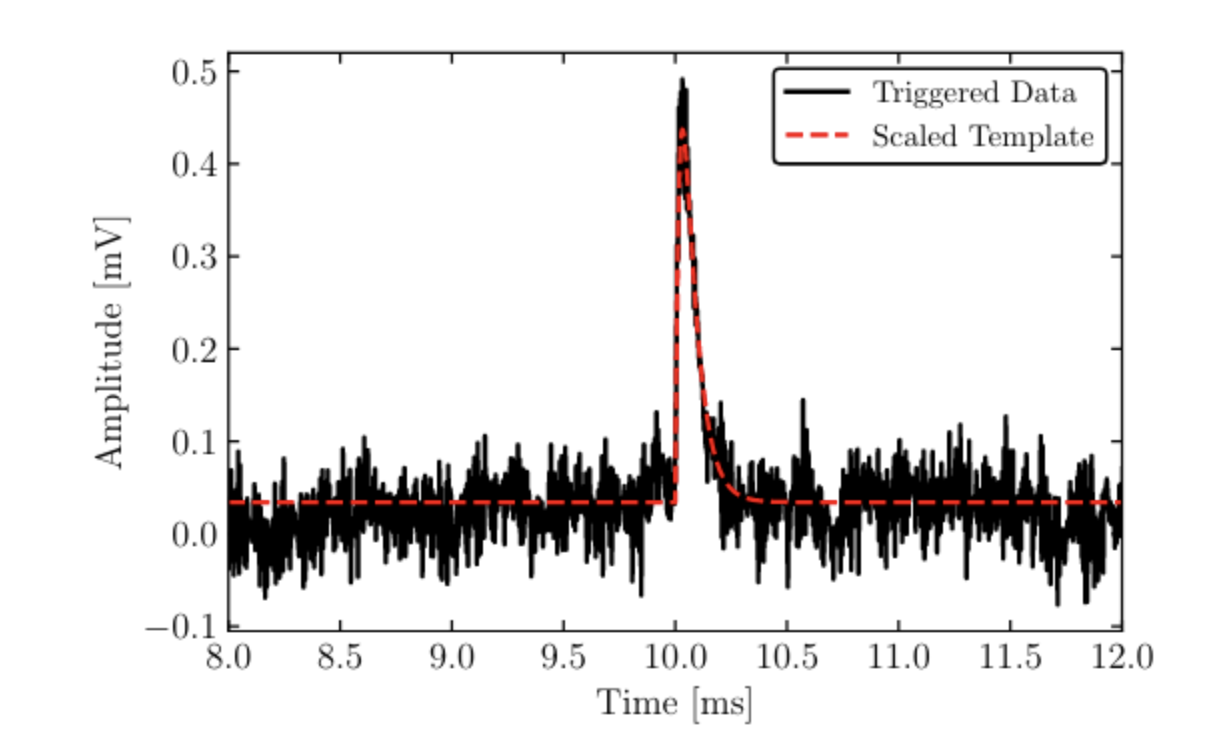
    SPLENDAQ event detection using the Moku data logger used to calculate Power Spectral Density
    Figure 4: Detection of a test event using SPLENDAQ and the Moku Data Logger.

    Conclusion

    PSD is a crucial tool in signal processing, allowing scientists and engineers to understand the underlying frequency content of signals. While calculating the PSD can be computationally heavy, built-in data visualization tools can reduce post-processing time and allow for better system characterization. Real-time graphs like those in the Moku Phasemeter allow engineers to view their data in parallel with the measurement.

    Try Moku in demo mode Download the Moku app → Get answers to FAQs Visit Knowledge Base → Connect with Moku users Join the user forum →

    Other Recommended Blog Posts

    Blog
    What is Generative Instrumentation?

    The AI-enabled technology for creating customized test solutions, including specialized measurements, real-time signal processing, and control capabilities

    Date: July 14, 2026

    Blog
    5 Advantages of FPGA-Based Customization for Test & Measurement

    How instruments with user-programmable FPGAs are replacing racks of test equipment, and what that means for your lab.

    Featuring: Moku Cloud Compile

    Date: May 22, 2026

    Blog
    Faster, more powerful real-time customization with MokuOS 4.2

    MokuOS 4.2 unlocks higher bandwidth, faster real-time processing, and more instruments on Moku:Delta, all with a simple software update.

    Date: March 19, 2026

    Back to all Blog

    Nav

    • Products
    • Instruments
    • Resources
    • Support
    • Company
    • Contact Us
    • Privacy Policy
    • Terms of Use

    Offices

    United States
    (619) 332-6230
    12526 High Bluff Dr.
    Suite 150
    San Diego, CA 92130

    Australia
    +61 2 6171 9730
    243 Northbourne Avenue
    Suite 1, Level 1
    Lyneham, ACT 2602

    Australia
    +61 3 7073 3594
    Suite 5C, Level 5,
    700 Swanston Street,
    Carlton, VIC – 3058


    Follow us

    LinkedIn YouTube X Facebook Instagram

    官方微信

    © 2026 Liquid Instruments. All rights reserved.