Supporting Material
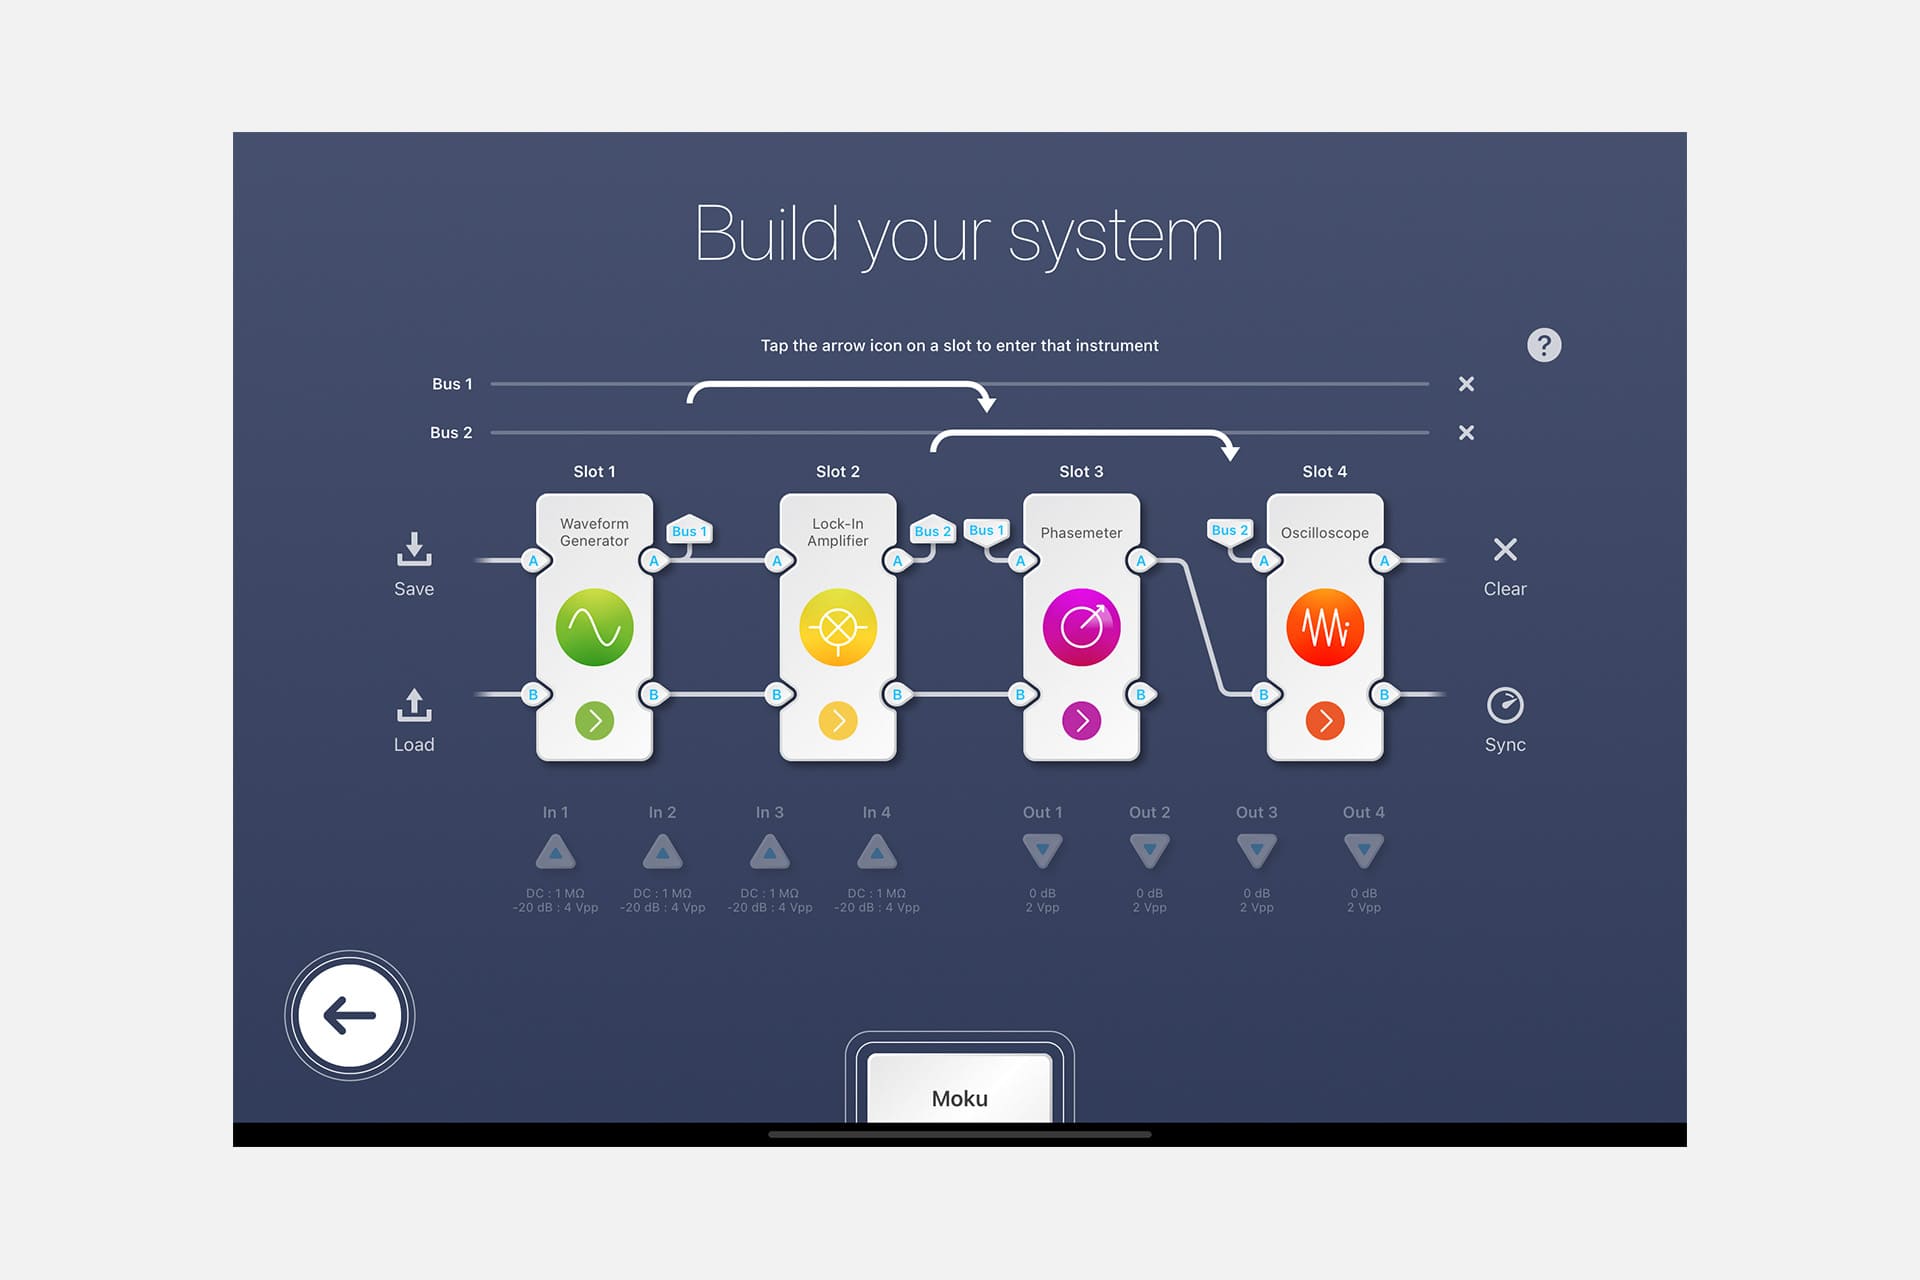
Master precise phase detection with the Moku Lock-in Amplifier and Phasemeter
Featuring: Moku:Pro, Phasemeter, Lock-in Amplifier
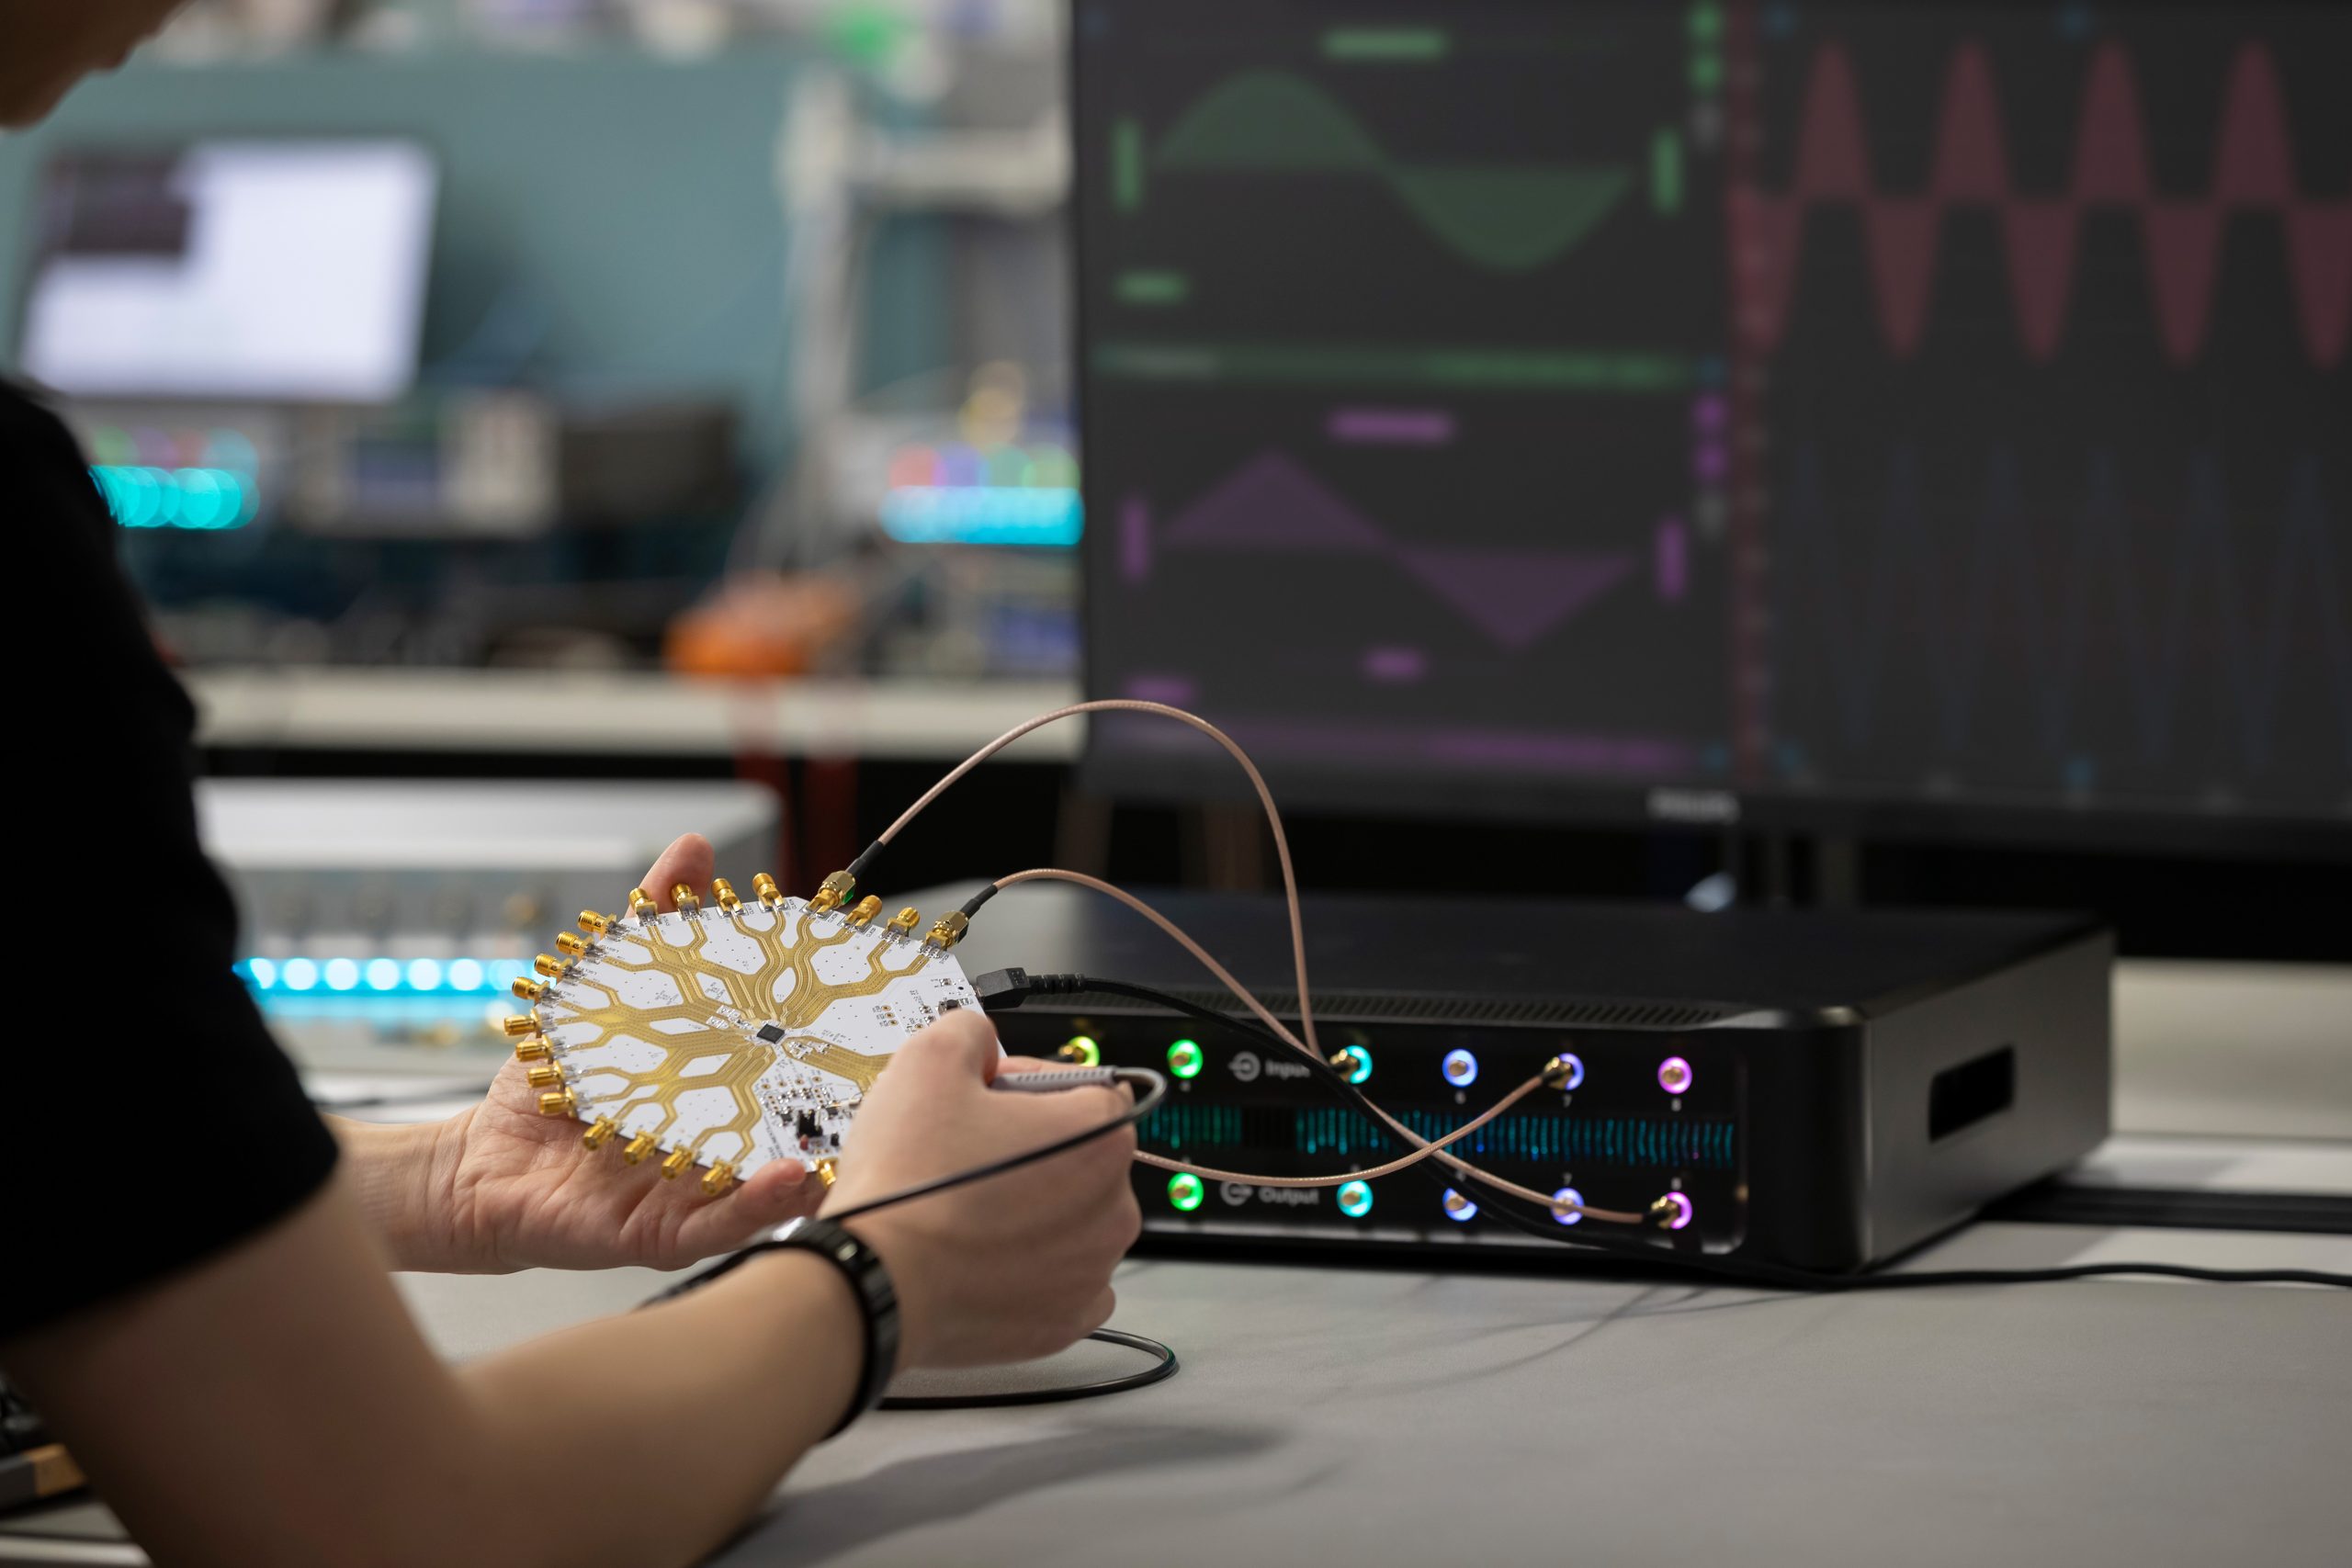
Date Recorded: Oct 2, 2025
Speaker: Jessica Patterson
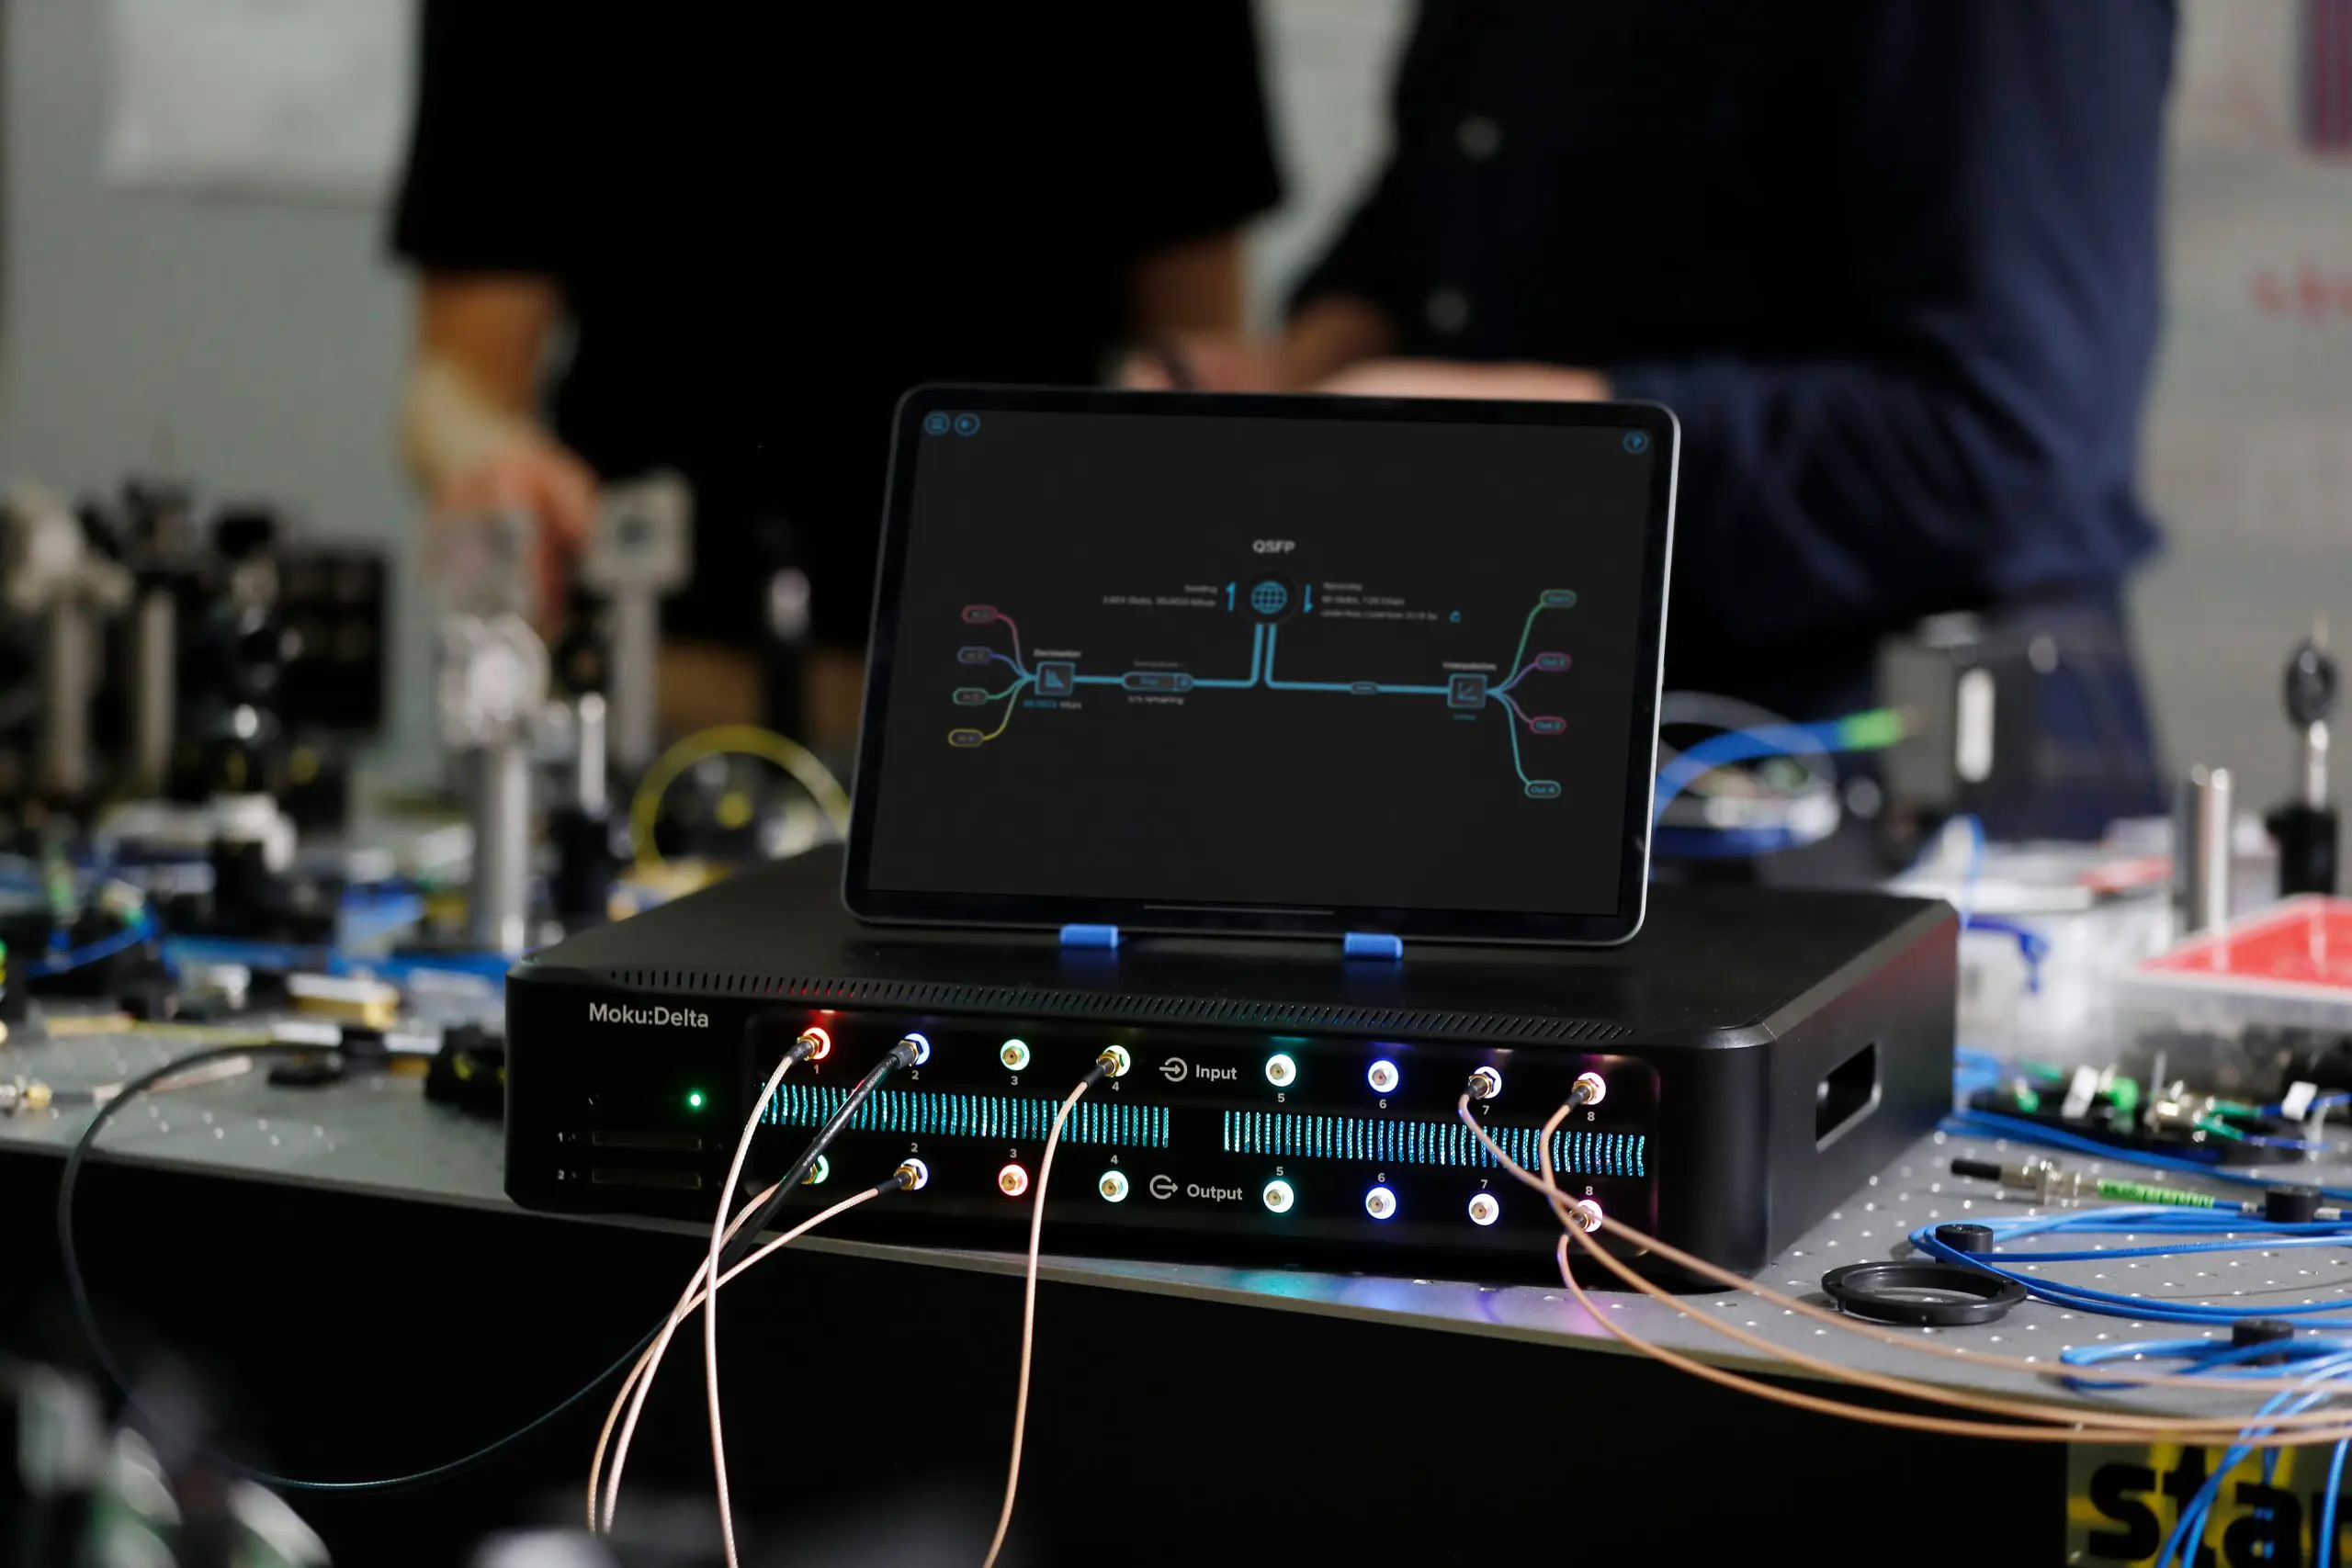
Date Recorded: Jan 29th, 2026
Speaker: Jason Ball, Ph.D.

Learn how researchers at the University of Hong Kong used Moku:Pro to generate synchronized shortwave-infrared nanosecond pulses and stabilize modulation depth for dual-wavelength photoacoustic imaging.
Featuring: Moku:Pro, Waveform Generator, PID Controller
Date: Dec-19-2025

Learn how students at IIT Madras are gaining hands-on experience in using the Lock-in Amplifier instrument on Moku:Go
Featuring: Moku:Go, Lock-in Amplifier
Date: Dec-15-2025
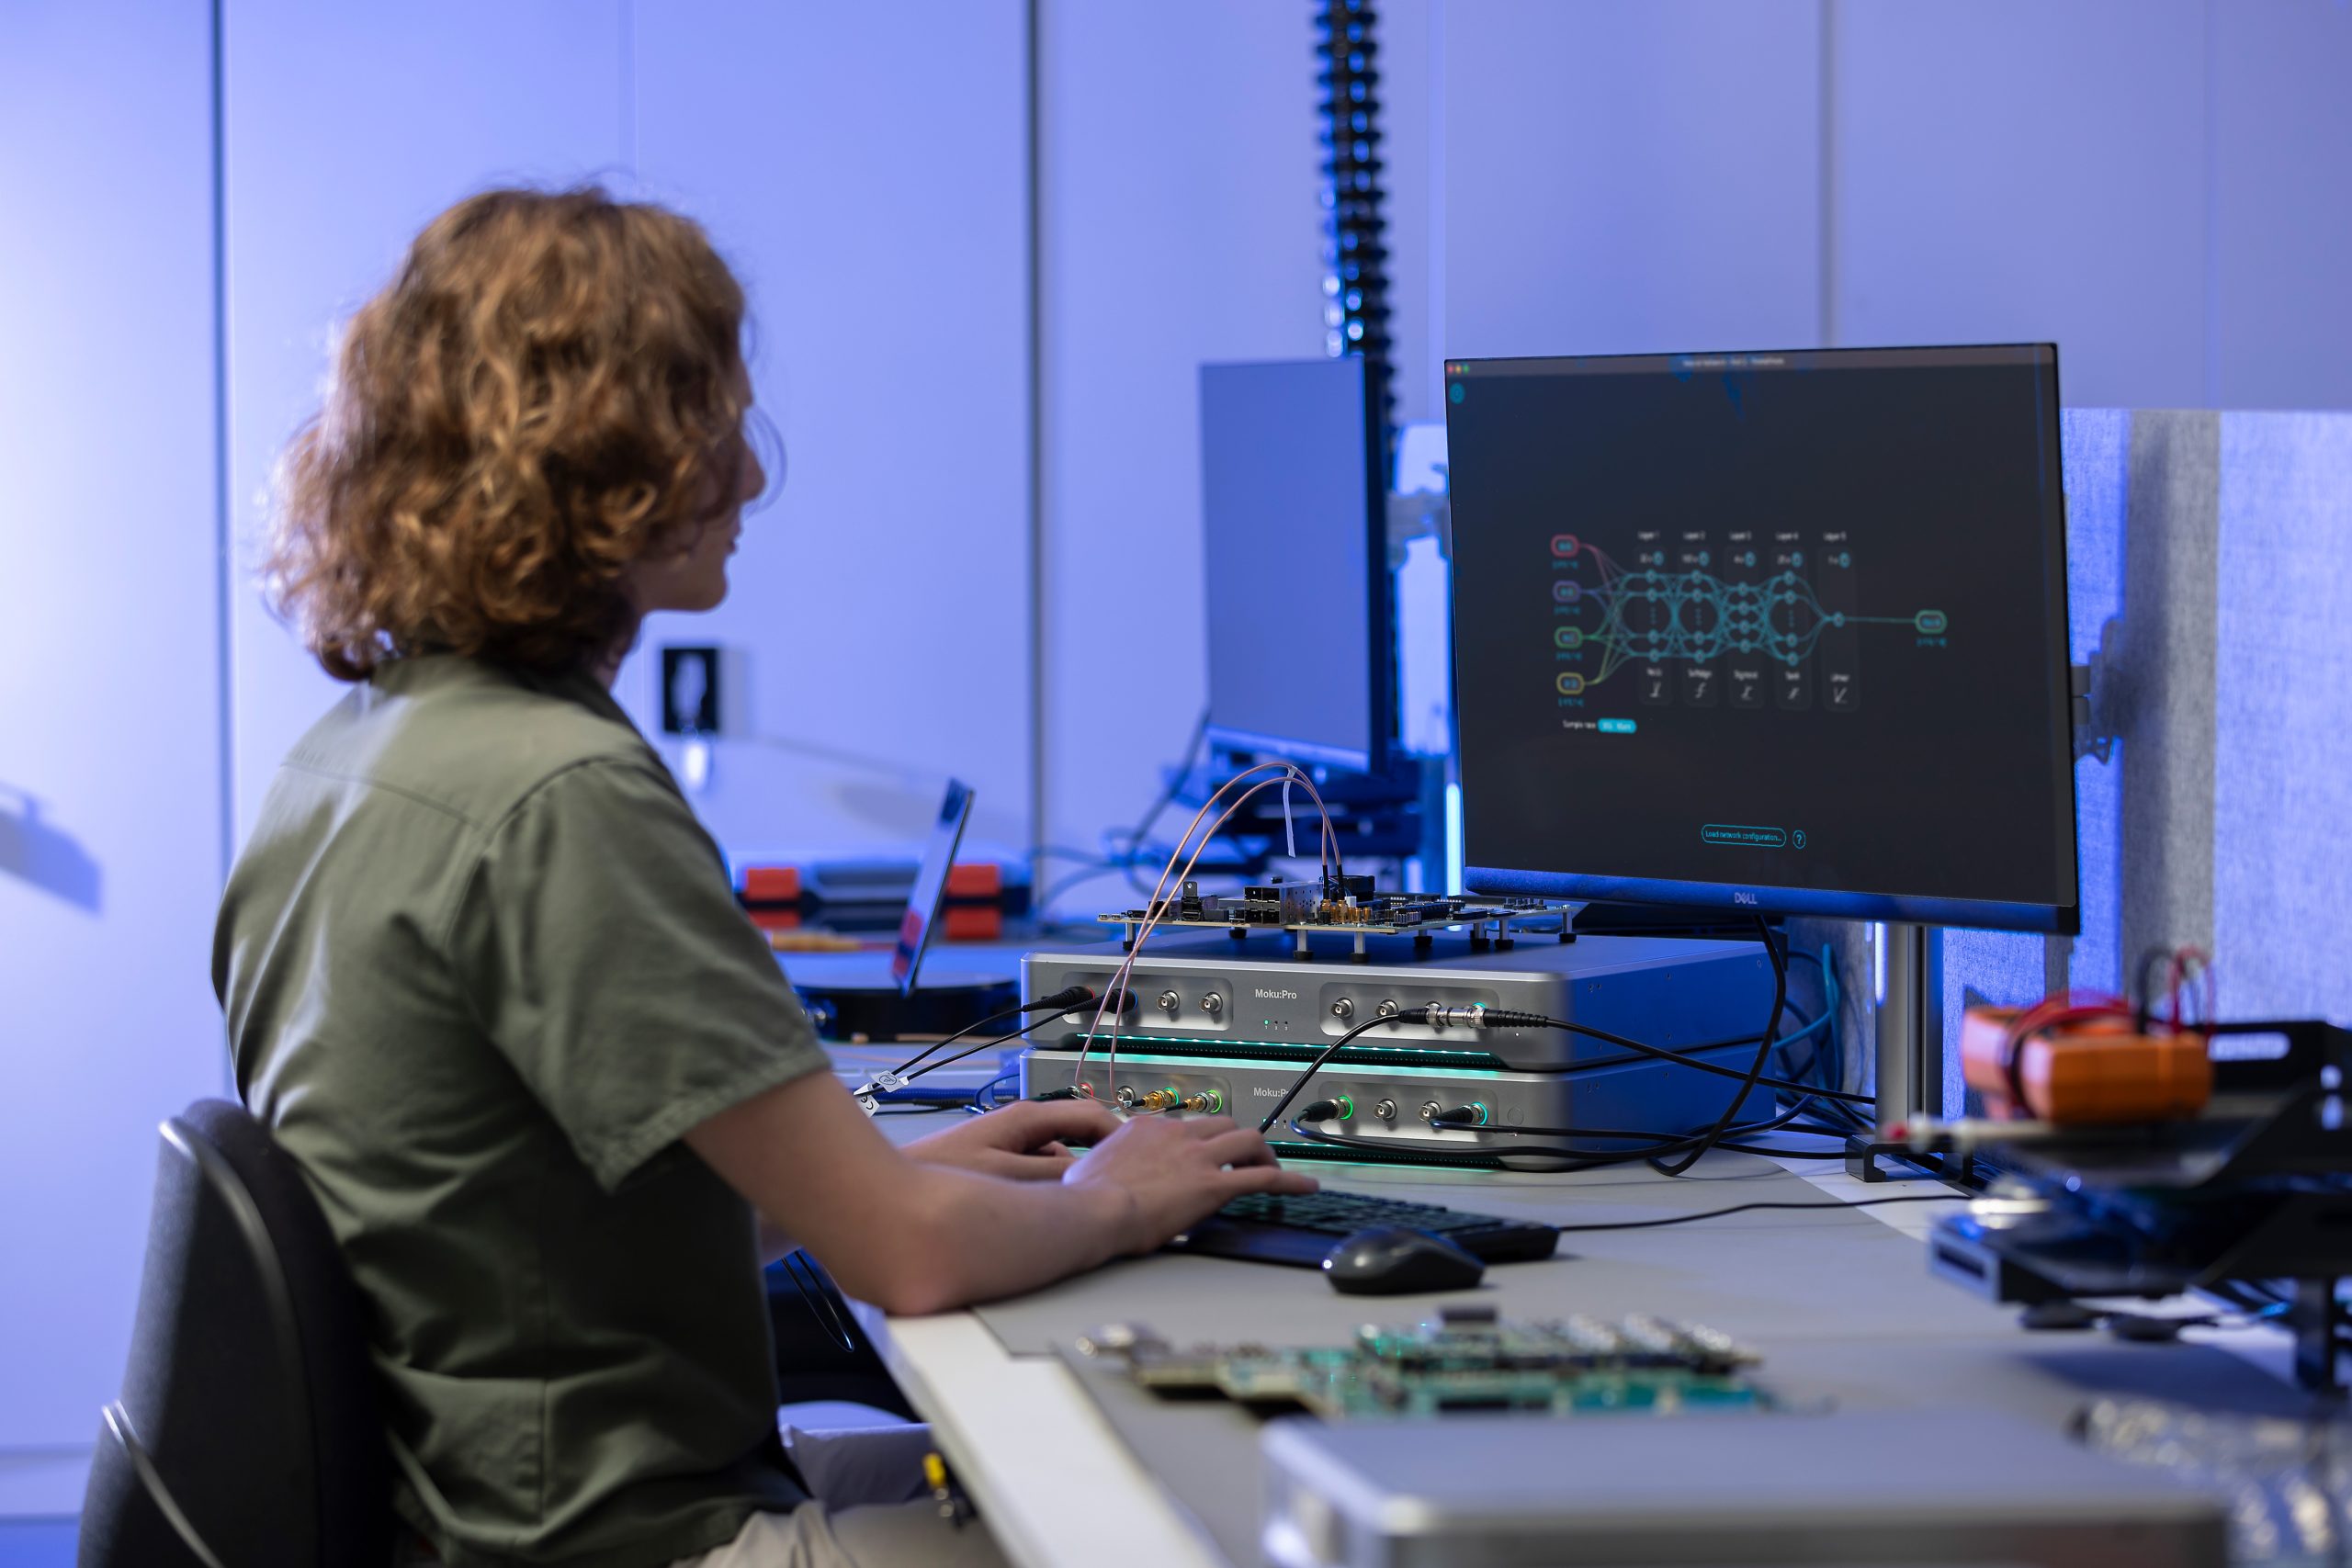
Why real-time inference belongs on an FPGA
Featuring: Neural Network
Date: December 11, 2025
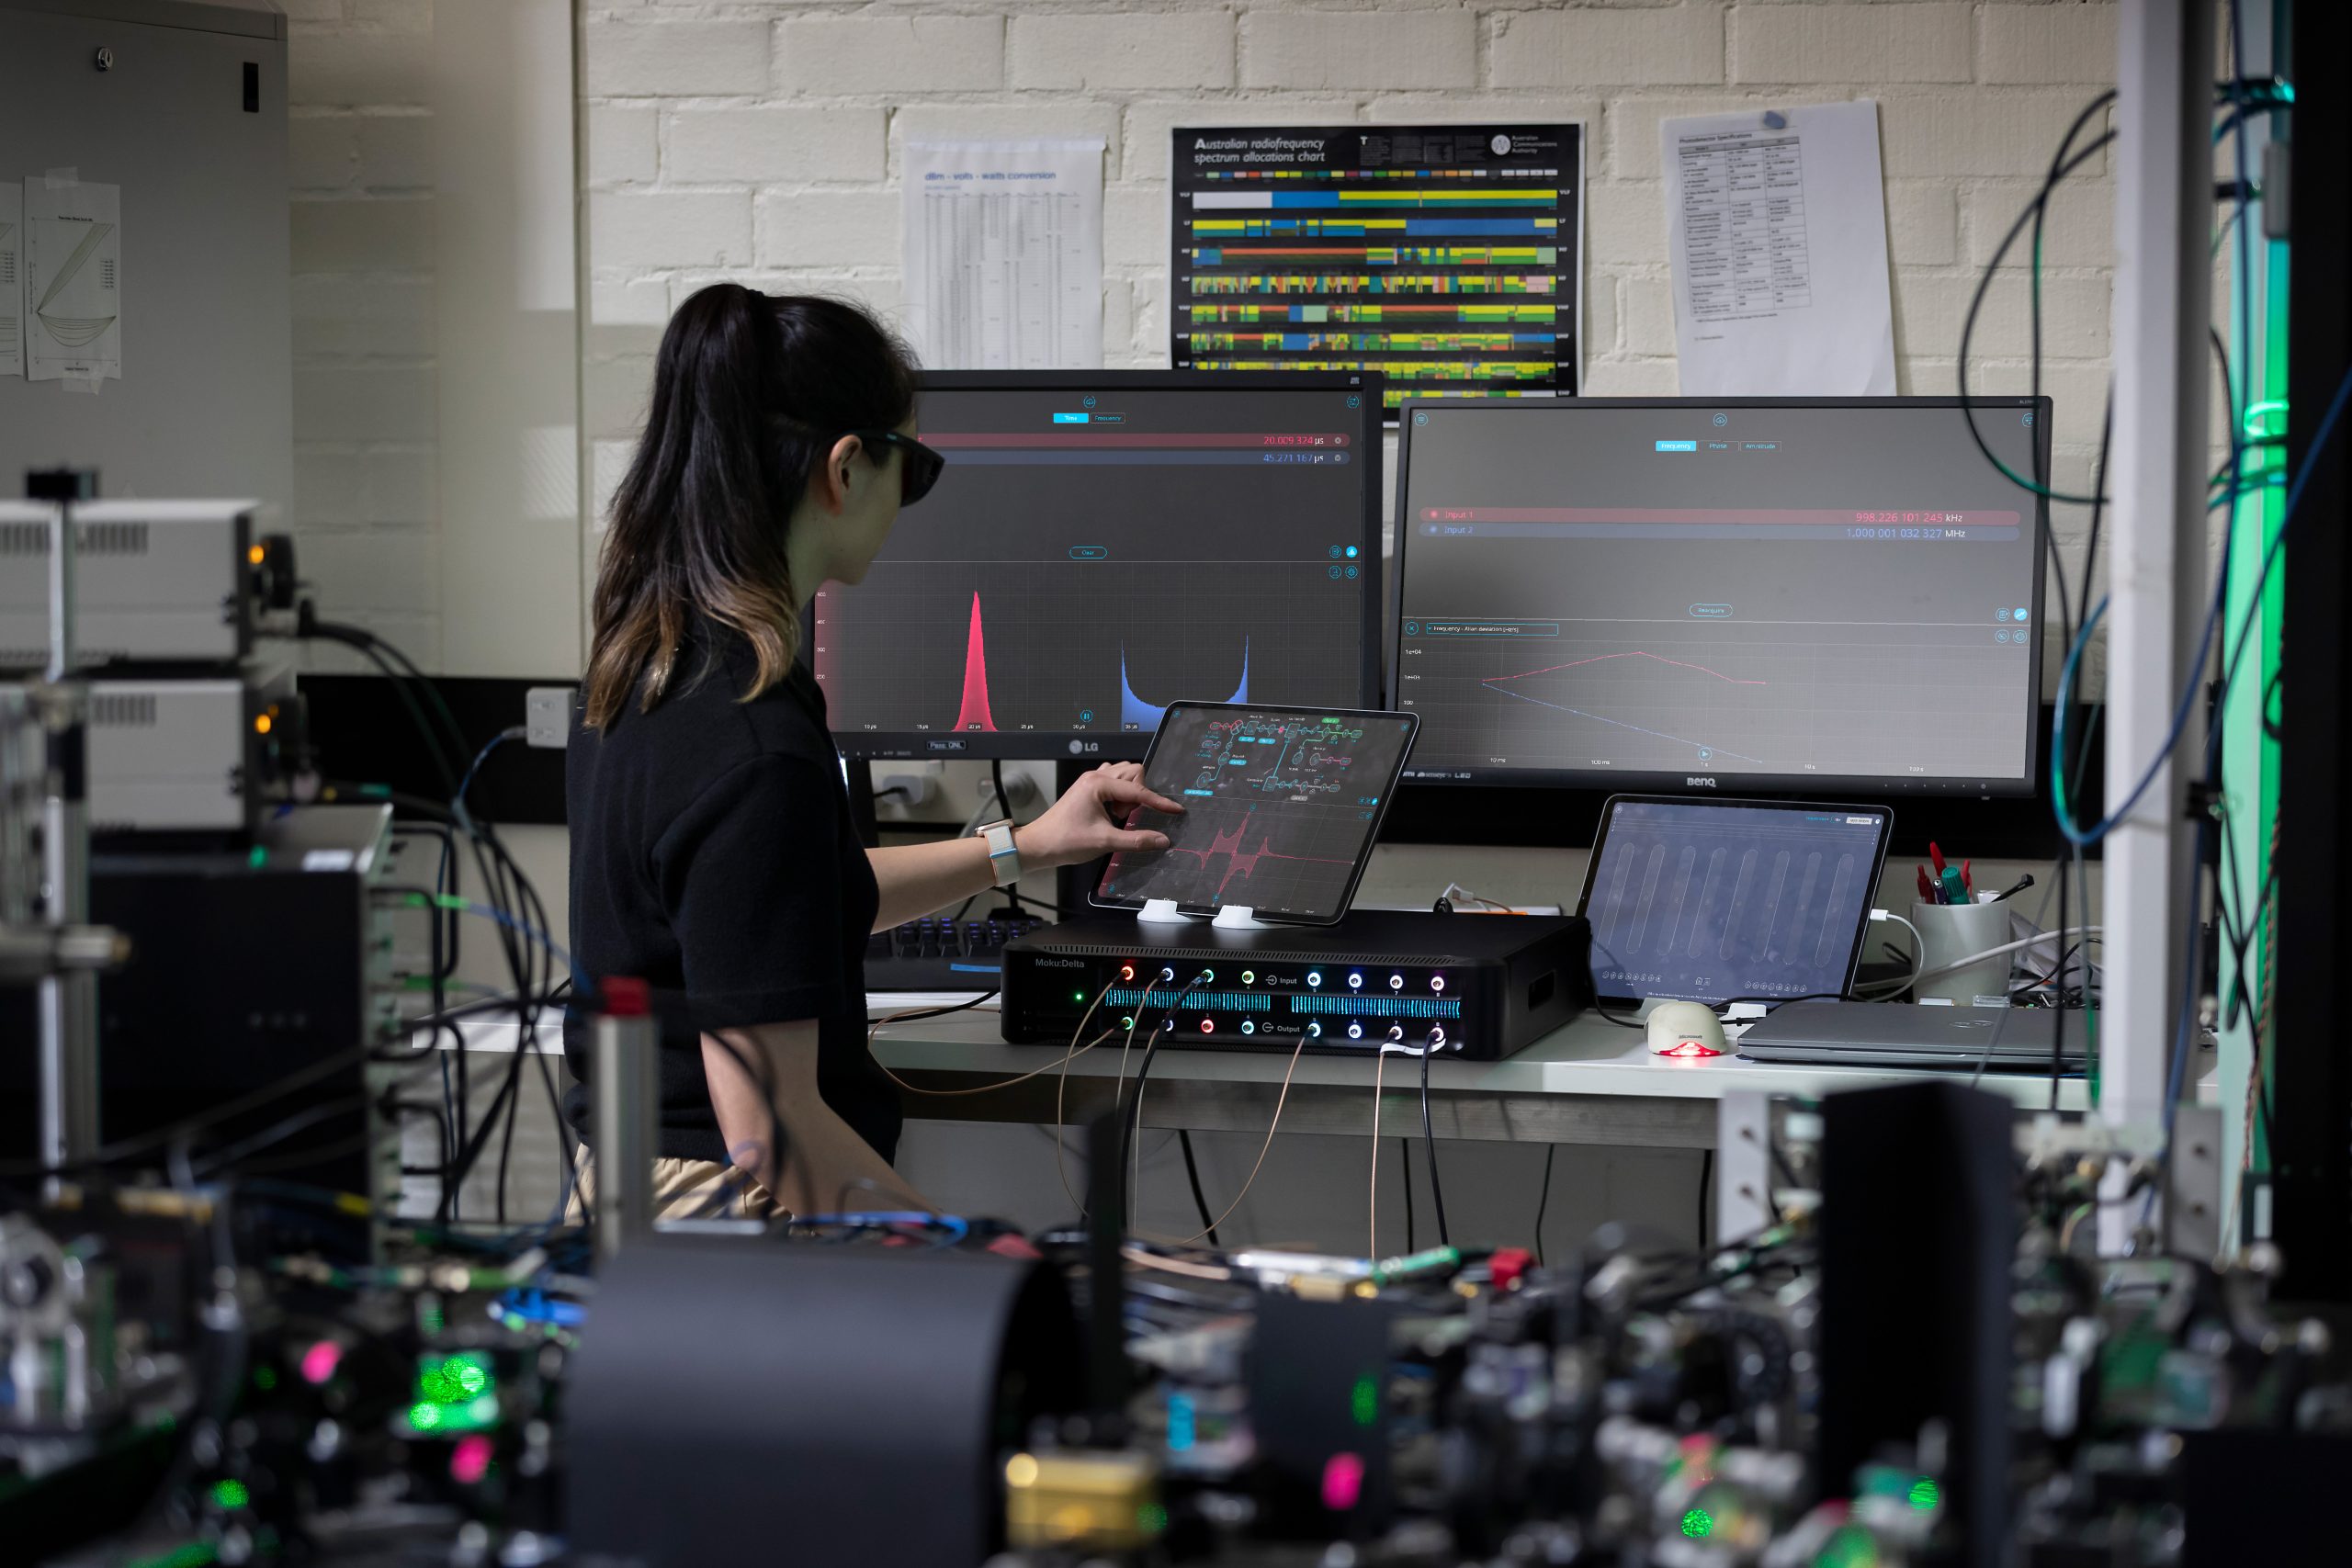
Understanding the Bloch sphere
Featuring: Arbitrary Waveform Generator
Date: December 9, 2025
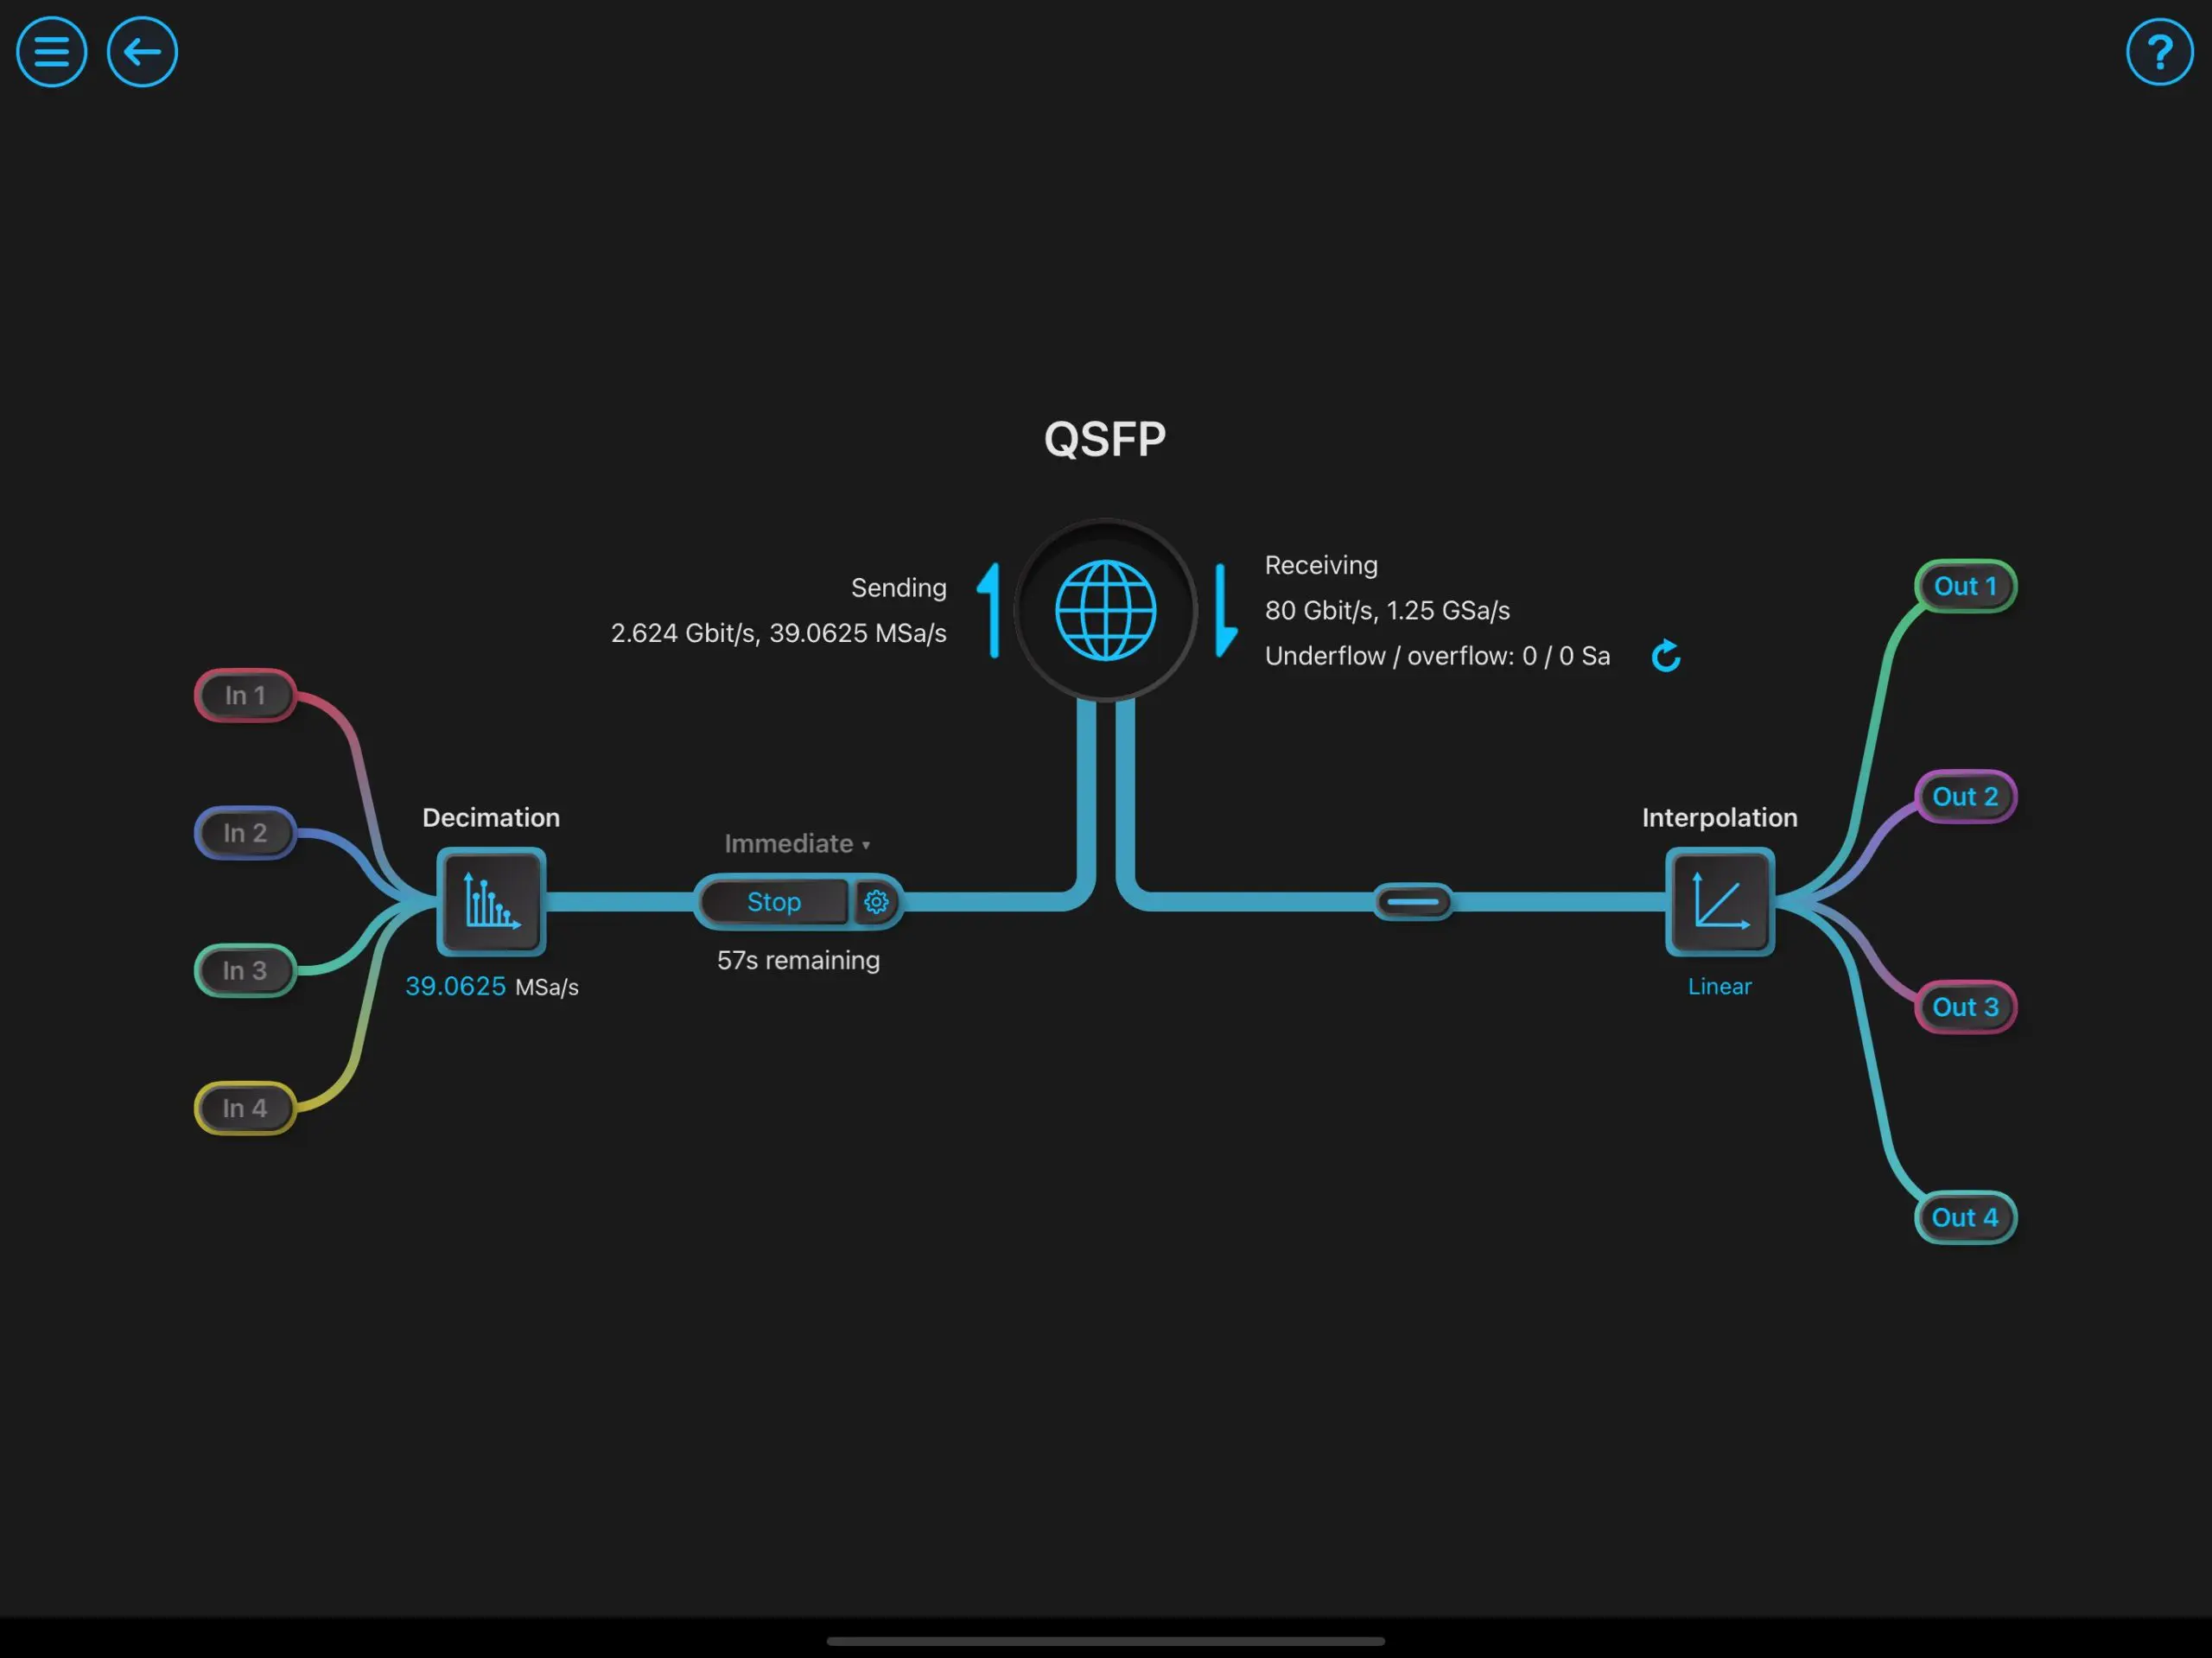
Learn about the Gigabit Streamer, time correlation measurements, and extra customization options for Moku devices.
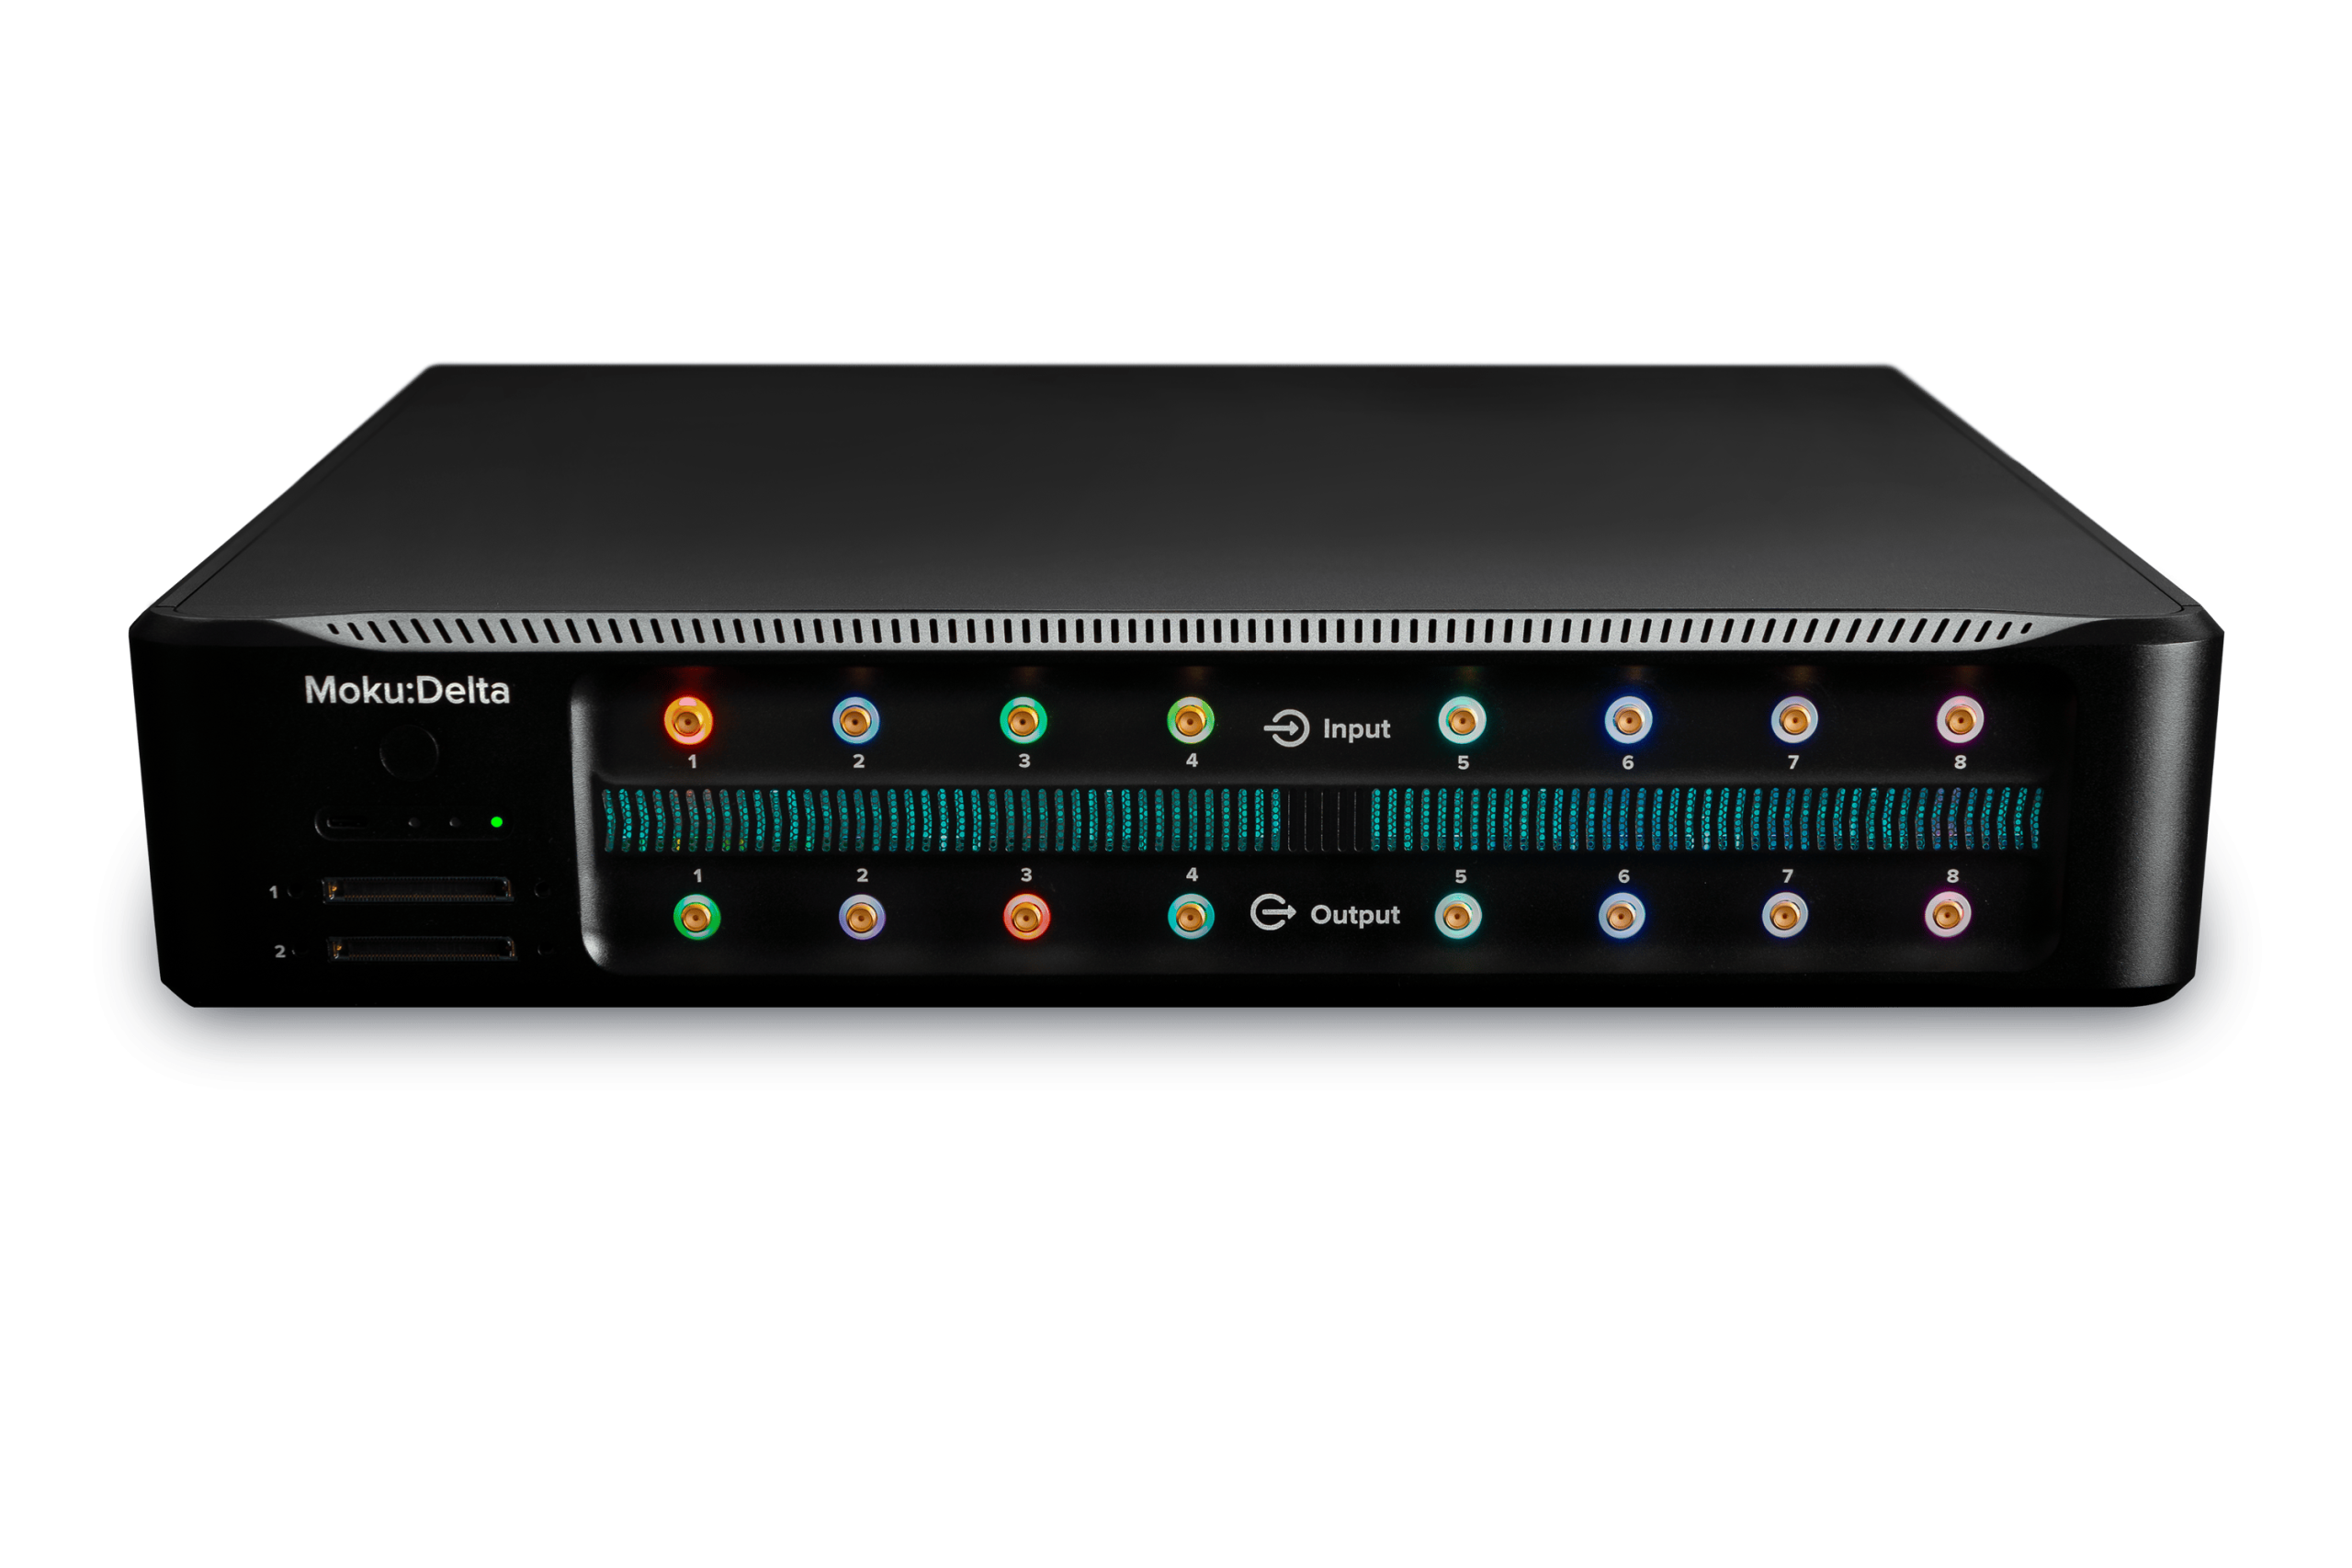
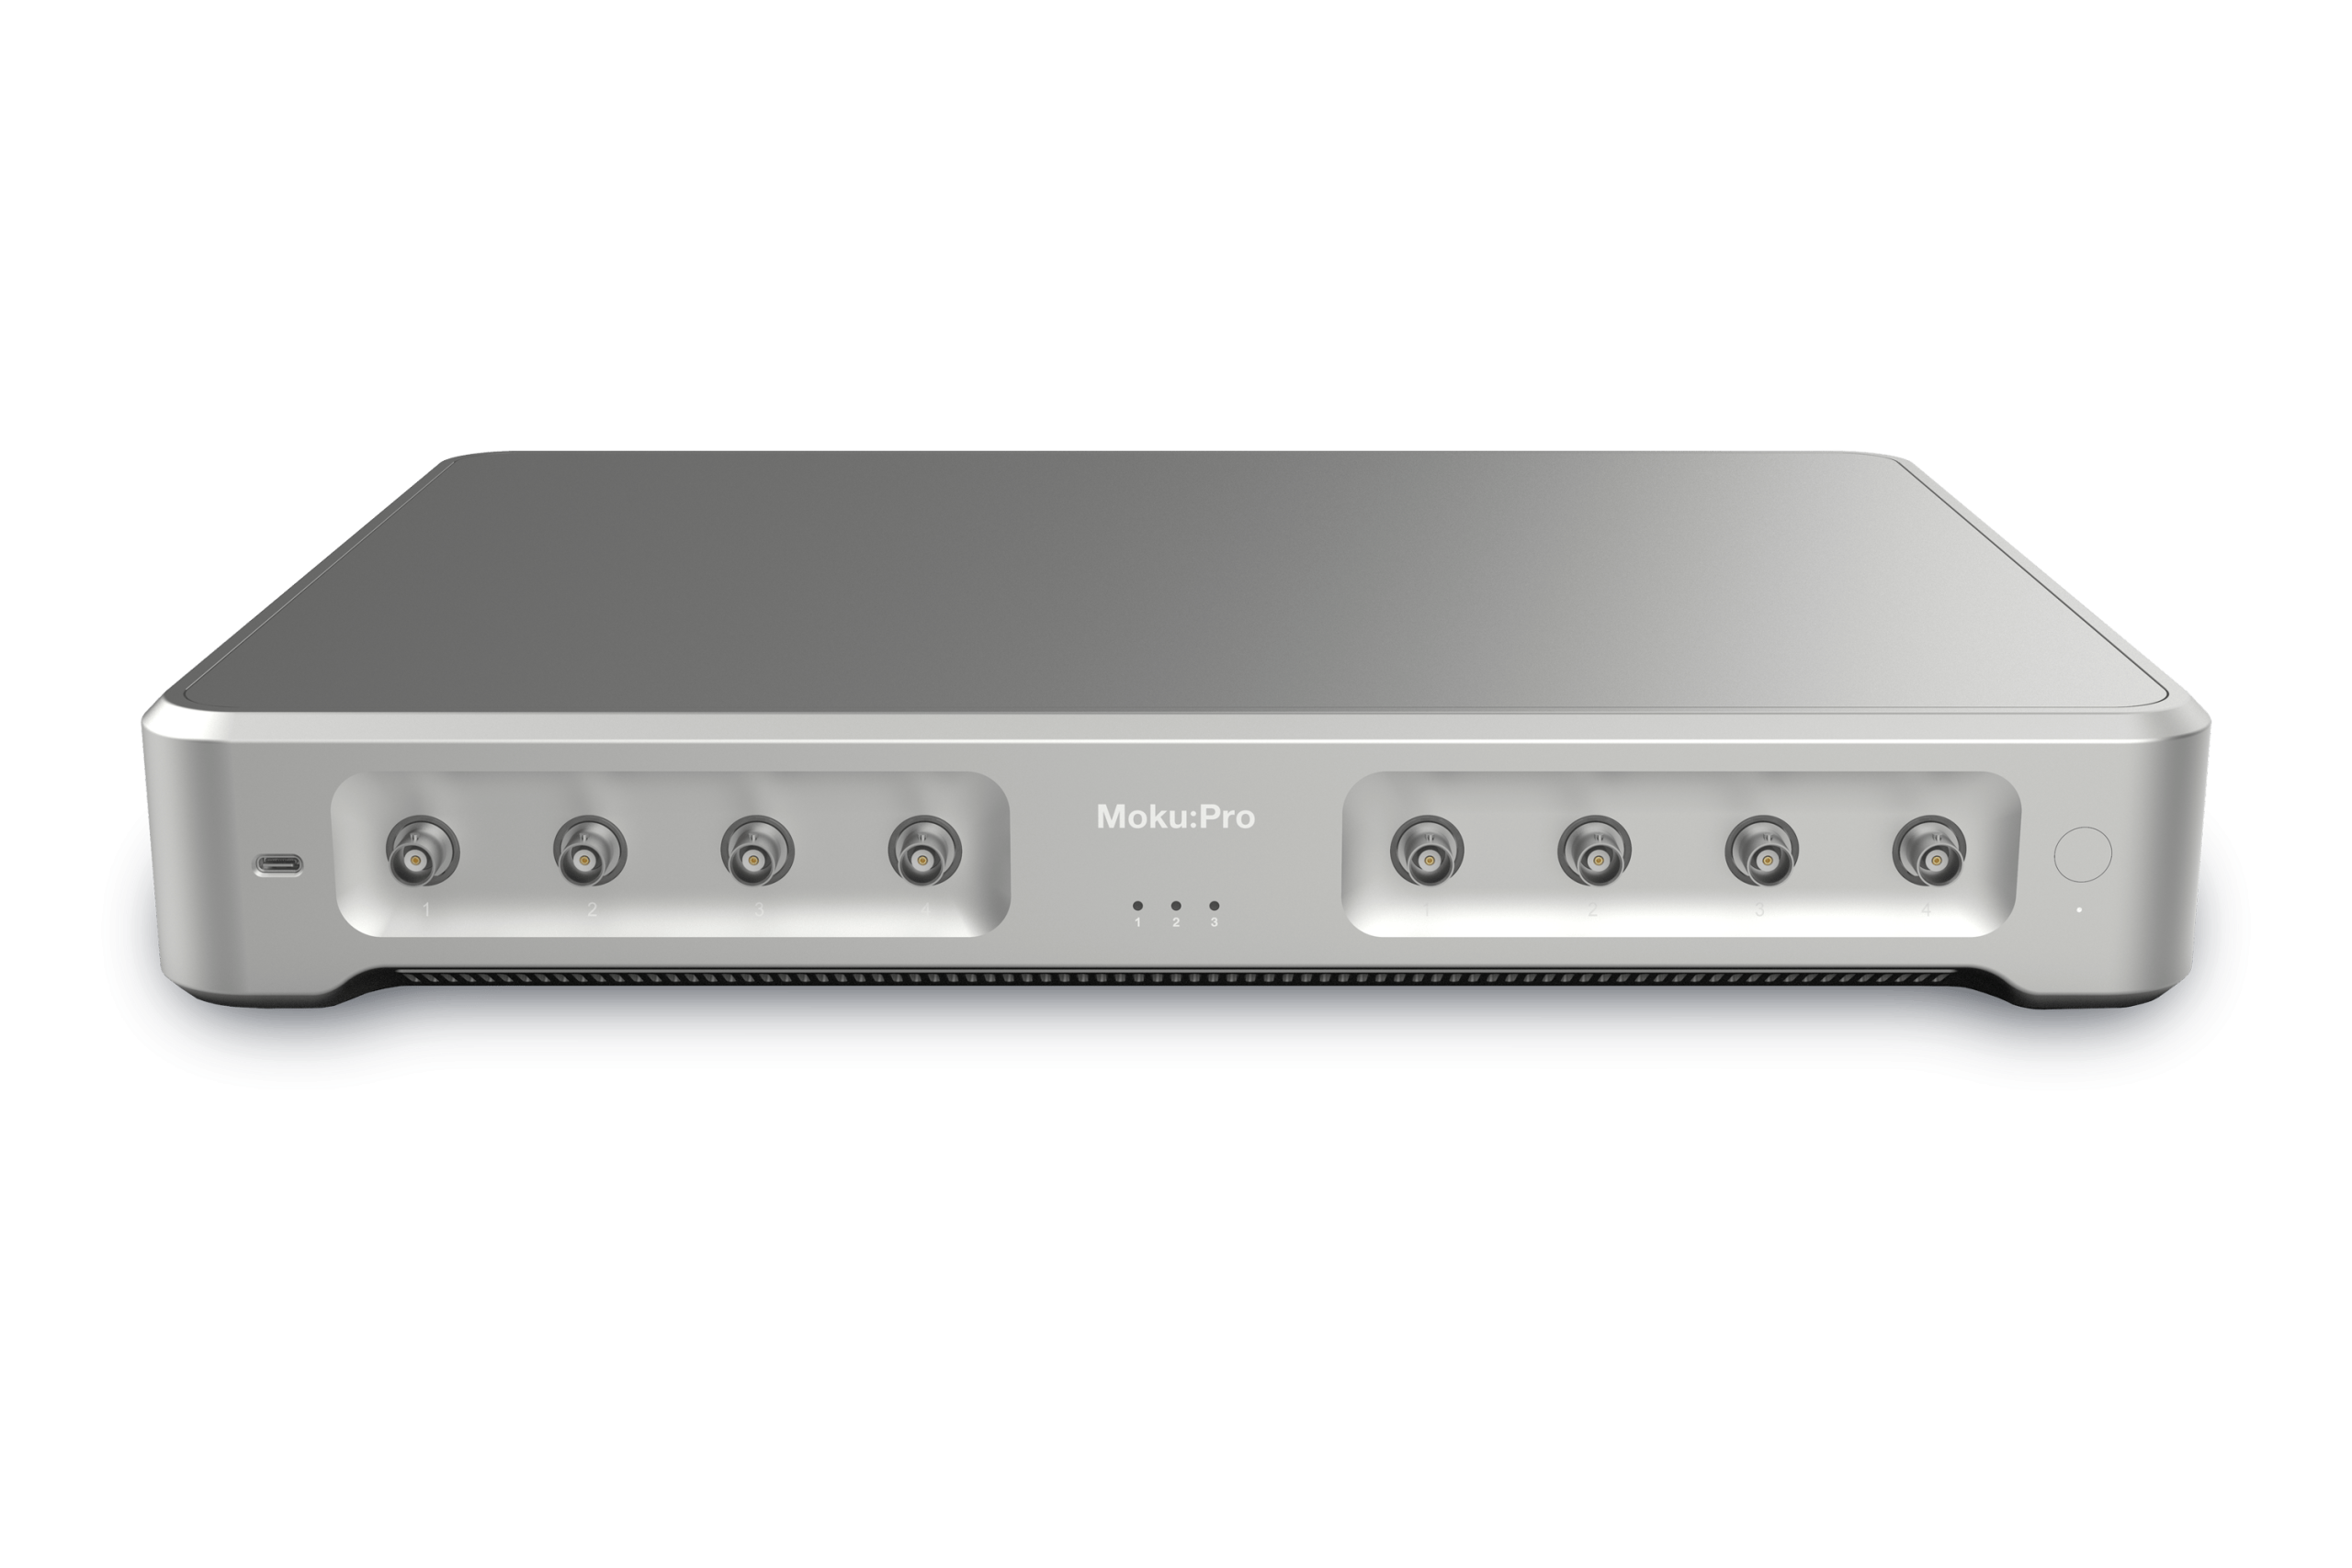
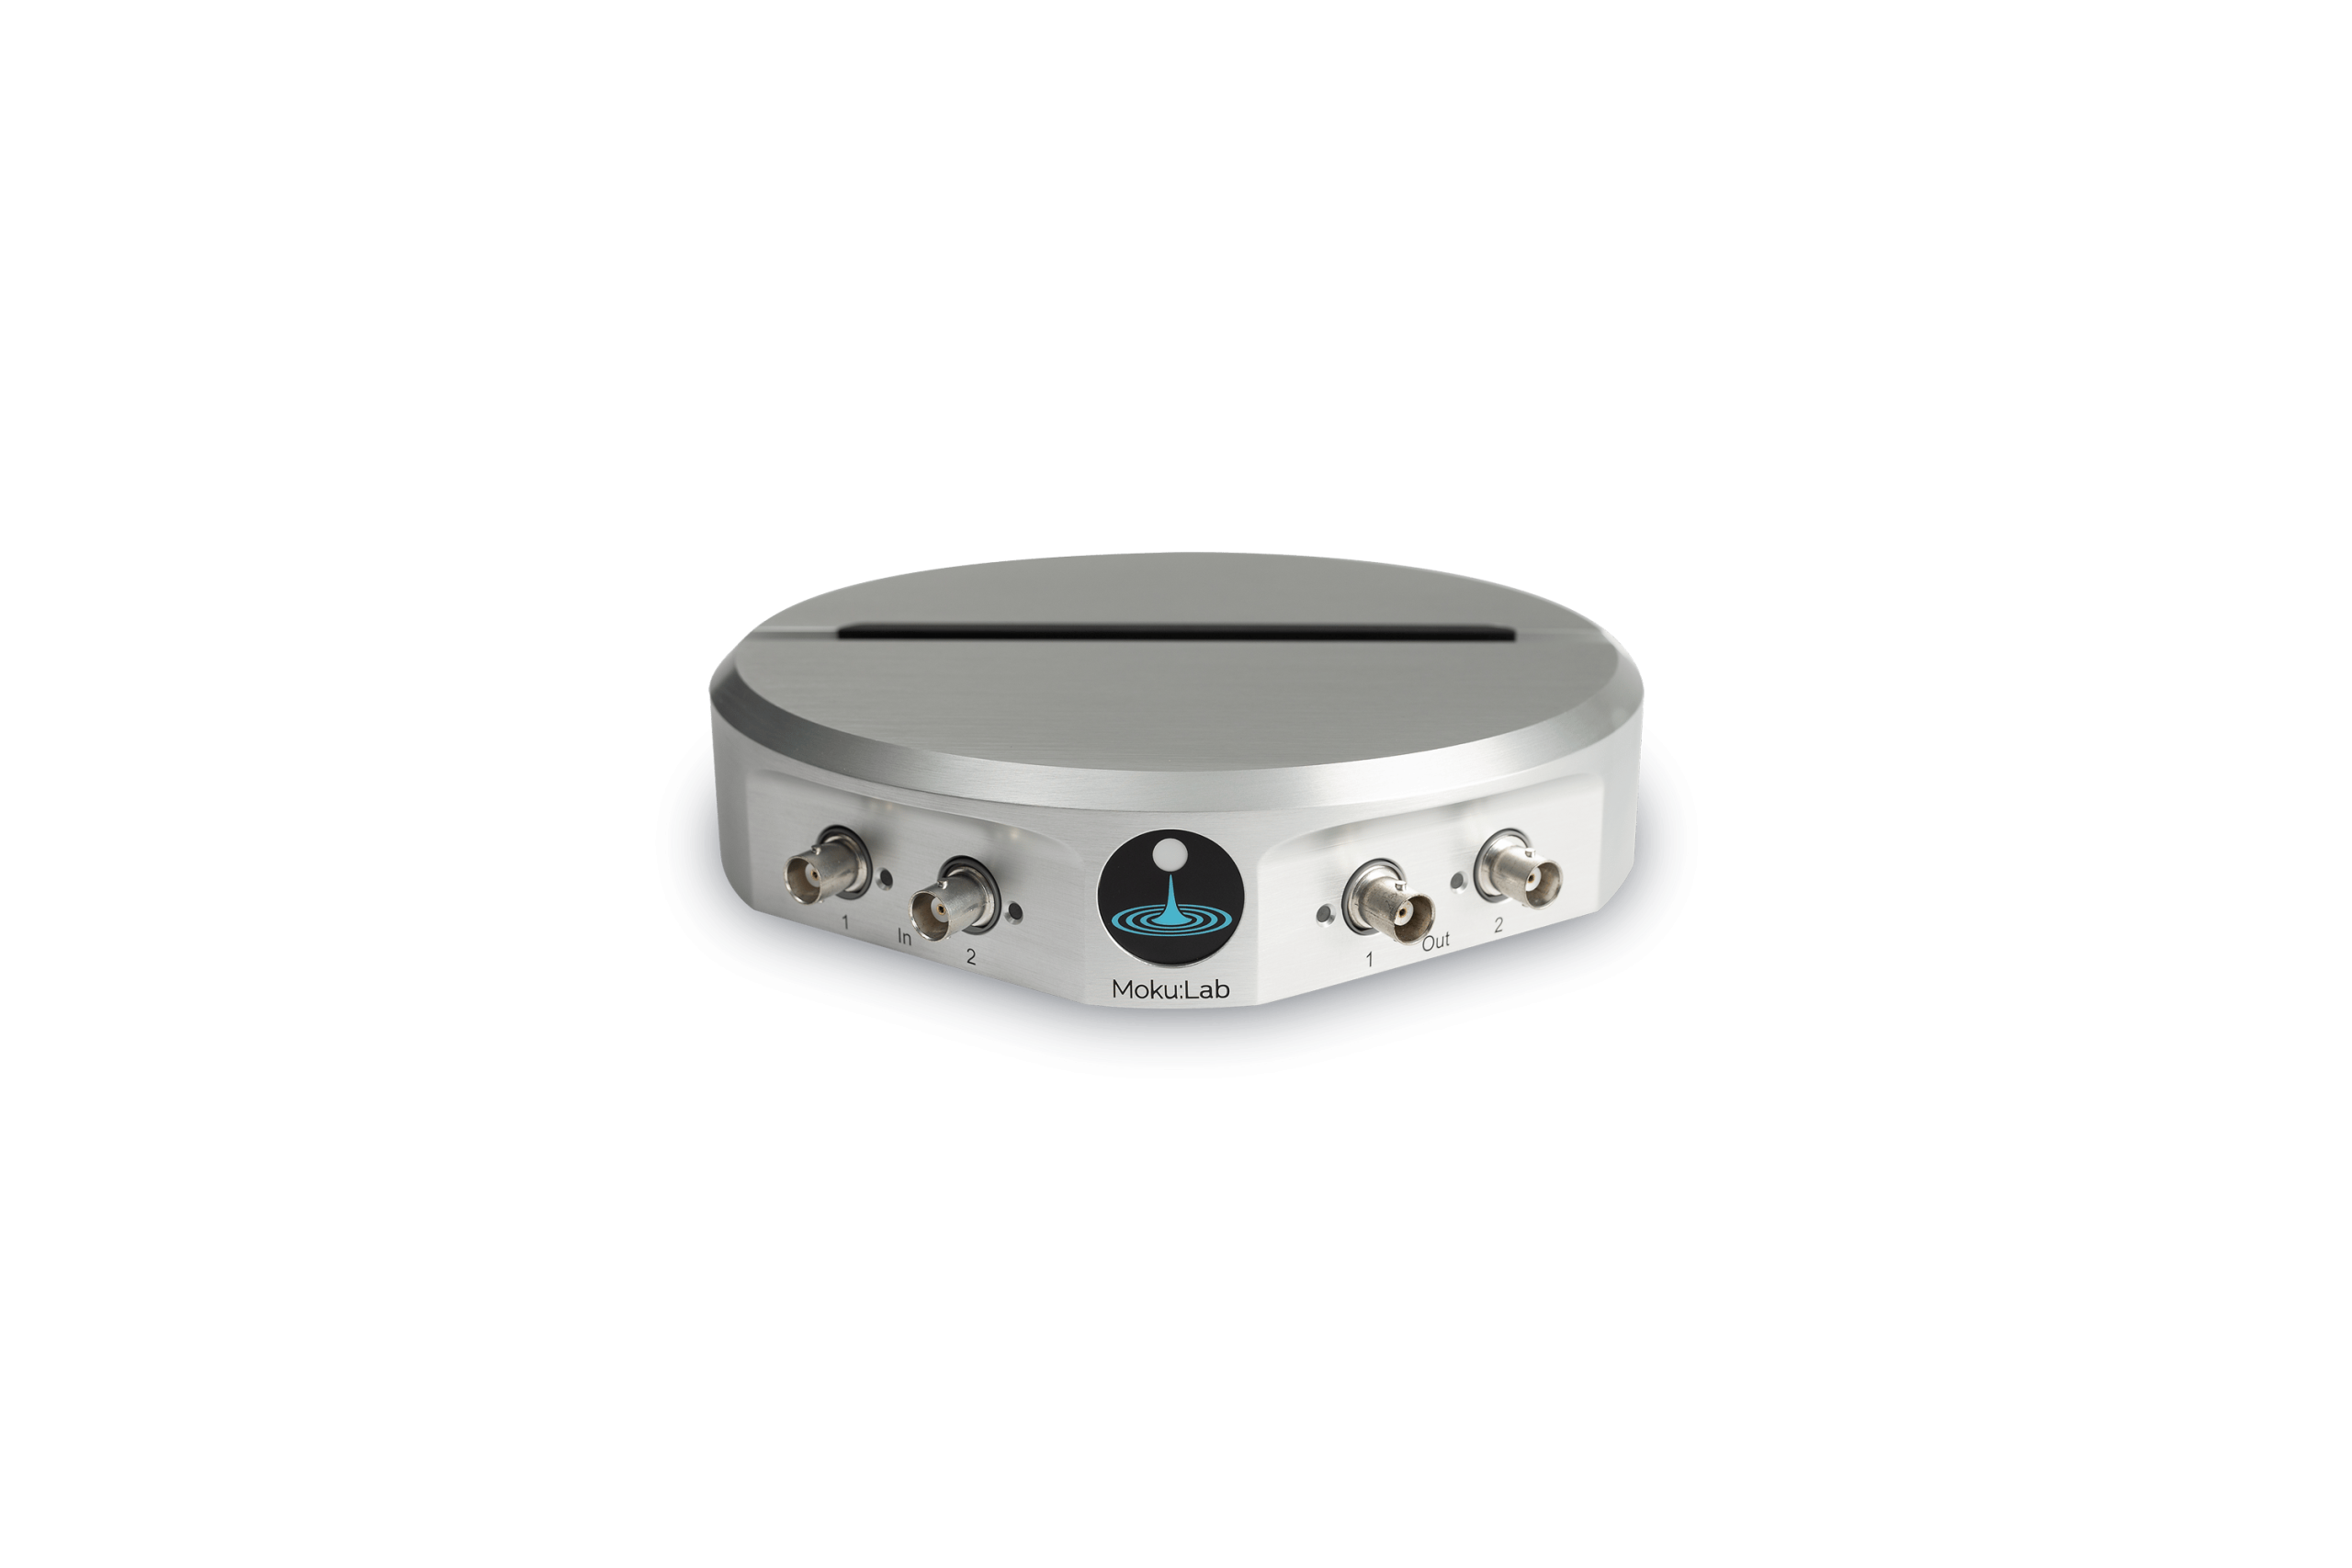
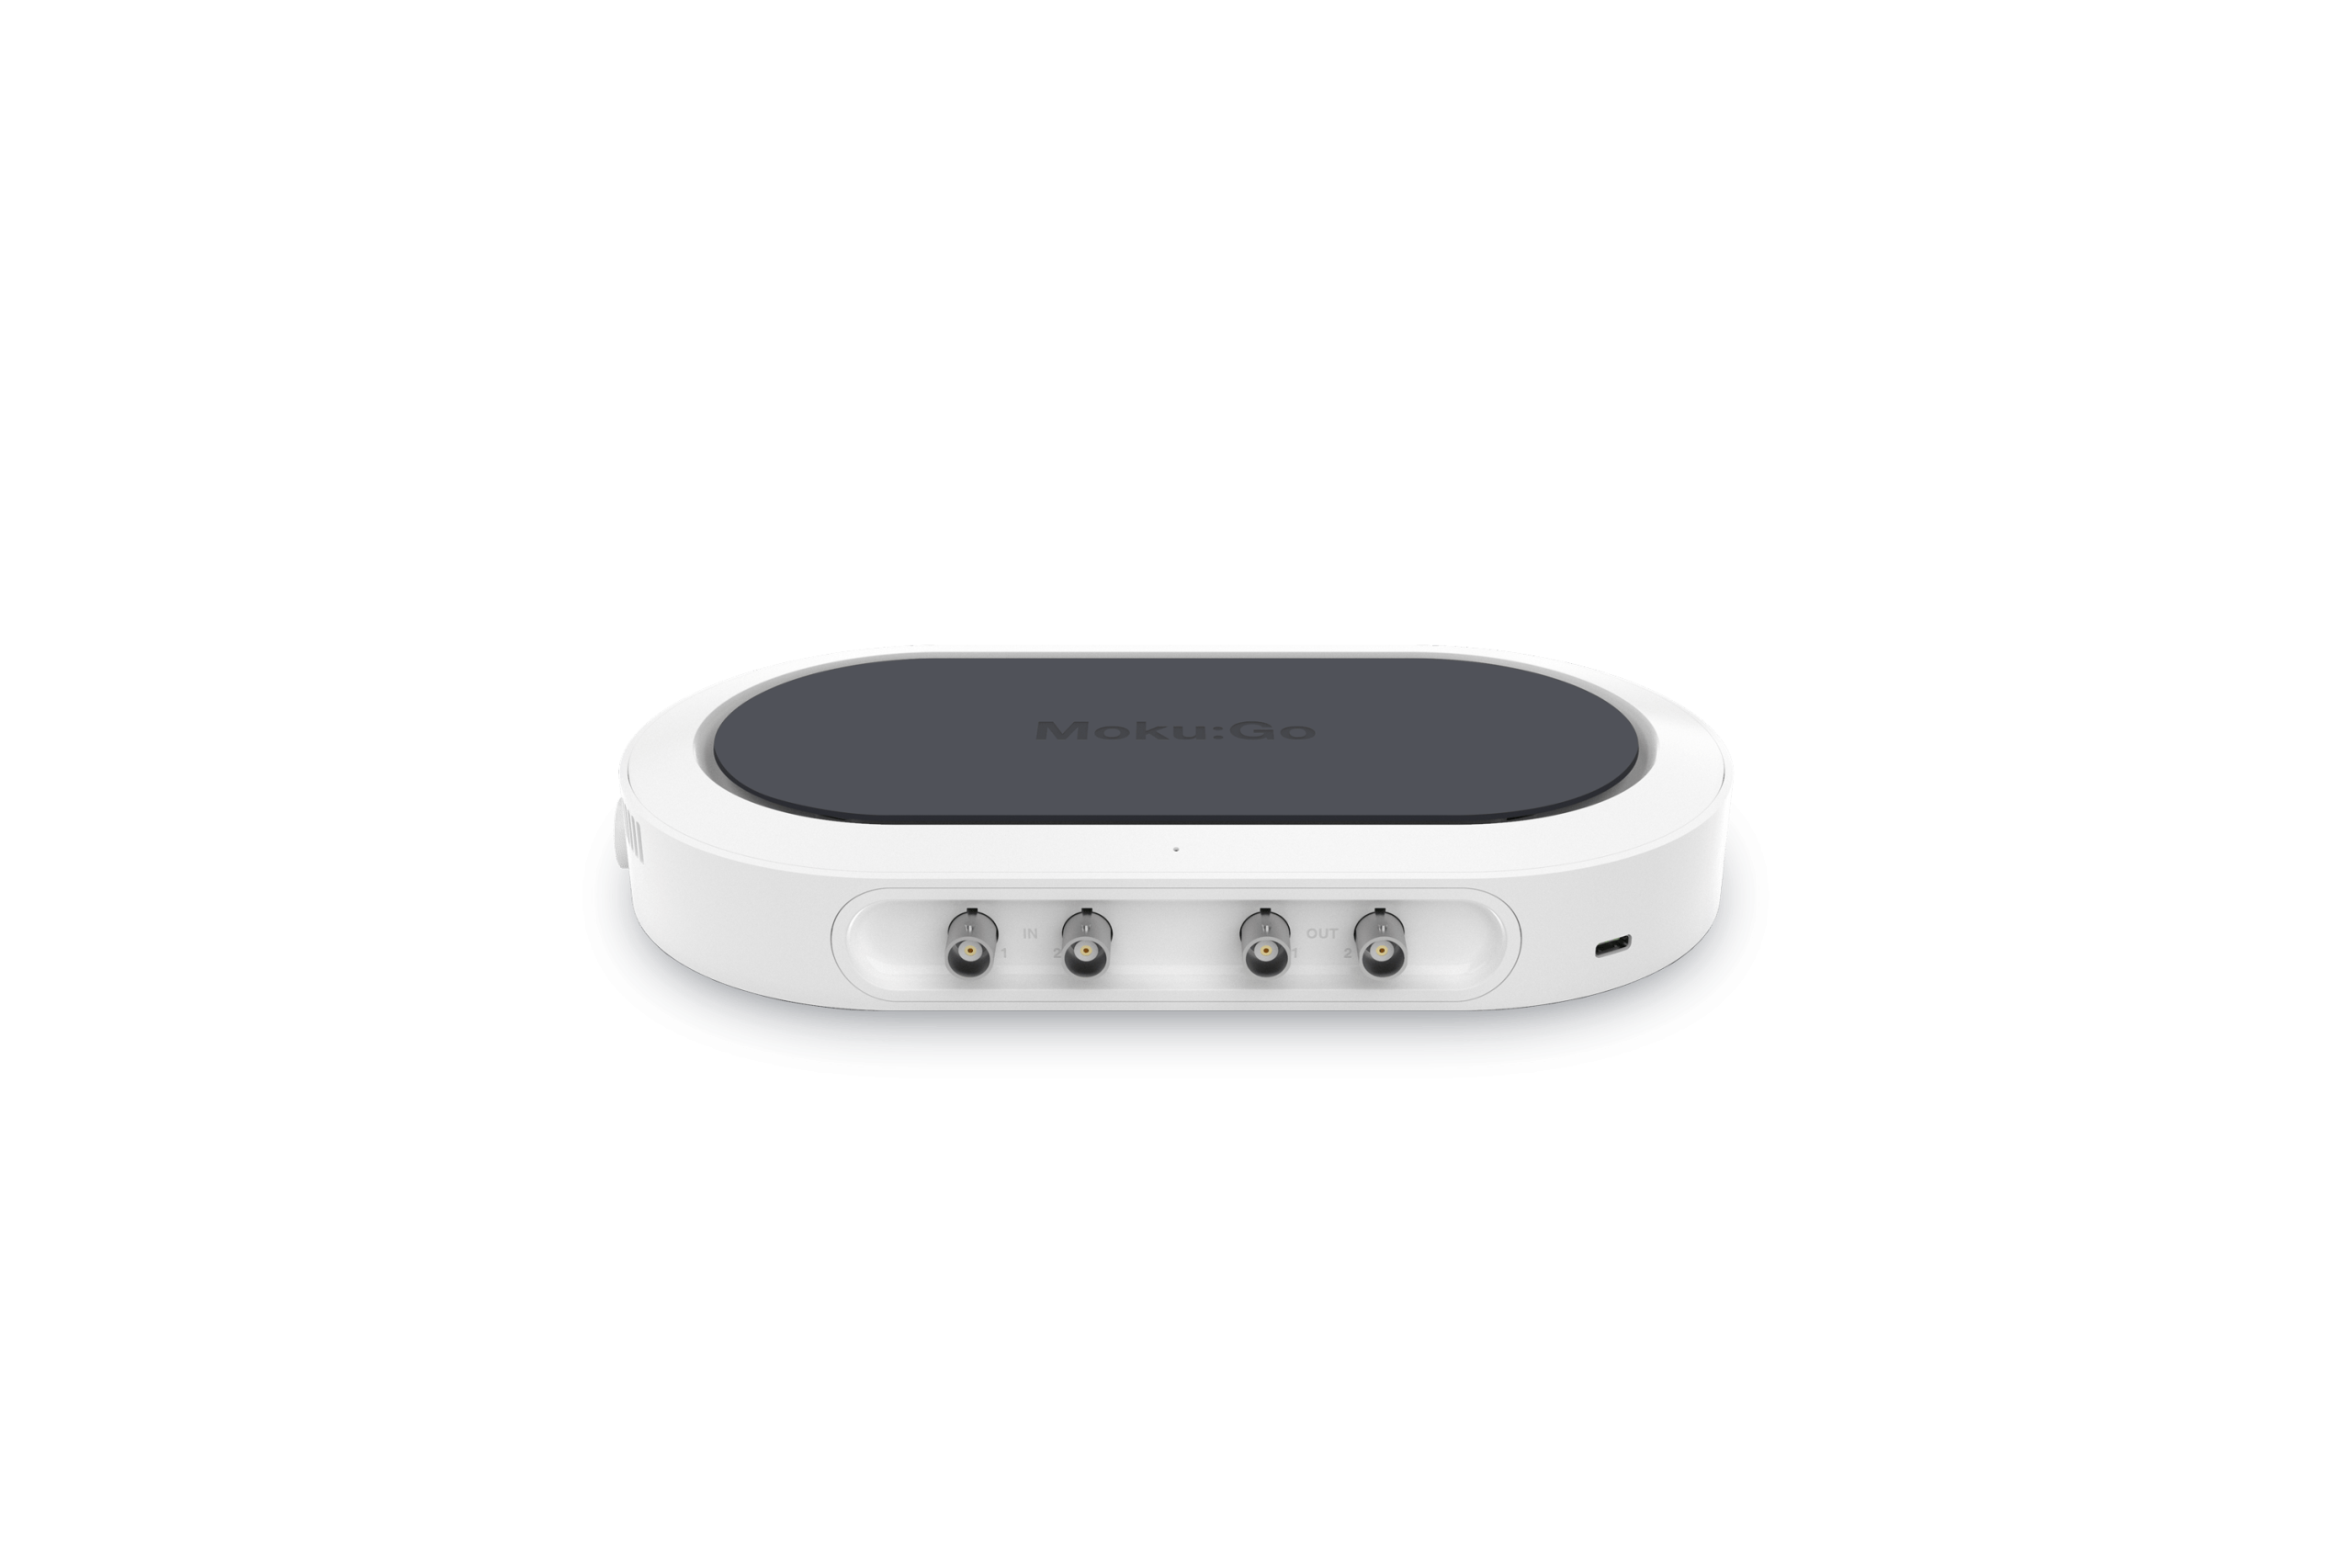
Featuring: Moku:Delta, Moku:Pro, Moku:Lab, Moku:Go, Multi-Instrument Mode, Moku Cloud Compile, Neural Network
Date: December 3, 2025
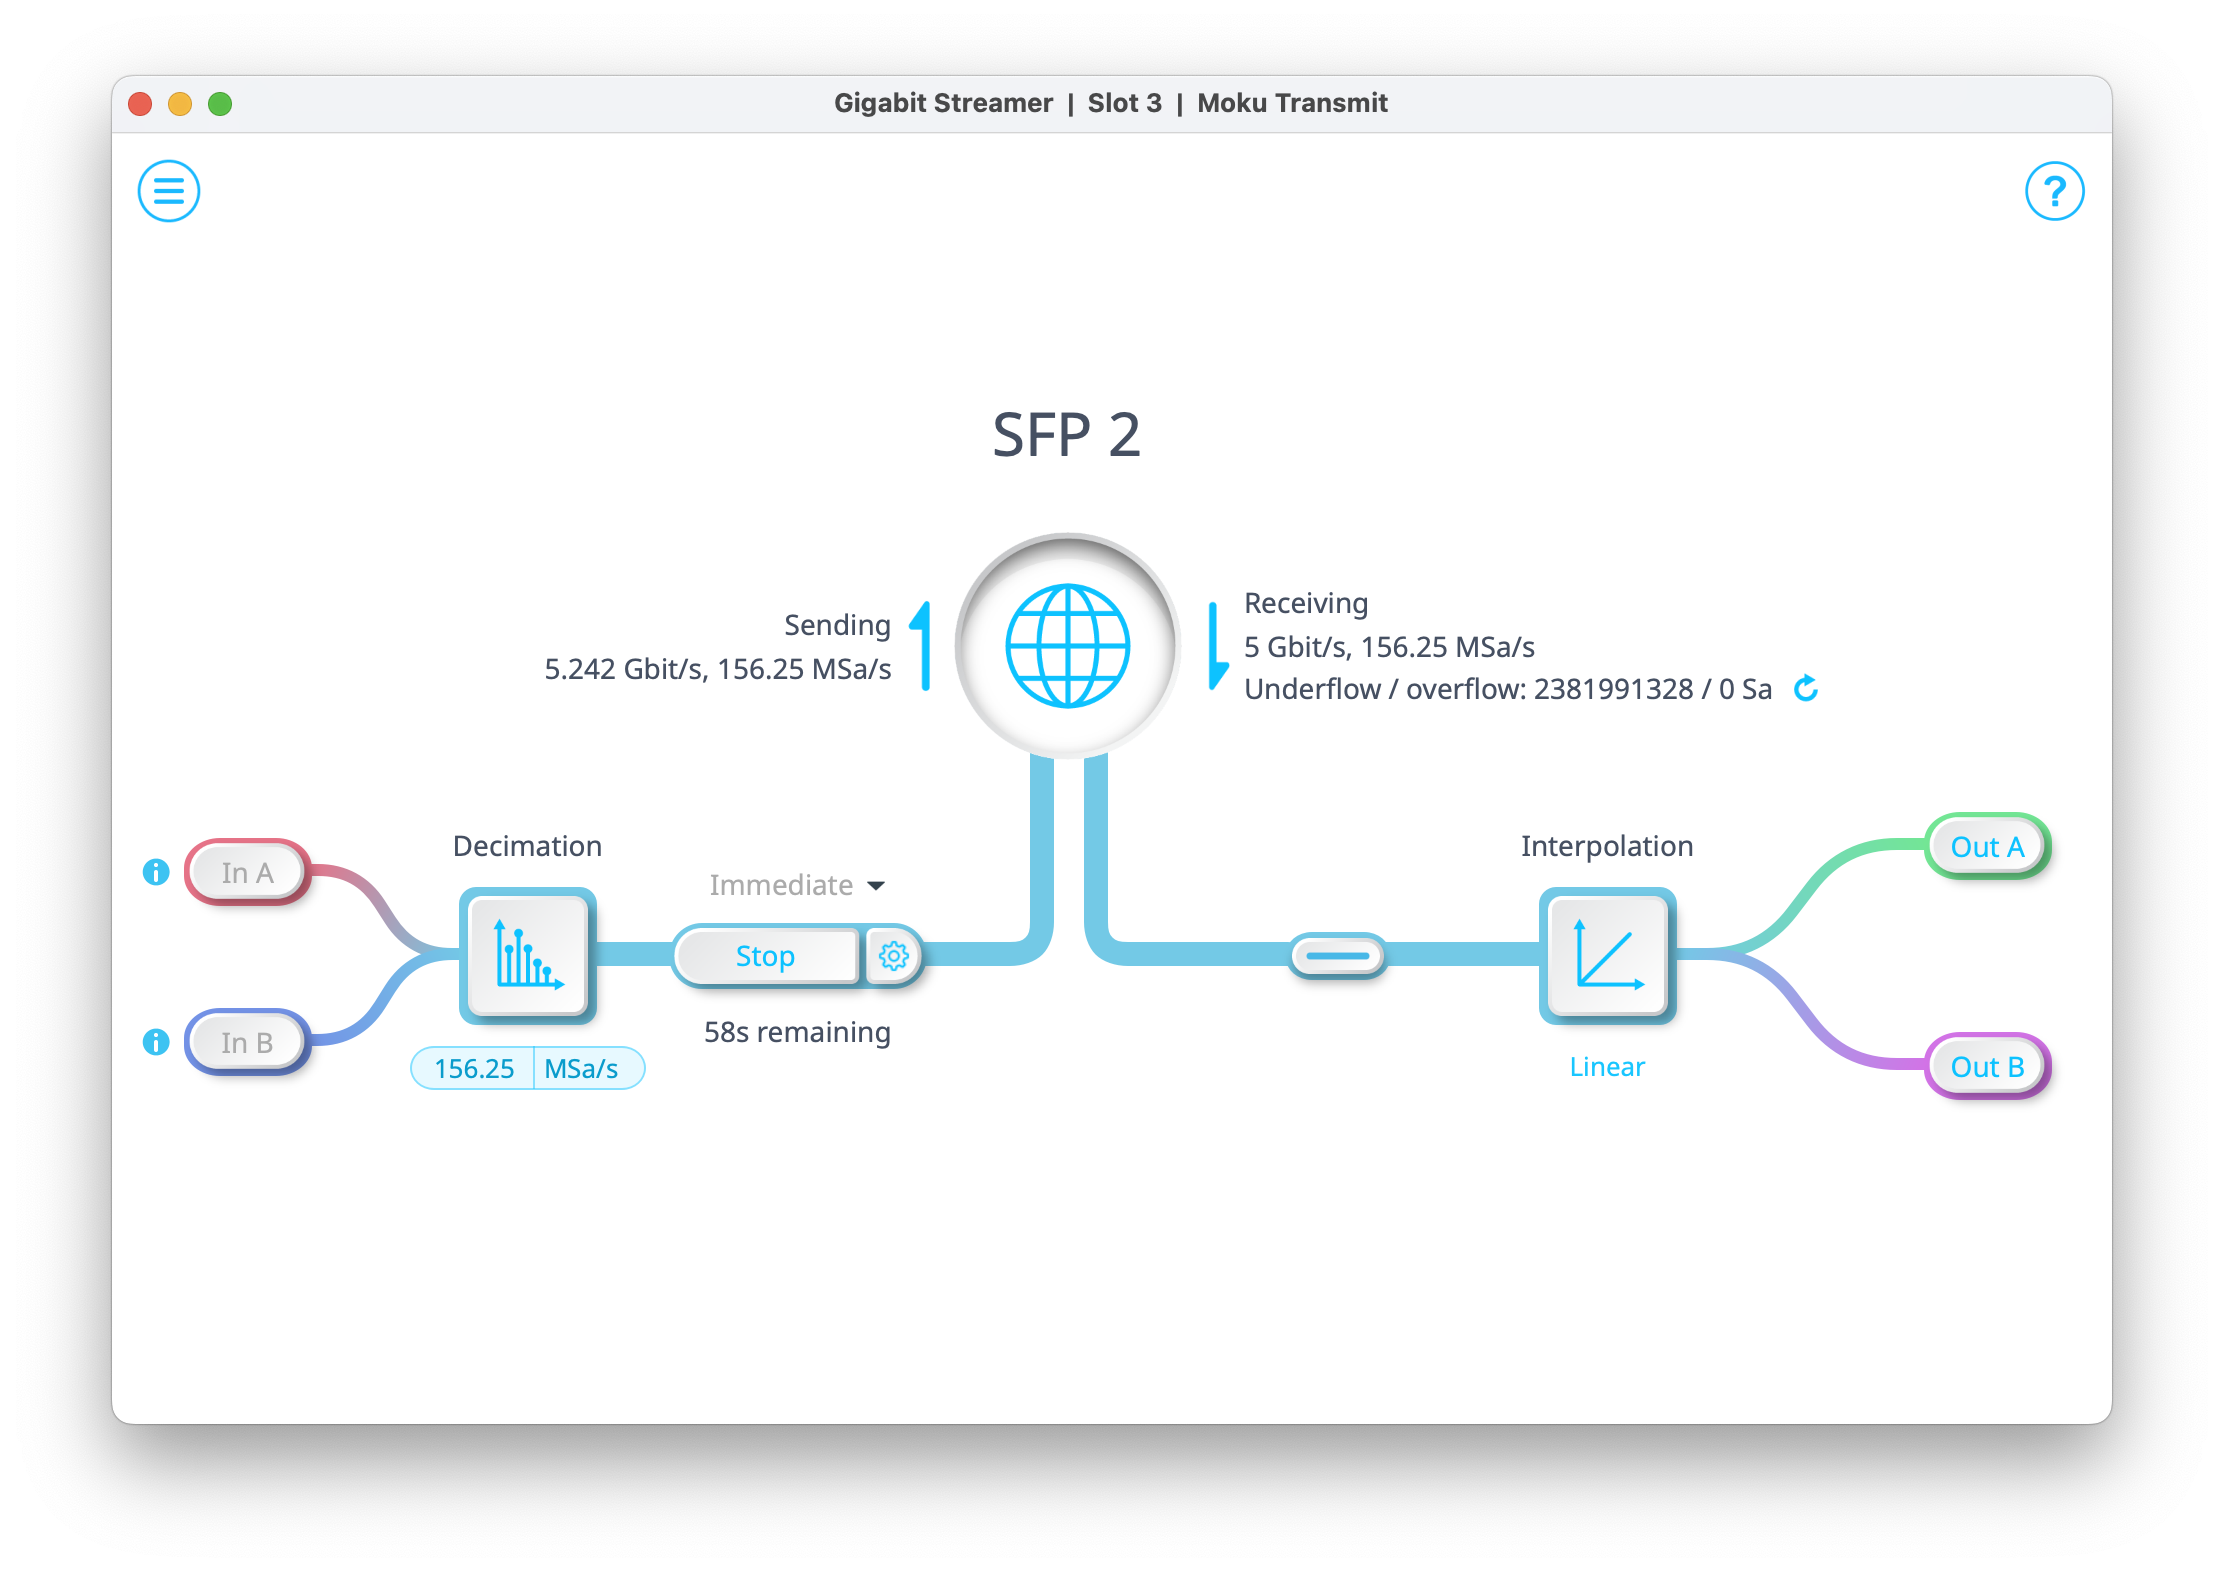
A concise guide to configuring direct sample streaming between two Moku:Delta devices using the Gigabit Streamer, including instrument placement, SFP connections, routing, and essential network parameters for reliable real-time operation.
Featuring: Moku:Delta, Gigabit Streamer

In this application note, we give an overview of the second-order correlation function and its physical meaning. We then discuss how to set up and collect the requisite data using the Moku Time & Frequency Analyzer, as well as use the built-in correlation calculator. Finally, we demonstrate two different methods for calculating the function and show that they agree well with each other.
Featuring: Moku:Pro, Time & Frequency Analyzer
