In this series, we provide a practical reference for designing and debugging loops by presenting a short introduction to feedback control as encountered in the frequency domain.
Part 3: Stability and delays
3.1 Introduction
We are now familiar with the fundamental properties of feedback control loops from the previous parts of this series, having discussed them in Part 2. We now broach a subject which has a tendency to confound those new to the field: stability. Fortunately, operation in the frequency domain allows for a relatively simple treatment of this topic.
Part 1 establishes the definition of a transfer function and provides the components from which one can construct control loop block diagrams to model elaborate systems. In Part 2 we demonstrate how feedback control systems can be used to suppress disturbances or track a process set point. The complications associated with noisy sensors are also discussed. Unlike open-loop systems, devices under feedback control have the potential to become unstable and there is tension between performance and robustness. Ultimately, delays in signal propagation can impose the most stringent limit. These issues are treated here in Part 3. In the frequency domain, most parameters of a feedback system can be linked to its open-loop transfer function. In Part 4 we explain how to measure this important quantity and provide a list of functions often used in shaping it. Part 5 describes one method of avoiding actuator saturation and, in doing so, introduces ideas useful to the treatment of multiple actuators. Our series concludes in Part 6 with the study of the PID controller. This common control architecture is generally considered from a time-domain point-of-view; we illustrate the complementary frequency-domain representation.
3.2 Stability
We note that all the transfer functions derived so far possess a denominator of 1 + G, where G is the open-loop transfer function. Hence, if G = −1 the system will become unstable with unbounded output. Indeed, even approaching the −1 point will lead to ringing and gain peaking (see Figure 3.2).
We thus define gain and phase margins to quantify how ‘far’ we are from this point of instability.
Gain margin: Let \(omega_{180}\) be the frequency at which ∠G = −180°. The gain margin, GM is then defined as
\(GM = frac{1}{left| G(iomega_{180})right|}\) or \(GM[dB] = -20 log_{10} left( left| G(iomega_{180})right| right)\).
In general, the gain margin tells us how much the gain can be increased/decreased before we hit the G = −1 point. In this context, gain changes due to factors such as process efficiency or alignment are just as, if not more, important than user-initiated changes.
Phase margin: Recall that \(omega_{UGF}\) is the frequency at which |G| = 1. The phase margin PM is defined as
\(PM = 180^{circ} + angle G(i omega_{UGF})\).
The phase margin describes how much additional phase delay we can tolerate before we reach instability.
We have formulated these margins assuming a phase lag, as is normally the case. Should the open-loop transfer function exhibit a phase lead, we would construct margins focusing on ∠G = +180◦ points, where G = −1 is achievable.
To ensure stability we must have a positive phase margin, \(left| angle G(i omega_{UGF}) right| < 180^{circ}\), and a system which was open-loop stable to begin with.
More formally, instability occurs if 1 + G(s) contains right-half-plane zeros. A rigorous treatment also reveals that instability is possible even if we do not reach G = −1. The above rules cover this eventuality for most systems (i.e. minimum phase systems).
It is also not uncommon for a system to exhibit multiple margins of either type. Each one should be considered individually when evaluating closed loop stability. Figure 3.1 shows a typical open-loop frequency response annotated with gain and phase margins.
In this part of the series our primary focus was on stability. We emphasize that stability is not the same as robustness. To realize a robust system, both PM and GM should be as large as possible. Unfortunately, large margins tend to reduce absolute performance and the designer must make informed trade-offs (see Figure 3.2).
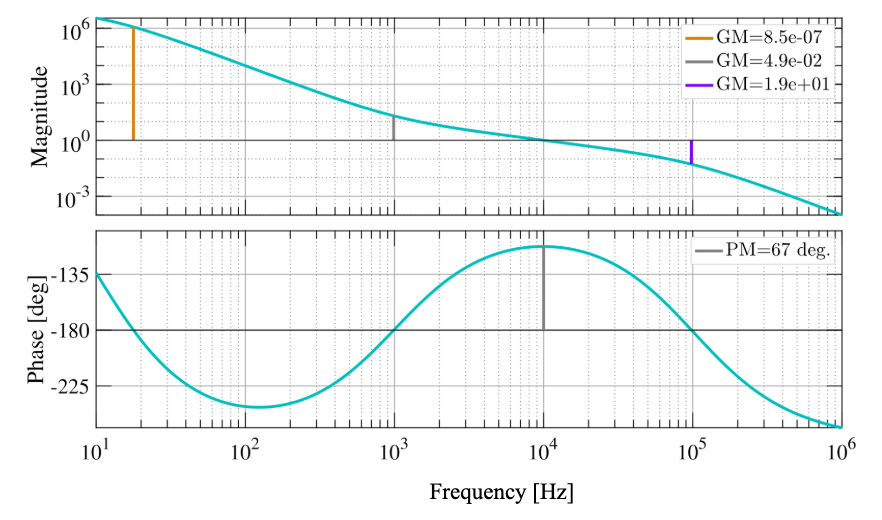
Figure 3.1: Gain and phase margins of a typical open-loop transfer function. This system has multiple gain margins and can become unstable when gain is increased or decreased. Such a system is termed conditionally stable. Care must be taken when acquiring lock if the system is conditionally stable. Gradually increasing gain to arrive at the desired operating point will not work.

Figure 3.2: Top: Two open-loop transfer functions. The first has a unity gain of 1 kHz; the second 5 kHz, realized by a simple increase in overall gain. Bottom: The corresponding 1/(1+G) transfer functions (relevant for disturbance rejection, see (2.1)). Observe that increasing gain improves low frequency performance. However, around unity gain the disturbance is actually amplified. This phenomenon is known as gain peaking. Gain peaking increases as phase margin is reduced. See also Figure 3.4 (Appendix A).
Rules of thumb:
- The slope of the OLTF at unity gain should be 1/f
- Gain margin should be greater than 2 or less than 0.5
- Phase margin should be > 30° for disturbance rejection and > 45° for reference tracking
3.3 Delays
Any delays in a feedback loop will impact stability. Delays can arise due to digital processing or can be inherent to the plant -think of a shower which is too cold and then suddenly too hot. The transfer function of a delay τ in the Laplace domain is
\(H_{delay}(tau, s) = e^{-s tau}\).
Such a delay will reduce phase margin by an amount \(omega_{UGF} tau\). Figure 3.3 graphs the transfer function of a delay and its effect on a typical OLTF.
Delays often limit ultimate loop performance as they are an integral part of the system to be stabilized and cannot be eliminated.

Figure 3.3: Top: The frequency response of a delay (in this case 10 µs). The magnitude is equal to one at all frequencies and the phase angle is −ωτ. Bottom: A typical OLTF with (blue solid) and without (orange dashed) inclusion of the above delay. Delays reduce phase margin and limit design freedom.
3.4 Summary
In this volume of our series we have deployed metrics quantifying how ‘far’ a system is from instability and have observed that loops can amplify a disturbance via gain peaking, particularly in the presence of unavoidable delays. In most cases, performance and stability place opposing demands on the design of a feedback control loop. The real art of loop design is in tuning the shape of the controller to simultaneously balance the various constraints. This ‘loop shaping’ will be covered next, in Part 4 of our series.
Appendix A: Step responses of the systems of Figure 3.2

Figure 3.4: The temporal responses of the two systems described in Figure 3.2 to a unit step in set point. Smaller phase margins lead to greater overshoot and more oscillatory behavior. As our current treatment is centered on frequency-domain techniques, this plot has been relegated to an appendix. Nevertheless, we hope that its inclusion emphasizes the importance and complementarity of both domains.
