In this series, we provide a practical reference for designing and debugging loops by presenting a short introduction to feedback control as encountered in the frequency domain.
6.1 Introduction
PID controllers are featured in many devices, including the Moku family. Moku offers a standalone PID Controller, as well as integrated PID controllers as part of its Laser Lock Box and Lock-in Amplifier. This final part of our series presents two equivalent frequency-domain models of the Moku PID framework, allowing users to model their control loops in external software.
Part 1 establishes the definition of a transfer function and provides the components from which one can construct control loop block diagrams to model elaborate systems. In Part 2 we demonstrate how feedback control systems can be used to suppress disturbances or track a process set point. The complications associated with noisy sensors are also discussed. Unlike open-loop systems, devices under feedback control have the potential to become unstable and there is tension between performance and robustness. Ultimately, delays in signal propagation can impose the most stringent limit. These issues are treated in Part 3. In the frequency domain, most parameters of a feedback system can be linked to its open-loop transfer function. In Part 4 we explain how to measure this important quantity and provide a list of functions often used in shaping it. Part 5 describes one method of avoiding actuator saturation and, in doing so, introduces ideas useful to the treatment of multiple actuators. Our series concludes here in Part 6 with the study of the PID controller. This common control architecture is generally considered from a time-domain point-of-view; we illustrate the complementary frequency-domain representation.
6.2 Transfer function
The PID controller’s output can be described as the weighted sum of independent paths – proportional, integral, double integral and derivative. This yields a transfer function, H(s), of form
\(P + frac{K_I}{s} + frac{K_{I+}}{s^2} + K_Ds\)
or including saturation terms,
\(H(s) = P + frac{K_I}{s} frac{s}{(s-p_{IS})} + frac{K_{I+}}{s^2} frac{s^2}{(s-p_{IS})^2} + K_Ds frac{-p_{DS}}{(s-p_{DS})}\)
\(= P + frac{K_I}{(s-p_{IS})} + frac{K_{I+}}{(s-p_{IS})^2} + K_Dsfrac{-p_{DS}}{(s-p_{DS})}\) (6.1)
The frequency response may be obtained from this expression via the substitution s = iω, where i is the imaginary unit and ω the angular frequency. A subset of the available features may be modelled by eliminating unnecessary terms.
Table 6.1 describes how model parameters are related to the values supplied to our instruments.
Table 6.1: Model parameters. Those configured in the Moku instrument software are listed in the first part of the table; derived parameters follow.
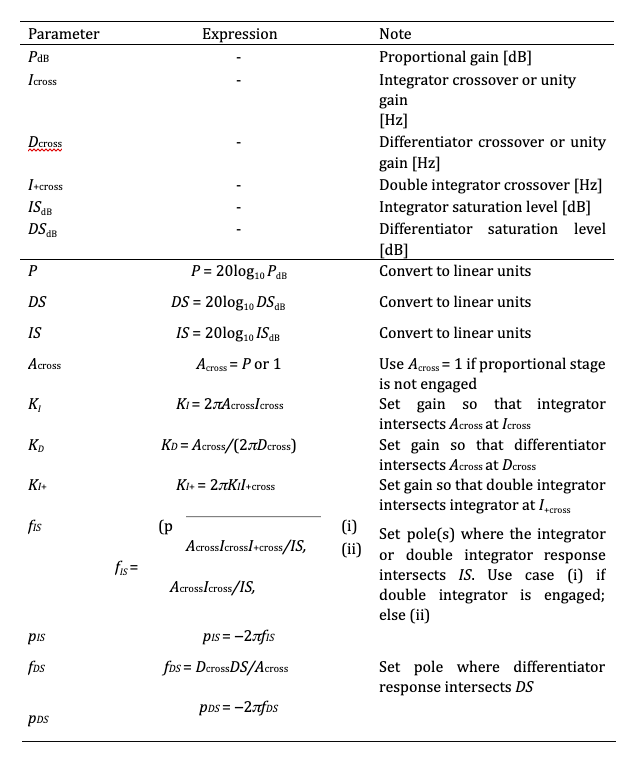
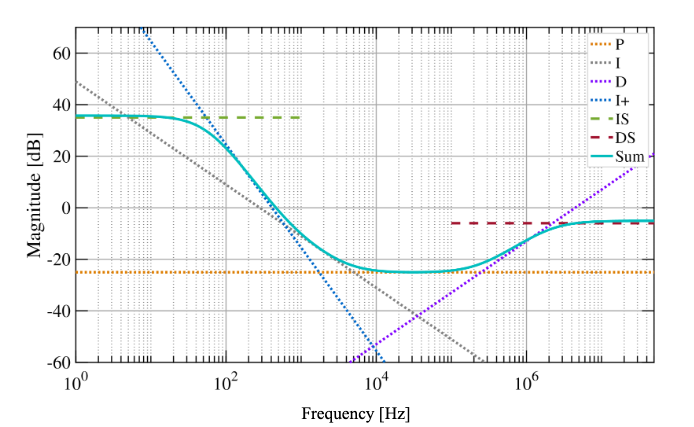
Figure 6.1: The sum of all enabled stages (dotted lines) gives the overall controller response (solid line). Integrator and differentiator saturation levels are indicated using dashed lines. User-defined parameters define the relative magnitude of the various contributions.
Figure 6.1 illustrates how the total response is given by the sum of the contributing paths.
6.3 Zero, pole, gain
An alternative approach is to describe the response in terms of its zeros, poles, and overall gain, i.e. in the form
\(H(s) = K frac{(s-z_1)(s-z_2)ldots(s-z_N)}{(s-p_1)(s-p_2)ldots(s-p_N)}.\) (6.2)
Such a description may be realized through expansion and simplification of Equation (6.1). In the general case we find that
\(H(s) = (P-K_Dp_{DS})frac{(s-z_1)(s-z_2)(s-z_3)}{(s-p_{IS})^2(s-p_{DS})},\) (6.3)
where the zeros are given by the roots of the equation
\((P-K_Dp_{DS})s^3+\)
\((2K_Dp_{IS}p_{DS} + K_I – Pp_{DS} – 2Pp_{IS})s^2+ % s^2\)
\((-K_Dp_{IS}^2p_{DS} – K_Ip_{DS} – K_Ip_{IS} + K_{IP} + 2Pp_{DS}p_{IS} + Pp_{IS}^2)s+\)
\((K_Ip_{DS}p_{IS} – K_{IP}p_{DS} – Pp_{DS}p_{IS}^2)=0.\) (6.4)
As analytical methods are somewhat unwieldy, we solve this equation numerically.
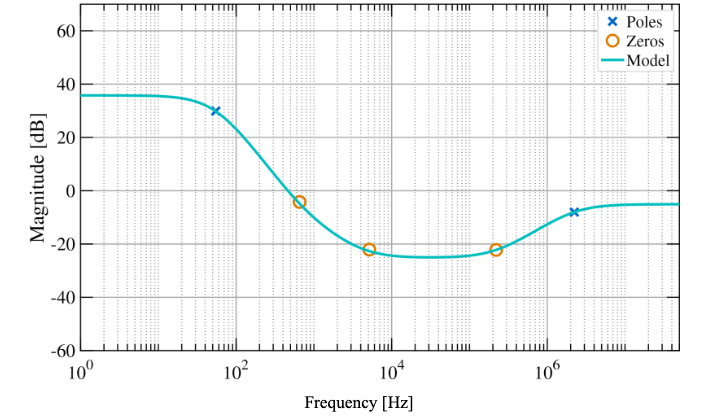
Figure 6.2: Controller response with the frequencies of poles and zeros marked. Note that the pole near 50 Hz has a multiplicity of 2.
Figure 6.2 demonstrates how the response shown in Figure 6.1 can be characterized in terms of poles and zeros rather than summed paths.
6.4 Comparison with measured data
Figure 6.3 compares our model to measured data taken using the Laser Lock Box of a Moku:Pro. Acceptable agreement is observed across the frequency range of interest.
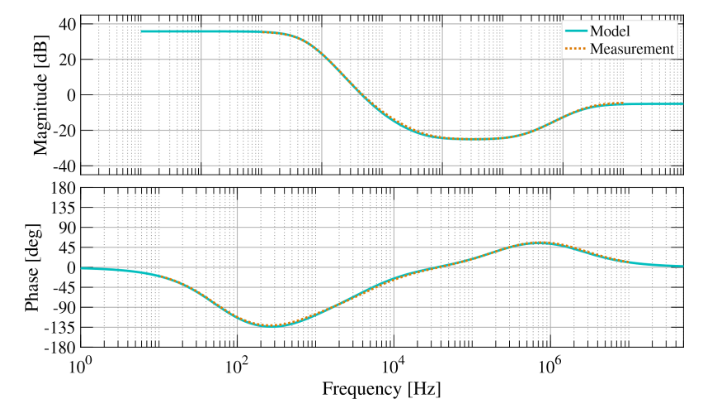
Figure 6.3: Comparison between model and measured data. Agreement is found to be within 1 dB/3◦ at worst (as shown) and more commonly an order of magnitude better.
6.5 A more accurate model
For numerical reasons, the PID controller is not implemented as a pure sum of terms, as expounded above (see (6.1)), but rather as a product of the form (P + I + D) × (P + I), where P, I and D correspond to proportional, integral and derivative terms. In addition to yielding the double-integrator I × I term we also realize two other cross terms which must be added to our model, via
\(H^{prime}(s) = frac{1}{P}timesleft(P + frac{K_I}{(s-p_{IS})} + K_Dsfrac{-p_{DS}}{(s-p_{DS})}right)timesleft(P + frac{P}{K_I}frac{K_{I+}}{(s-p_{IS})}right)\)
\(=H(s) + Pfrac{K_{I+}/K_I}{(s-p_{IS})}+K_Dsfrac{-p_{ds}}{(s-p_{DS})}frac{K_{I+}/K_I}{(s-p_{IS})}.\)
In terms of our pole-zero-gain model, only the zeros need be modified. We add the following terms to the LHS of (6.4)
\((PK_{I+}/K_I – K_Dp_{DS}K_{I+}/K_I)s^2+\ % s^2\)
\((K_Dp_{DS}p_IK_{I+}/K_I – Pp_{DS}K_{I+}/K_I – Pp_IK_{I+}/K_I)s+\)
\(( Pp_{DS}p_{I}K_{I+}/K_I).\)
The additional terms are only active if the I+ double-integrator stage is engaged and are generally insignificant at the level of accuracy needed in the typical model.
6.6 Summary and conclusion
In this installment of our series we have presented a frequency-domain model of the PID Controller found in Moku instruments. Typically described via its time-domain behavior, this example nicely highlights the complementarity of the two domains. It is intended that this model be implemented in floating-point software (MATLAB, Python, etc.) to assist users in the design and analysis of their experiments. The model agrees well with measured data. However, in cases where greatest accuracy is required, we recommend characterizing system response directly using our Frequency Response Analyzer.
In this series as a whole we have provided a basic foundation in frequency-domain control. Starting from the definition of a transfer function, we constructed feedback control loops using block diagrams and demonstrated how signals propagated around the loop in the steady state. This work led to ideas of disturbance rejection, set point tracking and stability. We concluded by briefly discussing the interplay between these concepts when shaping the open-loop transfer function. Throughout this work we have striven to keep mathematical details to a minimum, particularly in matters relating to stability. Readers seeking greater detail and rigor will be well-served by the literature cited below.
References
A. Abramovici and J. Chapsky, Feedback control systems. Dordrecht, Netherlands: Springer, Sep. 2000.
K. Ogata, Modern Control Engineering, 5th ed. Upper Saddle River, NJ: Pearson, Aug. 2009.
