Moku:Go combines 15+ lab instruments in one high-performance device. This application note uses Moku:Go’s Oscilloscope and its integrated waveform generator to investigate the forward bias behavior of a diode.
Moku:Go
 Moku:Go combines 15+ lab instruments in one high performance device, with 2 analog inputs, 2 analog outputs, 16 digital I/O pins and optional integrated power supplies.
Diode P-N Junction
The diode is the simplest and most basic semiconductor device consisting of a single P-N junction. Since P-N junctions are the fundamental functional feature of many semiconductors, a strong foundational knowledge of the behavior of diodes is crucial to successful learning in more advanced lab experiments on transistors and other semiconductors.
I-V curve characterization is a fundamental measurement and common lab experiment to aid in the understanding of semiconductor junctions. I-V curves are plots of current as a function of voltage. For a resistor, the I-V curve would simply be a straight line through 0 volts, and 0 amps. While dedicated I-V curve instruments exist, and some implementations use Source-Measure Units (SMUs) with appropriate software, these solutions require bulky and expensive, traditional stand-alone equipment. Here we show a diode I-V measurement using Moku:Go’s Oscilloscope and its built-in waveform generator. The captured data is shared to Excel (or alternatively MATLAB) to enable the student to manipulate the captured data and present an I-V curve for an IN4001 diode. Thus the experiment can be done with Moku:Go and no other instruments.
Experimental setup
To plot an I-V curve for an IN4001 diode we have set up the circuit in Figure 1.

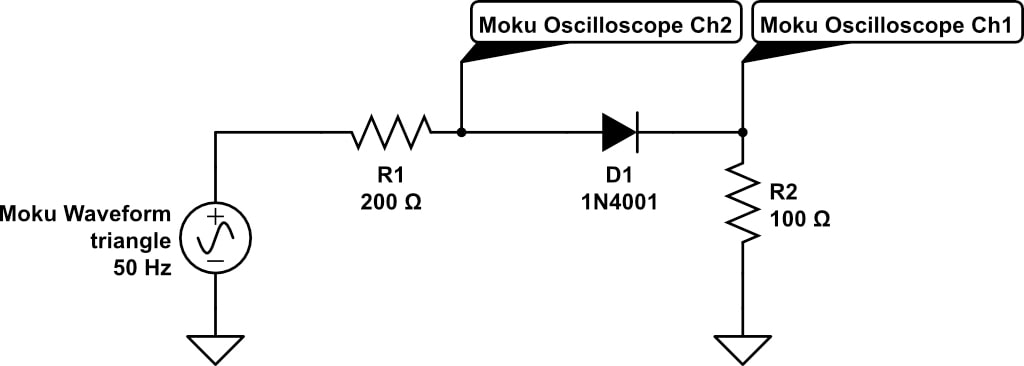
Figure 1: forward bias diode circuit
R1 represents the output impedance of the waveform generator. Moku:Go’s Oscilloscope channel 2 is used to measure the voltage applied across both the diode and a current limiting & sensing resistor (R2). Then the Oscilloscope channel 1 measures the voltage across R2, a 1% tolerance 100 Ω resistor, allowing us to calculate the current through the diode.
There is a waveform generator integrated into Moku:Go’s Oscilloscope instrument. This is used to generate a triangle wave set to an amplitude of 3.2 V with a 1.6 V DC offset. Thus, the diode is always forward biased and allows us to apply a swept voltage, frequency set at a low, not important 50 Hz. Figure 2 shows the waveform generator set up in the macOS app. Notice we only use waveform generator channel 1 (green); channel 2 (purple) is off. The Windows app is very similar.
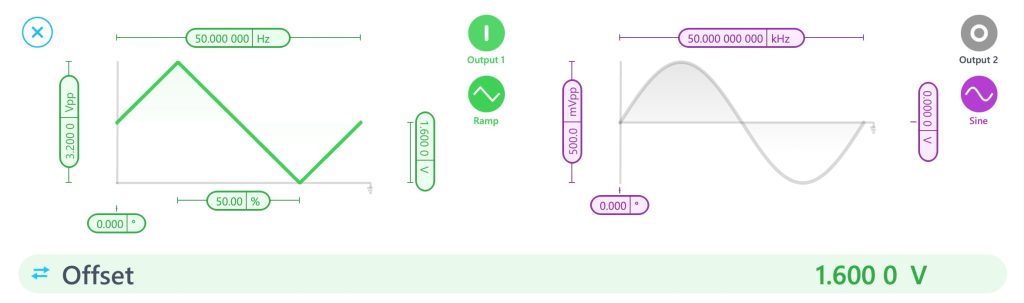

Figure 2: Moku:Go’s waveform generator configured to sweep voltage
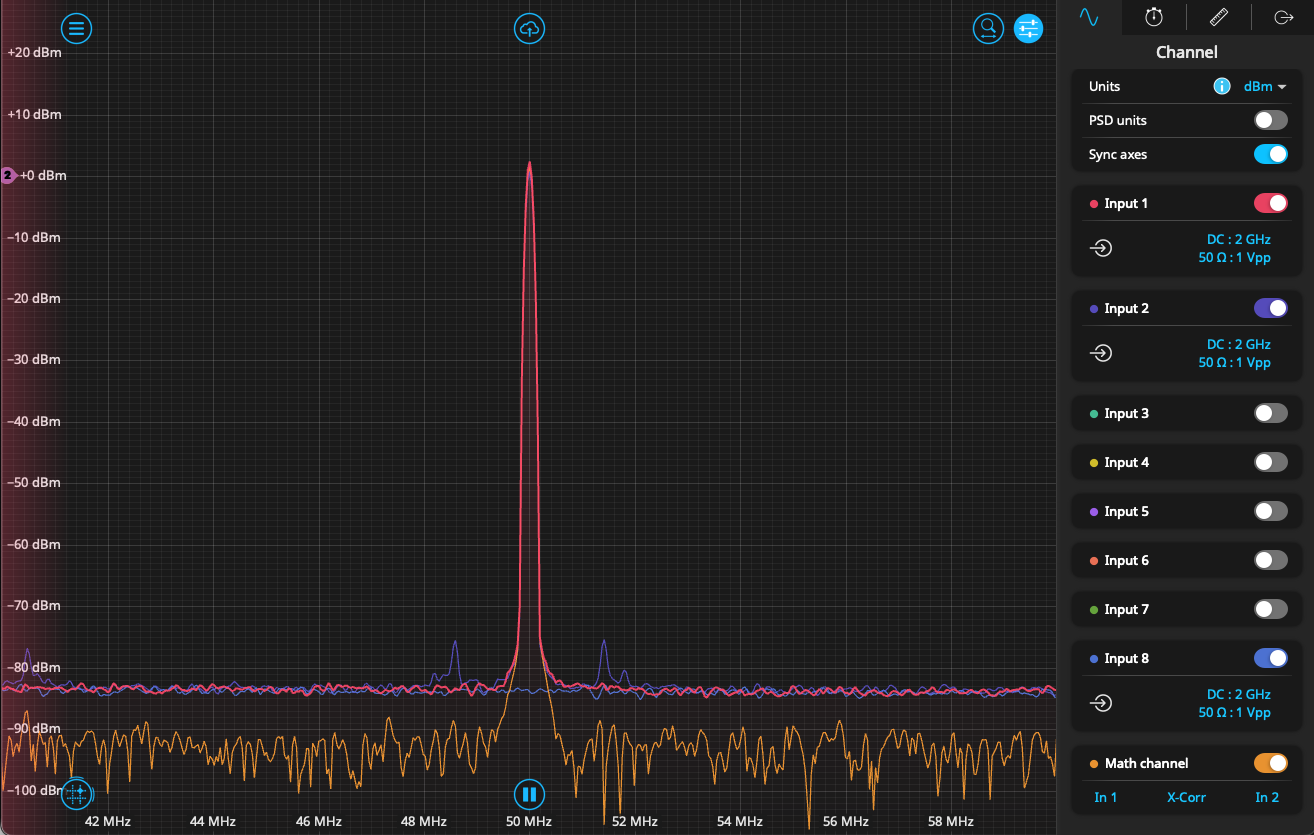
We can now use Moku:Go’s Oscilloscope to observe the voltage on channel 1 and channel 2 (refer to Figure 1 for the channel probe points). Figure 3 shows the Oscilloscope, channel A (input 1) in red, channel B (input 2) in blue and the behavior of the diode is evident.
We have also used the oscilloscope math channel to plot the X-Y curve in orange and this shows the general expected I-V curve of a diode.
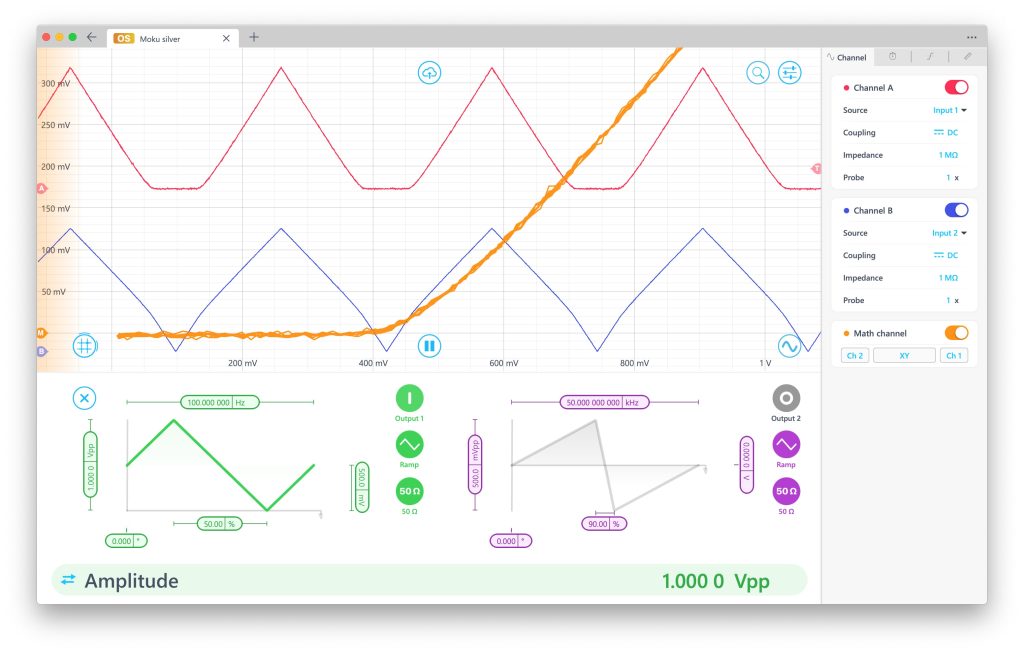
Figure 3: Moku:Go’s Oscilloscope, X-Y Channel and integrated waveform generator
Referring to the circuit in Figure 1; we see that the current in the diode:
Idiode = (Vch1/100)
and that the corresponding
Vdiode = Vch2 – Vch1
Since Moku:Go is connected to the app via USB-C or the network, we can simply export the oscilloscope data to a CSV file, then calculate and plot Idiode vs Vdiode in Excel, MATLAB or similar.

Figure 4: exporting data to CSV
Resulting I-V plot
After importing the CSV from Moku:Go into Excel, Vdiode and Idiode is calculated and plotted. The resulting I-V plot for the IN4001 diode is shown in Figure 5 exhibiting a typical forward bias turn-on voltage; after which we see large increases in current.

Figure 5: measured I-V plot for forward biased IN4001 diode
Summary
We have used Moku:Go and its Oscilloscope and integrated waveform generator to investigate, measure, and record the I-V behavior of a diode. This was accomplished with a simple breadboard and one Moku:Go. No other lab equipment was needed to demonstrate this common electronic engineering lab experiment.
Benefits of Moku:Go
For the educator & lab assistants
- Efficient use of lab space and time
- Ease of consistent instrument configuration
- Focus on the electronics, not the instrument setup
- Maximize lab teaching assistant time
- Individual labs, individual learning
- Simplified evaluation and grading via screenshots
For the student
- Individual labs at their own pace enhance the understanding and retention
- Portable, choose pace, place and time for lab work be it home, on campus lab or even collaborate remotely
- Familiar Windows or macOS laptop environment, yet with professional-grade instruments
Moku:Go demo mode
You can download the Moku:Go app for macOS and Windows. The demo mode operates without the need for any hardware and provides a great overview of using Moku:Go
Have questions or want a printable version?
Please contact us at support@liquidinstruments.com