Introduction
When measuring real-world signals, noise is an unavoidable factor to consider. Noise comes in various forms, including white Gaussian noise, which maintains constant power across all frequencies. Given any noise background, the primary objective is to ensure that the signal of interest is significantly stronger than the surrounding noise. This relationship is quantified by the Signal-to-Noise ratio (SNR), a key metric that indicates how well a signal stands out against system noise.
SNR can be improved by decreasing the total noise power of a system, which is proportional to its noise floor and noise bandwidth, as shown in Equation 1. Assuming a narrow bandwidth, the single-sided noise power spectral density (PSD, denoted as \(N_0\)) is a measurement of the sum of all the noise sources, and is expected to be frequency independent. The noise bandwidth (\(BW_N\)) refers to the band of frequencies over which the noise floor contributes.
\(SNR = \frac{P_{signal}}{P_{noise}} = \frac{P_{signal}}{N_0 BW_N} \)
The Moku Oscilloscope offers Precision mode, an acquisition mode that decreases noise power with noise bandwidth. A previous application note discusses how this is useful for low frequency signals but poses an issue for higher frequency signals with narrow bands, where the Oscilloscope bandwidth has to be wide enough to measure the signal, increasing noise power in the measured data.
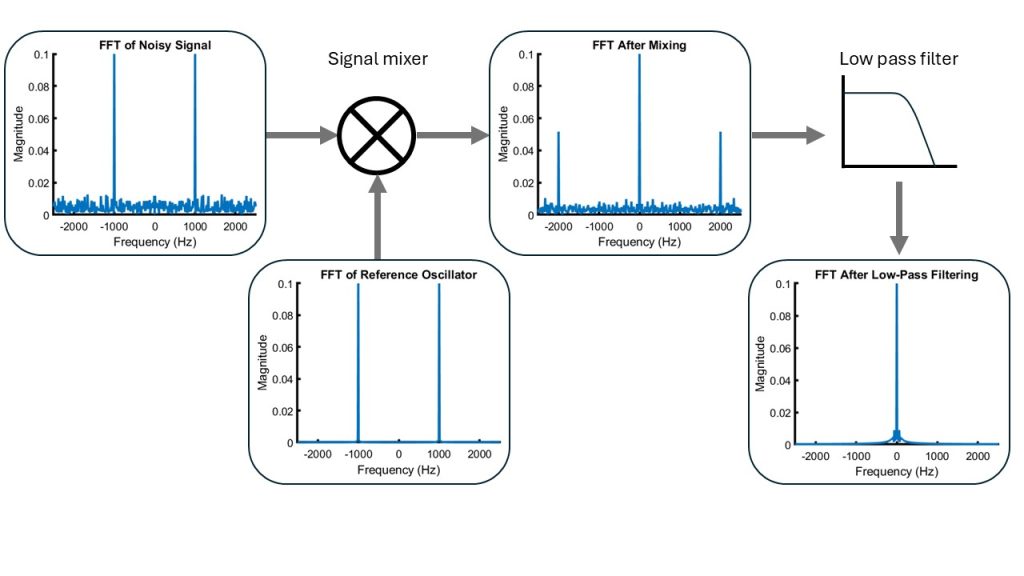
A solution to avoiding an increase in SNR from higher noise power at high frequencies, is to down convert the signal. Down conversion consists of mixing, or multiplying, your signal by an oscillator with the frequency of interest and then applying a low pass filter to filter out any unwanted high frequency components. Down conversion shifts the frequency band of interest. The Moku Lock-in Amplifier is a specialized down-converter that shifts the frequency band of interest, as shown in Figure 1. The Lock-in Amplifier lowpass filter constrains the noise bandwidth and, consequently, limits noise power to increase SNR, as visually noted on the Lock-in Amplifier output plot on the right side of Figure 1. This SNR improvement technique is useful for applications such as spectroscopy, materials characterization, and laser stabilization, where signals need to be extracted from noise. In this application note, we use a Moku:Pro Lock-in Amplifier with an extremely narrow low pass filter to measure signals with µV amplitudes.
Experimental setup
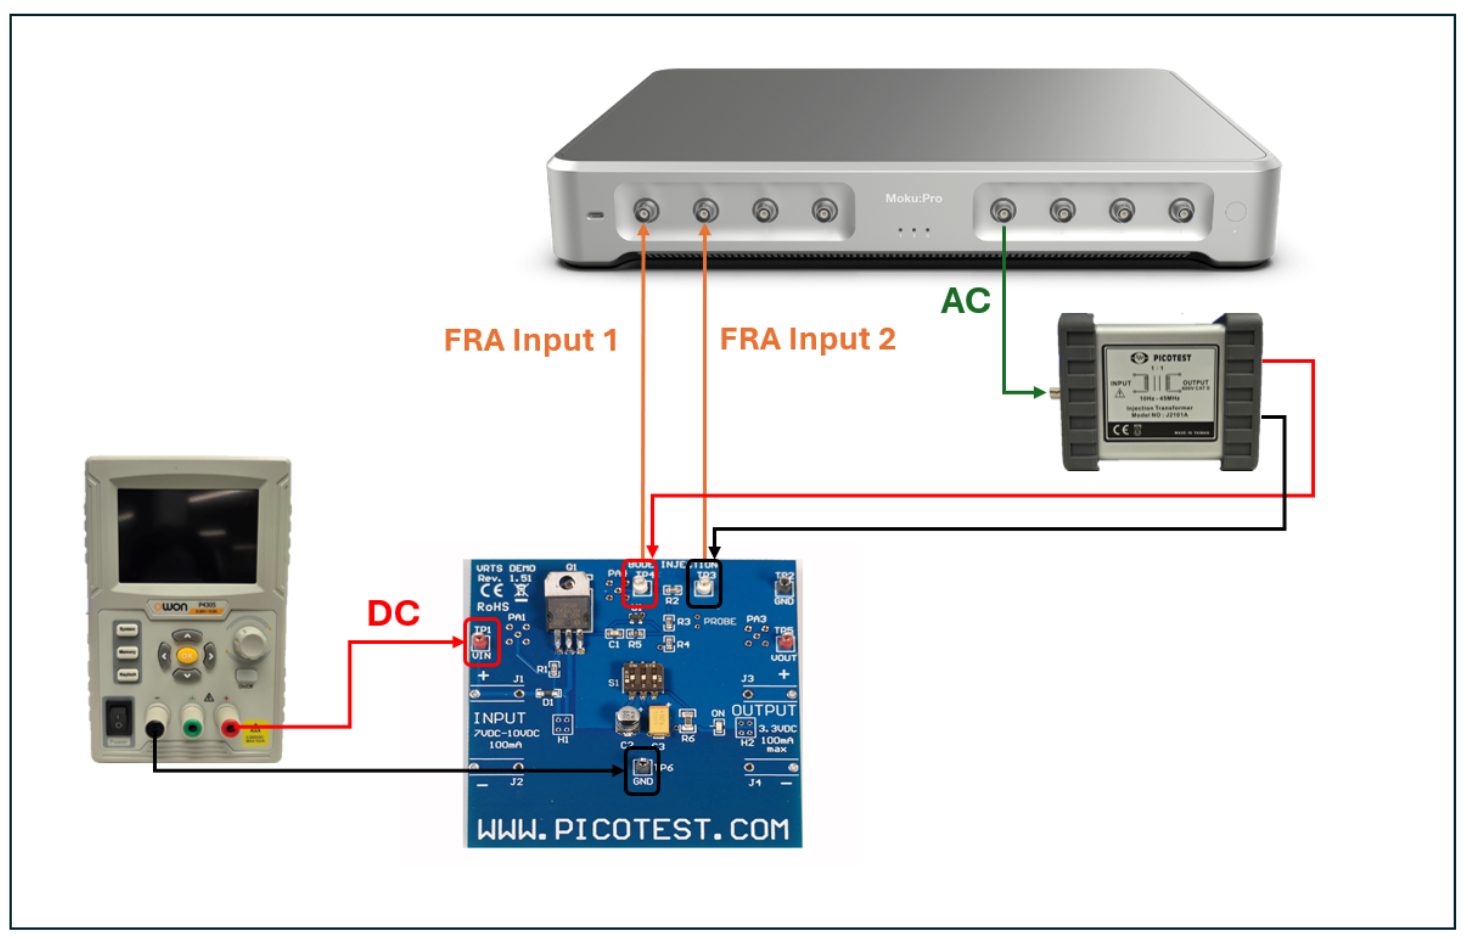
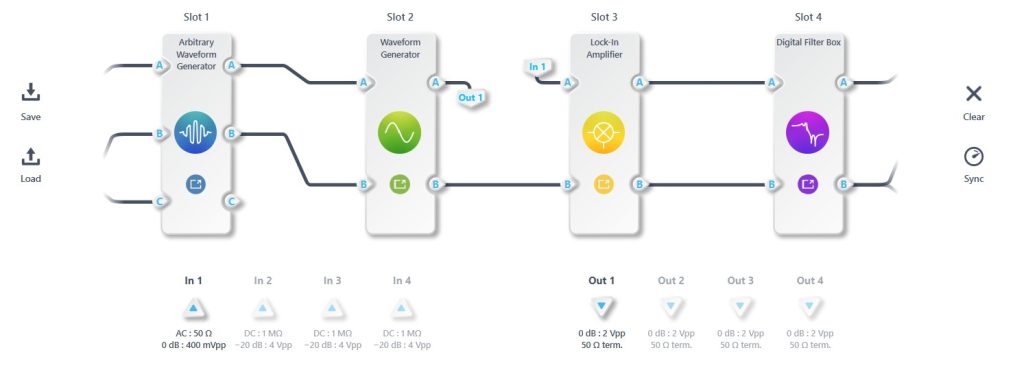
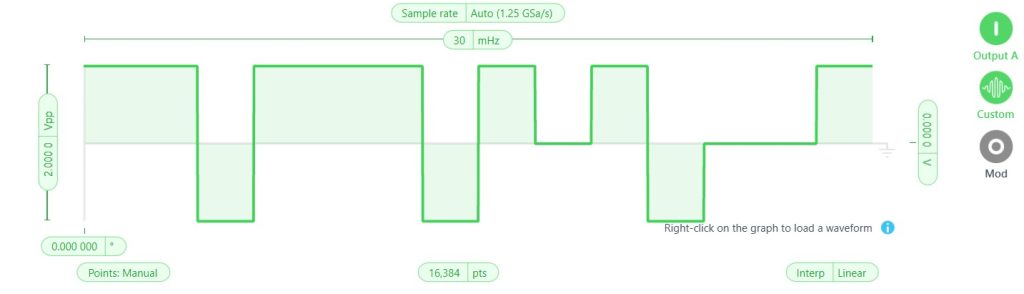
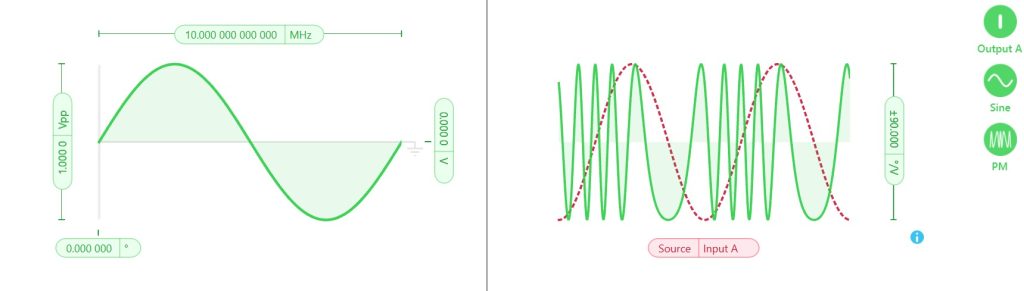
Using Multi-Instrument Mode (Figure 2), an Arbitrary Waveform Generator and Waveform Generator were used in the first two slots to generate a phase-modulated signal. As shown in Figure 3, the Arbitrary Waveform Generator generated a step function that represents a series of symbols in Morse code: voltage levels of -1, 0, and 1 represent spaces, dots, and dashes, respectively. The full message, spelling “Moku,” was sent from the Arbitrary Waveform Generator into the Waveform Generator with a frequency of 30 mHz. The Waveform Generator had a 2 Vpp 10 MHz carrier signal that modulated its phase proportionally to the step function at a rate of +/- 90 degrees/V (Figure 4).
The phase modulated signal was routed through 4-6 cascaded 20 dB external attenuators and fed back into input 1 of the Moku:Pro. The Waveform Generator amplitude ranged from 250 mVpp to 1 Vpp, resulting in input signal amplitudes to the LIA between 250 nVpp and 100 µVpp.
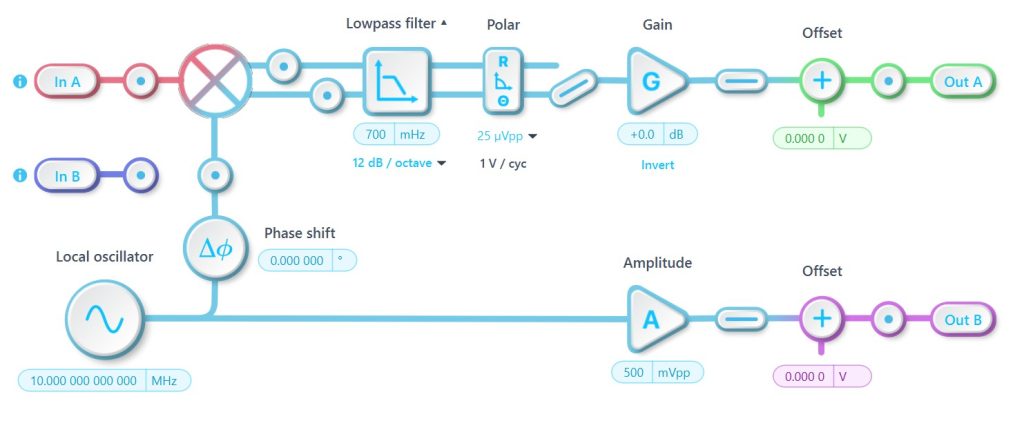
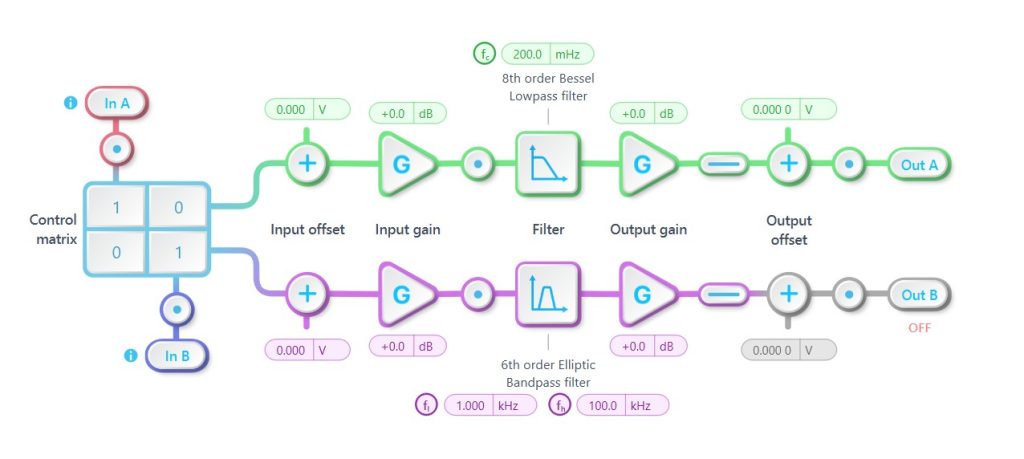
The Lock-in Amplifier was configured to mix the input signal with a 10 MHz local oscillator, as shown in Figure 5. The low pass filter was set with the minimum possible cutoff frequency (700 mHz). The output was set to “Θ”, which is the signal phase. The demodulated output of the Lock-in Amplifier was sent into the Digital Filter Box, where a 200 mHz 8th order lowpass Bessel filter was applied (Figure 6), to further denoise the signal. The Digital Filter Box output was recorded for 400 seconds per measurement, to ensure at least 10 message cycles were recorded. The Lock-in Amplifier configuration can be seen below in Figure 5. All device setup and measurements were carried out with the Moku Application Programming Interface (API). The Python API script can be downloaded here.
Results
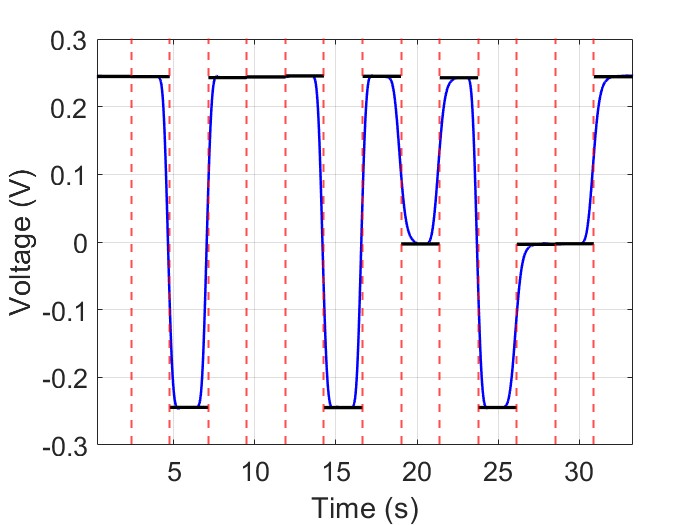
Using a MATLAB post-processing script, which can be downloaded here, a single period of the output was plotted and divided equally into 14 time-segments, corresponding to the 14 Morse characters shown in the Arbitrary Waveform Generator equation editor (a-n) in Figure 3. The resulting demodulated and filtered phase output was plotted for each input signal amplitude in Figure 7. The signal value at the midpoint time of each segment was measured as shown in Figure 8. Using threshold values, the following ranges were used to correspond to each Morse character: dash (voltage > 83.5 mV), dot (83.5 mV > voltage > -83.5 mV), space (voltage < -83.5 mV). These values were chosen based on the expected range of the demodulated output signal (0.5 Vpp). The top third values of this range were used for denoting dashes, the middle third for dots, and the bottom third for spaces. Using these threshold values and the Lock-in Amplifier output signal, the Morse code outputs: “– — -.- ..-” which translates to “Moku”.
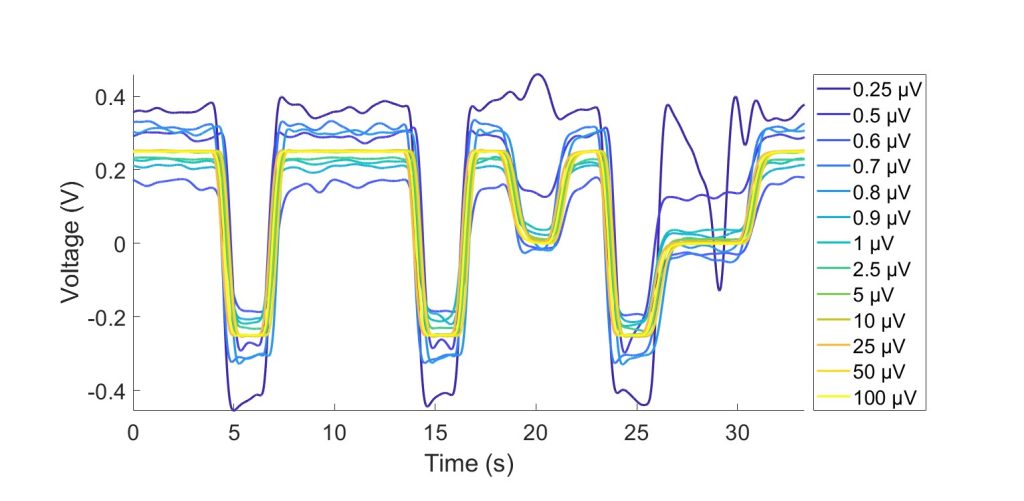
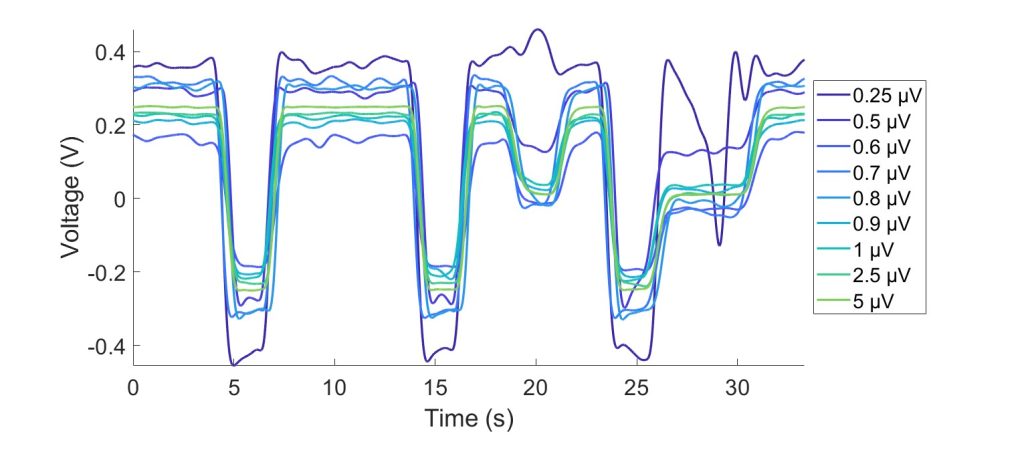
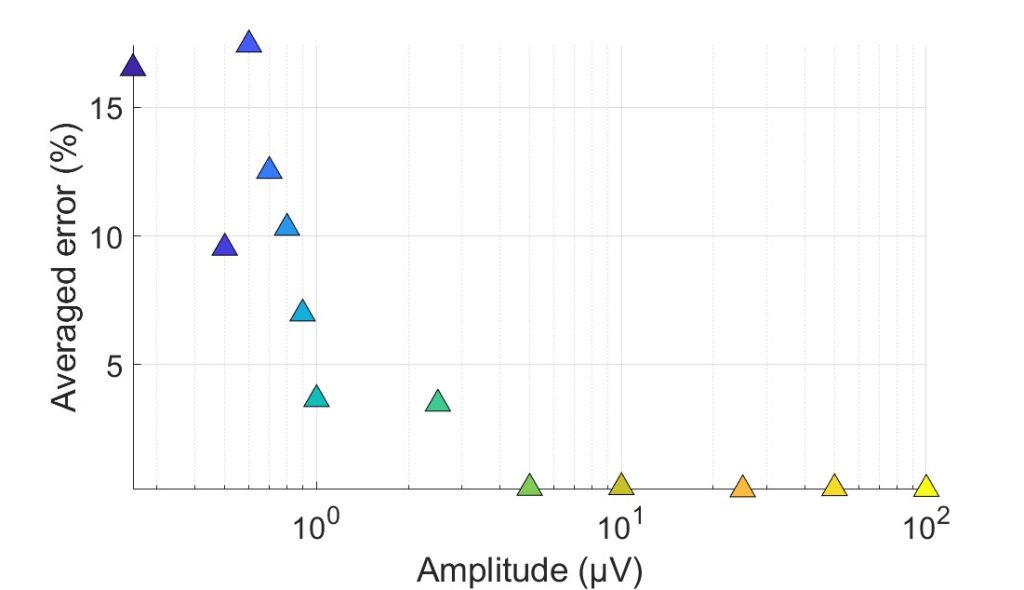
From Figures 7 and 9, it is apparent that input amplitudes < 5 µVpp have higher error (> 1%) in the measured midpoint values in each segment of the Morse message signal. The right plots in Figures 7 and 9 show a demodulated signal and averaged error across the midpoint values, respectively. The averaged error values in Figure 9 compare the midpoint values with the expected values (0.25 V for dash, 0 V for dot, and -0.25 V for space) across 10 different message cycles. When using the threshold values for each symbol mentioned above, nearly all input amplitudes were able to correctly output the Morse message “Moku”. The lower amplitudes (< 5 µVpp) had high noise levels and attenuation causing the midpoint values to be far off from the expected values.
Summary
In this application note, we demonstrated the Lock-in Amplifier’s ability to detect and decipher signals on the microvolt scale. Using a phase-modulated signal on the output of the Moku:Pro, the Lock-in Amplifier was able to recover the phase of the attenuated signal when the signal amplitude was as low as 250 nVpp. While the error of the segment midpoint values begins to increase with signal amplitudes < 5 µVpp, it is worth noting that only 1 point is being compared in each segment. As the 10 measurements for each amplitude were taken sequentially with 0 dead time in between measurements, the data processing technique to divide up the measurements could affect which value is selected as the midpoint. Additionally, the Bessel filter applied can cause sharp edges to soften, causing values closer to segment edges to deviate from the expected mean value. We also noted that ADC crosstalk between the inputs and outputs of the same device and the use of external attenuators can affect the signal on the input. Nonetheless, Moku:Pro was able to demodulate signals with amplitudes of several microvolts and accurately decipher encoded Morse characters. Moku:Pro’s high-bandwidth input analog resolution is ~0.4 mV, however we demonstrated that the Lock-in Amplifier can significantly reduce noise bandwidth with a low cut-off frequency and achieve a high enough resolution to detect signal amplitudes beyond this limit.