Power Supply Rejection Ratio
Power supply rejection ratio (PSRR) measures how well the output of a power delivery device can reject variations in its DC input voltage. PSRR is a critical performance metric for operational amplifiers and voltage regulators (low dropout (LDOs) and switching regulators), as it ensures output voltages remain stable and clean, even if the input has some disturbances. PSRR is measured by intentionally injecting a low amplitude AC signal (a ripple) onto a DC input signal and measuring the power of the ripple on the input and the output of the Device Under Test (DUT). The following equation shows the relationship between PSRR and the measured input and output ripple signals.
\(PSRR = 20 \times log\frac{V_{in}}{V_{out}}\)
The Moku Frequency Response Analyzer outputs a swept sinusoid across a range of frequencies and simultaneously measures the amplitude and phase of the inputs. The Frequency Response Analyzer allows users to look at the resulting magnitude and phase of their input signals on its own, relative to the output signal, or relative to another input signal. In this application note, the Frequency Response Analyzer will be used to output a sinusoidal disturbance onto the DC input of a voltage regulator and measure the transfer function of the regulator input voltage relative to its output.
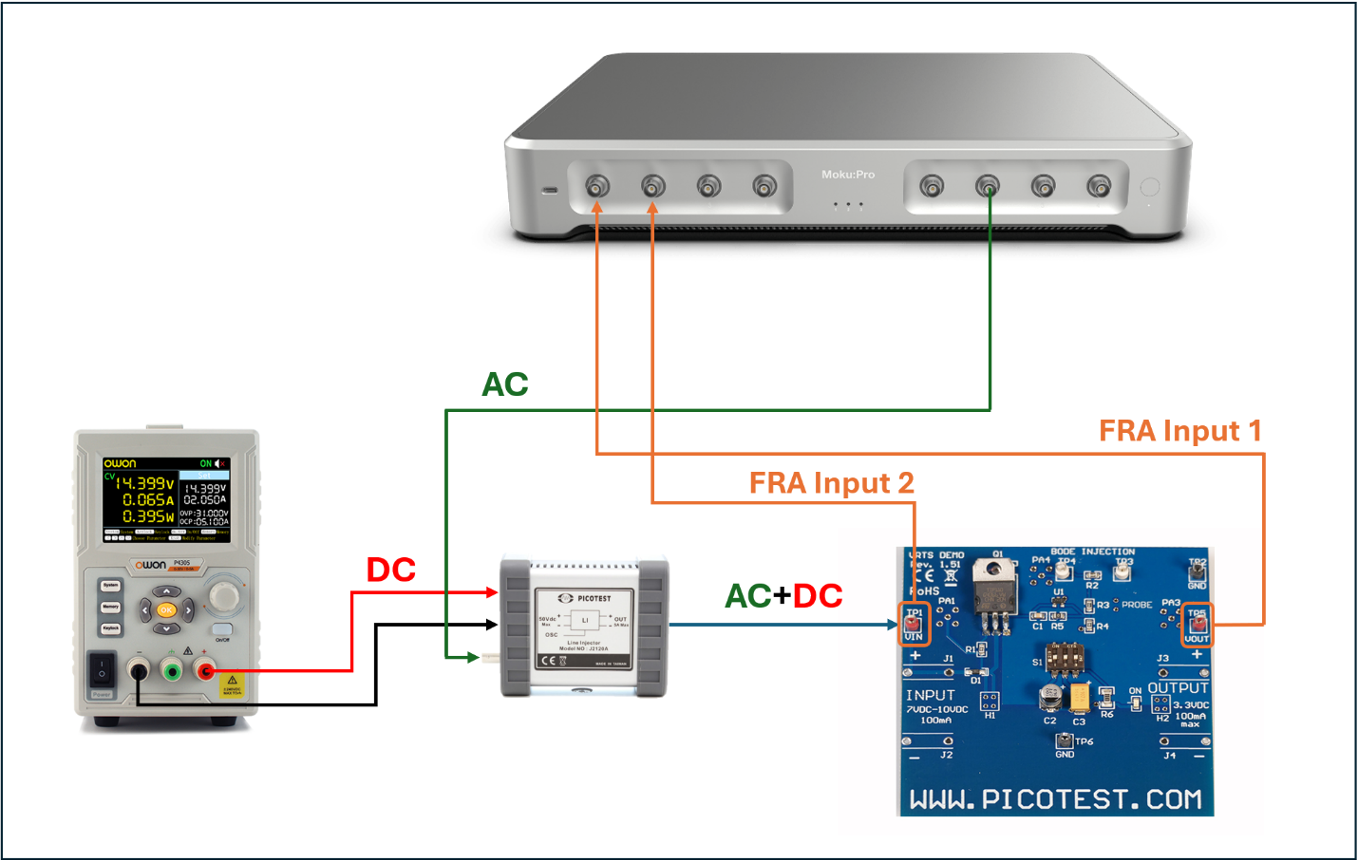
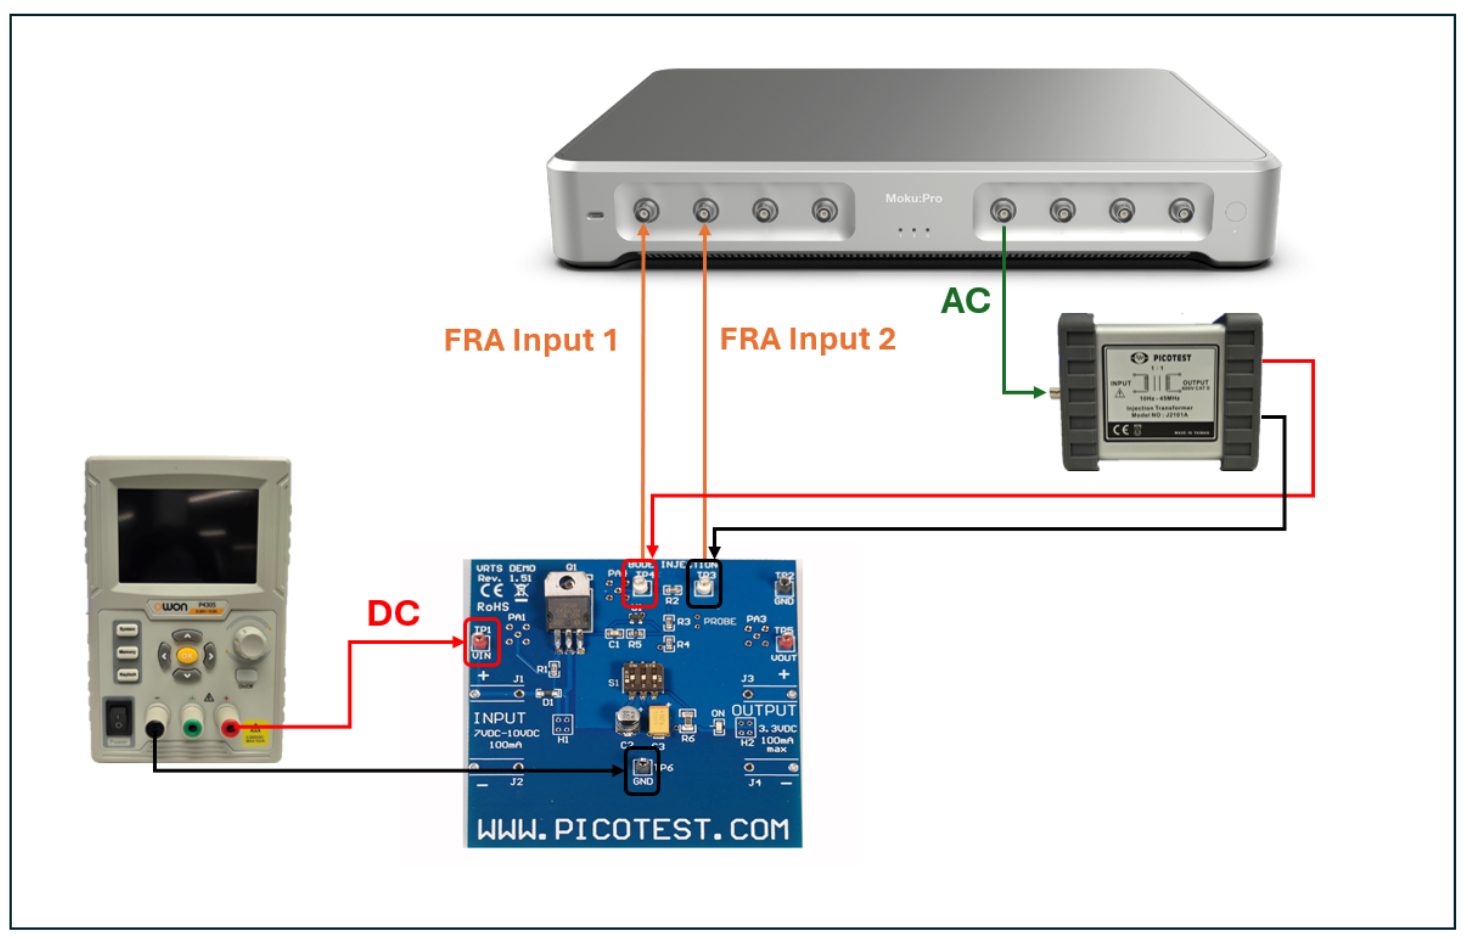
The input voltage range of the regulator board is 7-10 VDC. To accommodate the voltage drop across the line injector, the DC power supply was set to output 11 VDC, resulting in 8.5 VDC on the regulator input.
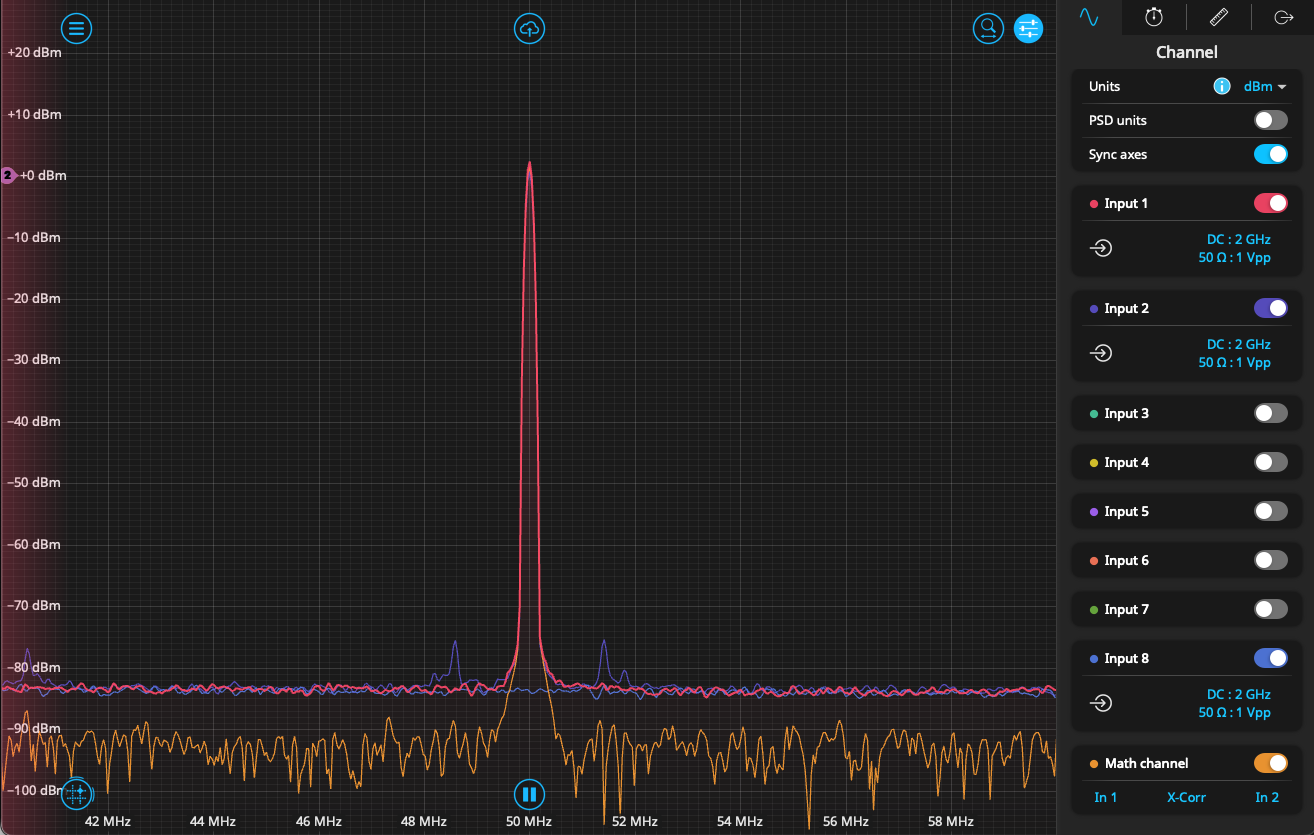
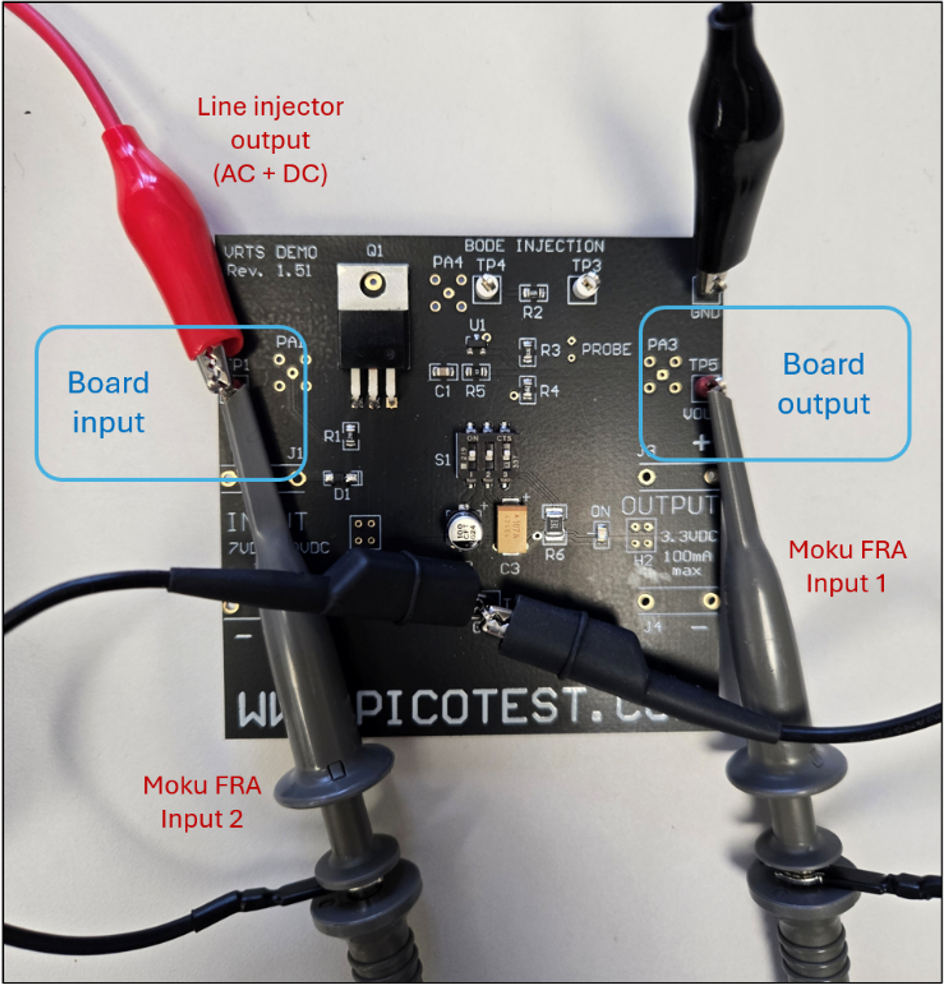
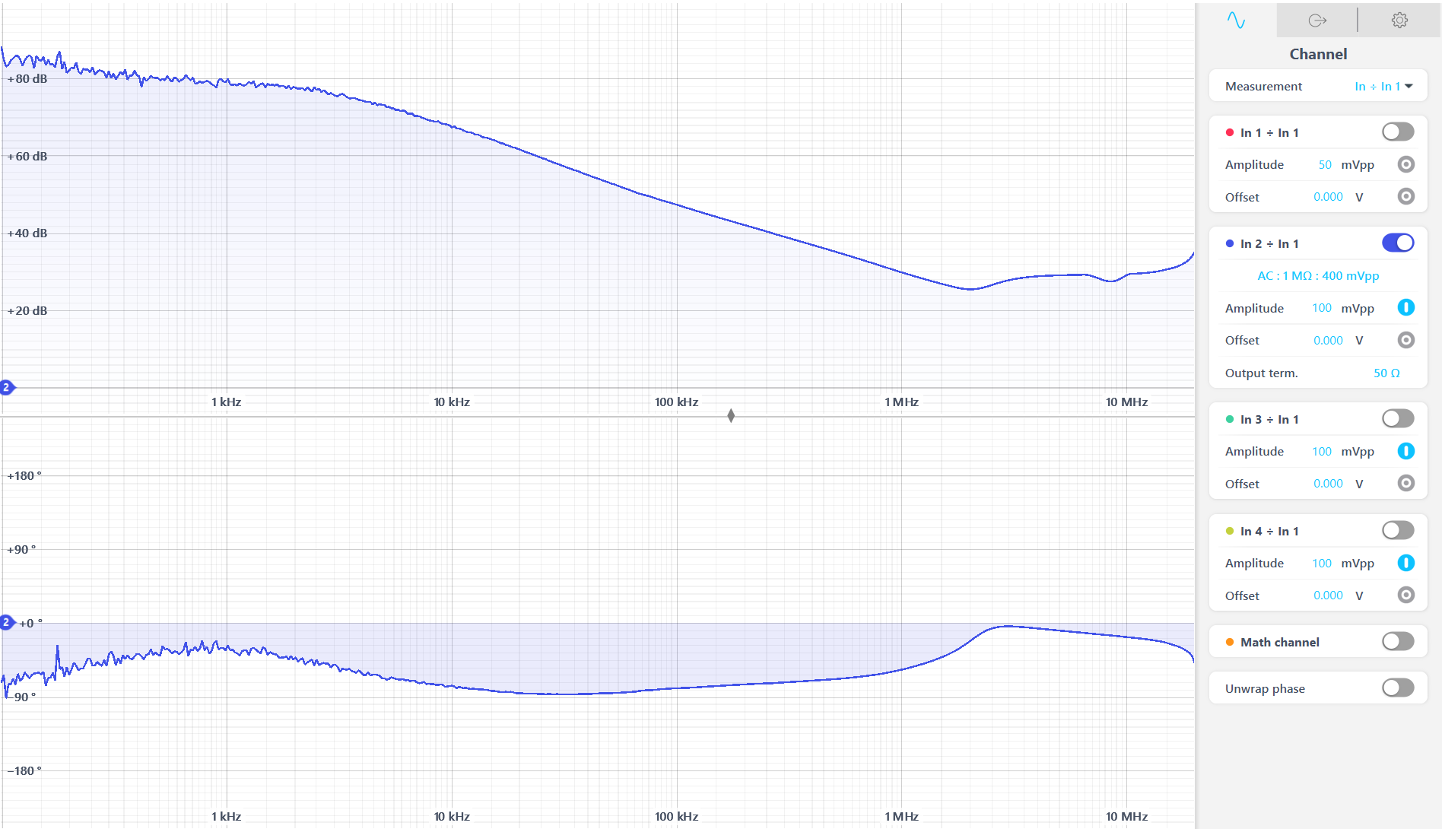
The Frequency Response Analyzer output a 100 mVpp sinusoid from output 2 into the line injector. The output signal frequency was swept from 100 Hz to 20 MHz. By sweeping the frequency of the disturbance signal, we can observe how well the regulator rejects the input ripples at different frequencies. The regulator input and output were connected to Input 2 and Input 1, respectively. This configuration allows for utilizing the “In ÷ In1” measurement setting to directly measure the Vin/Vout transfer function in units of decibels (dB). An image of the Frequency Response Analyzer settings and interface are shown in Figure 3 below.
Results
The collected data was exported as a matfile from the Frequency Response Analyzer. Figures 4 and 5 show the resulting PSRR curves from the regulator plotted in MATLAB. The evaluation board has three onboard switches that allow users to enable or disable the use of two output capacitors, and a load resistor which adds a 25 mA load current. The output capacitors are expected to improve the PSRR at higher frequencies, which is observed in the Figure 4 plot. All three curves were measured with the resistor switched on. To eliminate the noise in the lower frequency regime, Figure 5 shows the same PSRR measurements but with 100 ms averaging, implemented in the Frequency Response Analyzer settings.
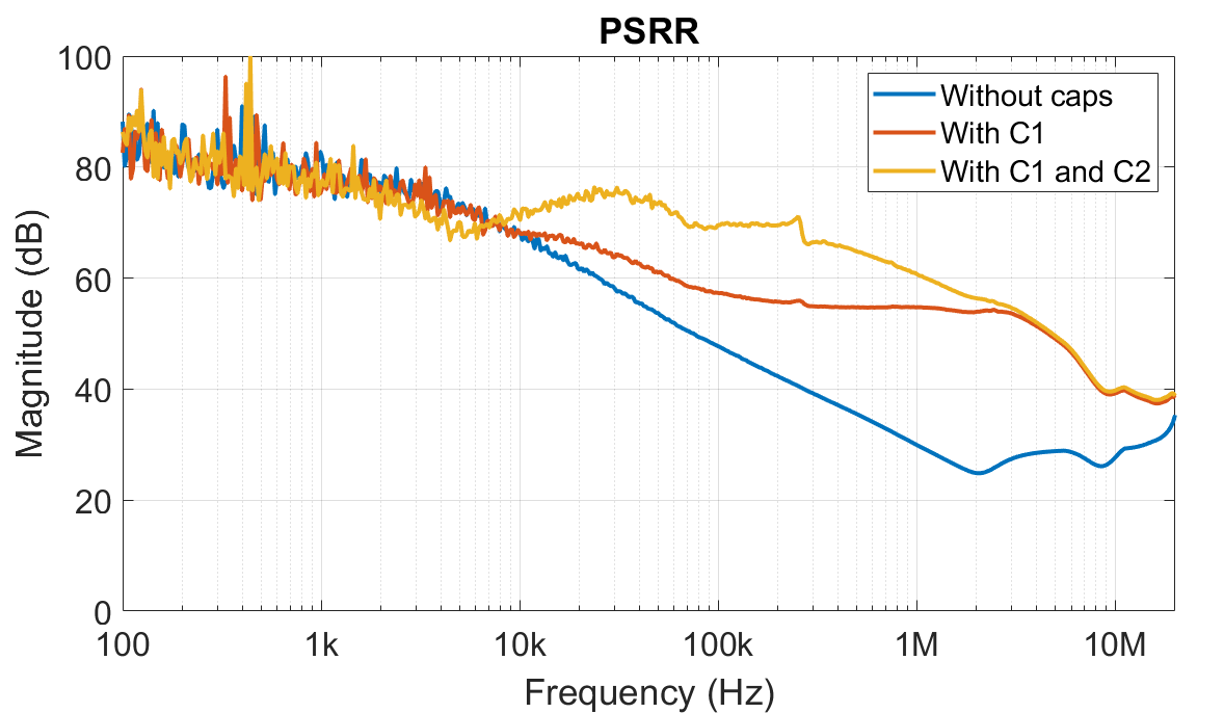
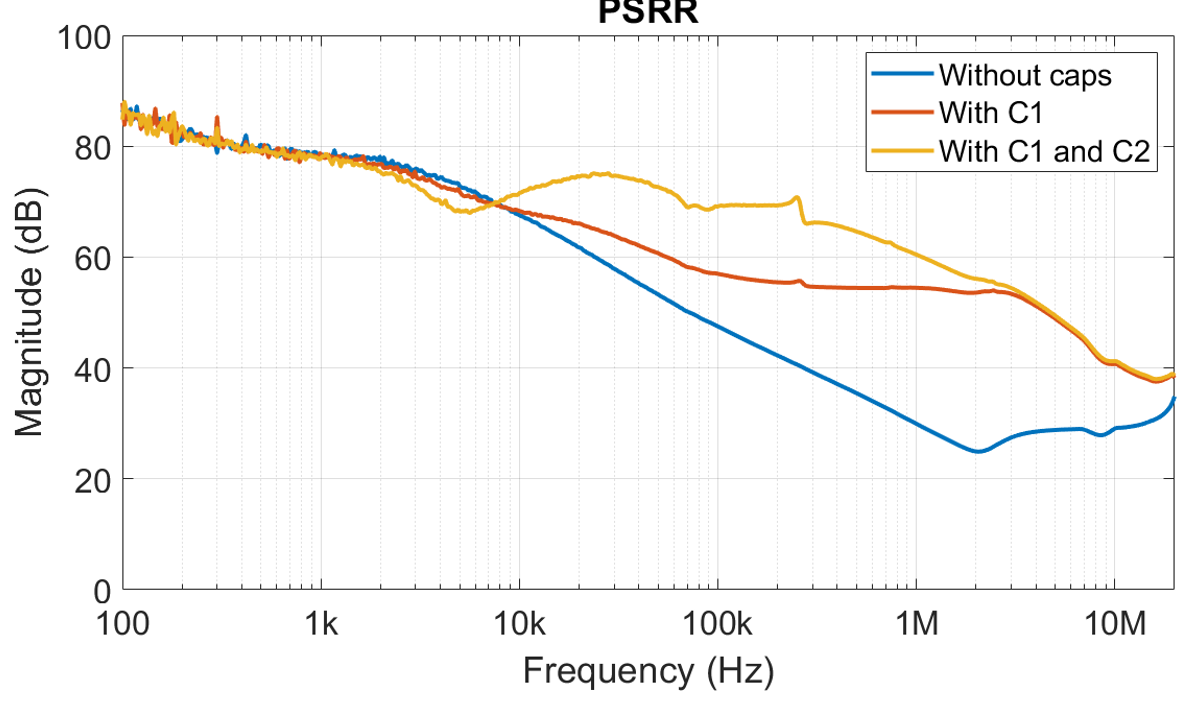
The PSRR plots show a relatively flat band at around 80 dB until it drops off around 2 kHz. Beyond 2 kHz, we see how the regulator performance decreases with higher frequencies, as expected when the regulator control loop cannot keep up with the higher frequencies. Adding capacitors on the output serves as a low-impedance path for higher frequency noise. It essentially creates a low-pass filter before the higher frequencies can reach the load. As shown in Figures 4 and 5, each additional capacitor further improved the PSRR at higher frequencies.
Summary
In this application note, we used the Moku:Pro Frequency Response Analyzer to measure the PSRR of a voltage regulator on the Picotest VRTS board. A line injector was used to inject a disturbance onto the DC input voltage of the regulator and the Frequency Response Analyzer successfully measured the transfer function of the input ripple relative to the output ripple. We also illustrated the impact of output capacitors on high frequency ripple rejection.