Please update your browser. For the best Liquid Instruments experience, update to the latest version of Chrome, Edge, Firefox, or Safari. Update Microsoft Edge.
Liquid Instruments Logo
Products
Hardware Platforms
Moku:Delta
Moku:Delta
New
For advanced design and validation
Moku:Pro
Moku:ProFor versatile test and measurement
Moku:Lab
Moku:LabFor experimental research labs
Moku:Go
Moku:GoFor quick testing and debugging
Compare Hardware
Compare HardwareView a side-by-side of all Moku hardware
Technologies
GenInst Studio
New
Generate personalized instruments
Integrated InstrumentsProfessional-grade instruments at your fingertips
Neural NetworkFPGA-powered neural network integration
Multi-Instrument ModeCombine instruments to create a customized test system
Moku CompileCode, compile, and deploy to your Moku's FPGA
Software
MokuOSDownload the Moku app for Windows, macOS, iPadOS & visionOS
APIsPython, MATLAB, LabVIEW
UtilitiesCommand line and graphical tools for file conversion
Instruments
Analysis
Oscilloscope
Spectrum Analyzer
Frequency Response Analyzer
Lock-in Amplifier
Phasemeter
Logic Analyzer / Pattern Generator
Time & Frequency Analyzer
Data Logger
Generation
Waveform Generator
Arbitrary Waveform Generator
Control & Conditioning
PID Controller
Digital Filter Box
FIR Filter Builder
Laser Lock Box
Custom & Utility
GenInst Studio
New
Gigabit Streamer
Custom Instrument
Neural Network
Multi-Instrument Mode
Applications
Optics and Photonics
Microscopy and Spectroscopy
Photon Counting
Quantum Optics
Aerospace and defense
A&D Instrumentation
Component Test
Automated Testing
Semiconductor Test
Control Systems and Bode Analysis
MEMS Testing
AI and Machine Learning
Generative Instrumentation
New
Neural Networks
Education
Education and Research
Resources
App Notes
Blog
Case Studies
Coursework
Guides
Product Documentation
Publications
Webinars
White Papers
Support
Company
Contact Us
About Us
Leadership
Partners
News & Updates
Press
Events Calendar
Careers
Store
Moku:Delta
Moku:Pro
Moku:Go
Upgrade Moku:Pro
Upgrade Moku:Lab
Upgrade Moku:Go
0
Get a quote Buy Now
Blog

Characterizing microphone frequency response and directionality with LabVIEW and the Moku:Go Frequency Response Analyzer – Part 1

August 1, 2023

    Introduction

    Understanding a microphone’s frequency response and directional sensitivity is essential for evaluating performance from the design stage through to production. Using the Shure SM57 microphone as our device under test (DUT), we aim to assess the characteristics of the microphone, as well as characterize the specific DUT by comparing our findings with the manufacturer’s datasheet. By starting with manual data collection, we can first verify our procedure before automating our measurements, paving the way for more efficient and accurate testing procedures. The software-defined Moku:Go Frequency Response Analyzer (FRA) allows us to apply a swept sine signal to our DUT to view the response in magnitude and phase. Programmatically running this verification allows us to reduce manual intervention, human error, and test time through LabVIEW. 

    (Looking for more information on automating the measurements? Check out Part 2 of this experiment.)

    Instrumentation

    We utilized the following materials, seen in Figure 1:

    1. Moku:Go Frequency Response Analyzer instrument
    2. Loudspeaker: Event PS6
    3. Reference microphone: Oktava MK-12-01
    4. Device Under Test (DUT): Shure SM57 microphone
    5. Preamplifier: Apogee Duet 
    6. Manual rotation stage: Utilized for manual directionality data collection

    Figure 1: Test setup block diagram

    Frequency response characterization

    To begin, we sweep the FRA from 35 Hz to 20 kHz and simultaneously measure the response of our reference microphone (Oktava Mk-12) and the DUT (SM57 microphone). The DUT response is then compared against the reference response (DUT/reference) to create a normalized curve. This approach allows us to make reliable and consistent measurements in the absence of things like an anechoic chamber or a perfectly calibrated loudspeaker. Figure 2 shows the frequency response of the SM57 collected using Moku:Go and LabVIEW on top, while the bottom graph shows the frequency response in dB from the manufacturer’s datasheet.

    Figure 2: Frequency response in dB vs. Hz collected using the Moku:Go FRA (top) and the manufacturer’s specified frequency response (bottom)


    Manual directionality characterization

    After examining the frequency response, we focus on characterizing the microphone’s directionality, or sensitivity to sound relative to the angle of incidence. Directionality is typically displayed in the form of a polar plot. To accomplish this, we manually adjust the rotation stage while collecting sweeps at various angles relative to the loudspeaker. For each angle, we identify the amplitude value corresponding to 1000 Hz. The resulting polar plot in Figure 3 shows the SM57’s expected cardioid polar pattern.  
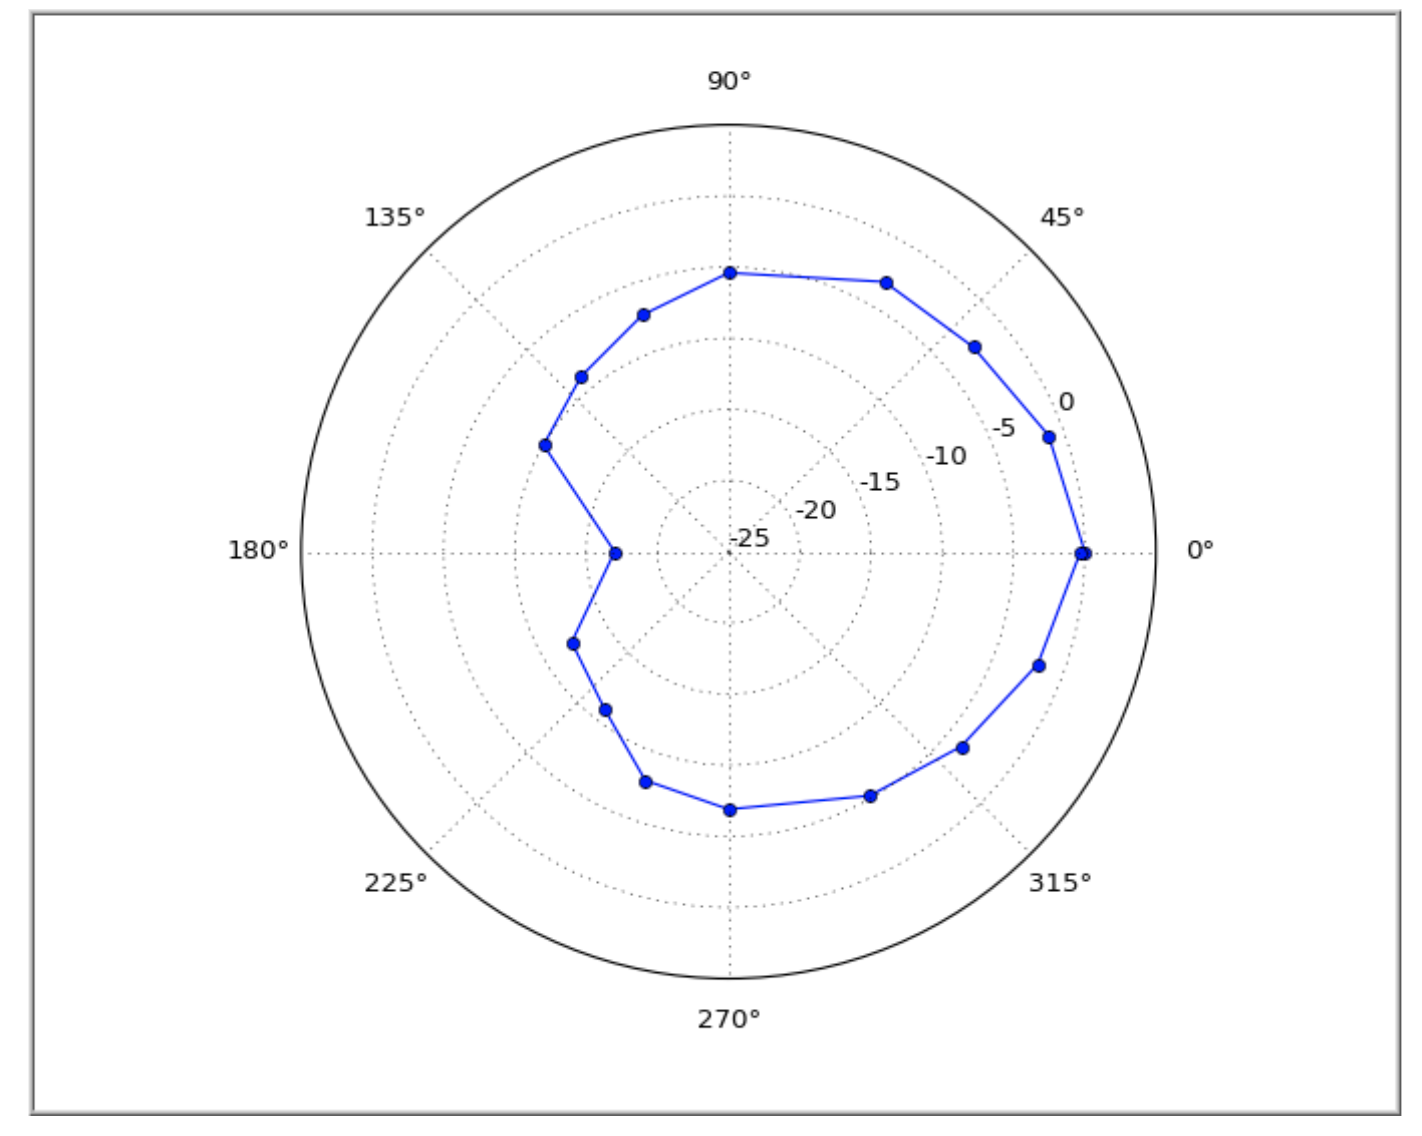
    Figure 3: Cardioid polar pattern collected manually with Moku:Go

    LabVIEW implementation

    The LabVIEW code was created using Liquid Instruments LabVIEW API to control the Moku:Go FRA instrument. There are two testing modes: ON AXIS and POLAR. ON AXIS mode measures the frequency response of the microphone at 0˚ relative to the loudspeaker. POLAR mode measures the frequency response of the microphone at various angles relative to the loudspeaker. Figure 4, the graphical user interface (GUI) for ON AXIS mode, shows the FRA configuration parameters, the frequency response of the microphone, and the smoothing filter selection.
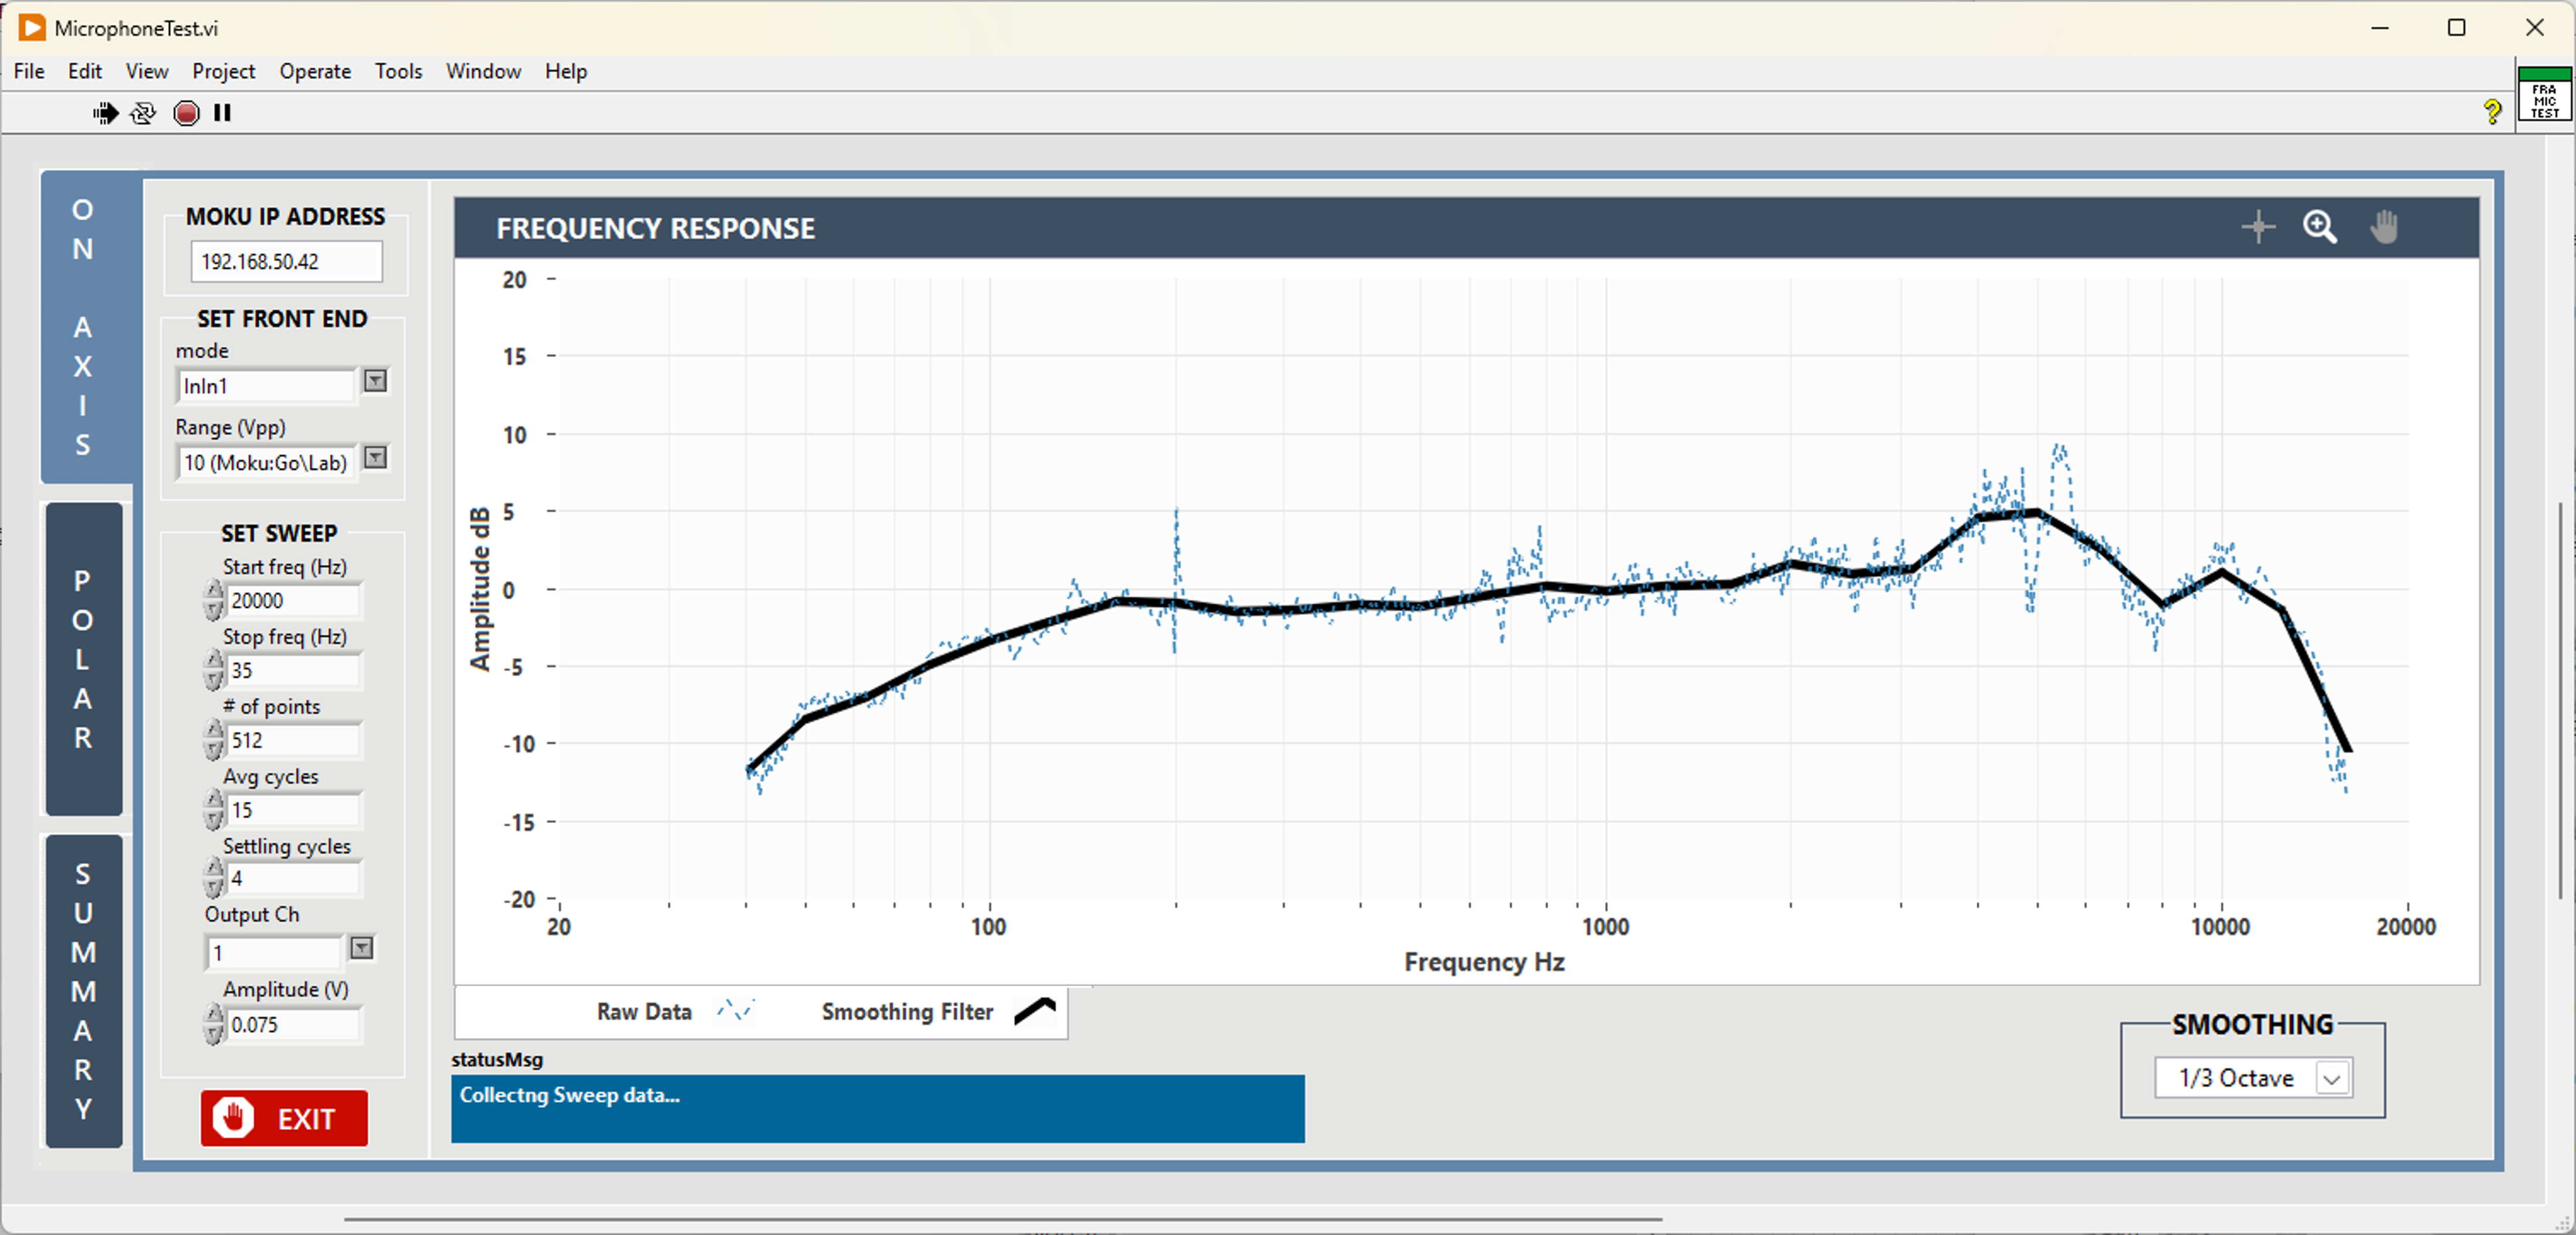
    Figure 4: LabVIEW graphical user interface, ON AXIS mode 
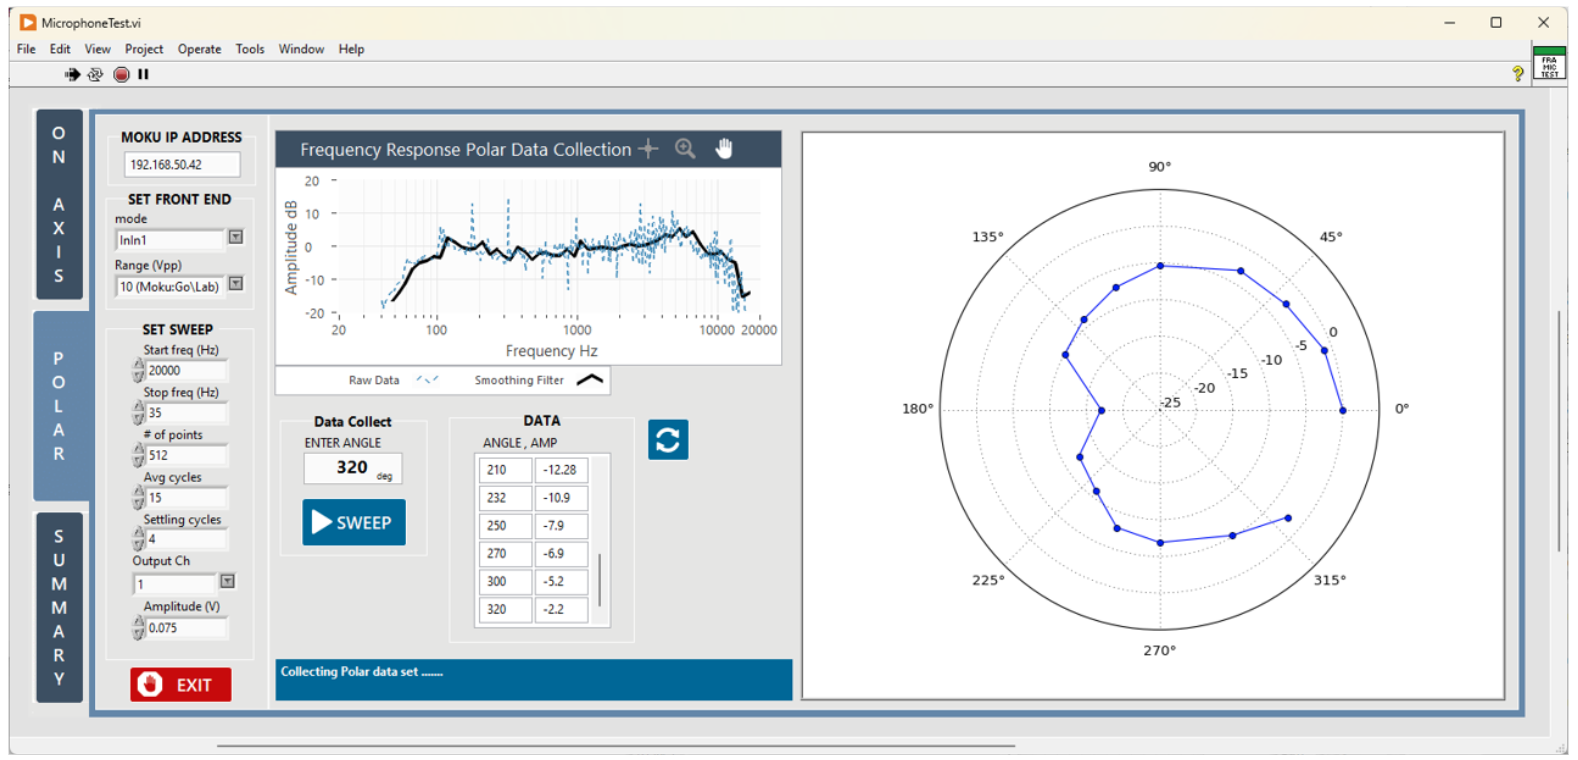
     

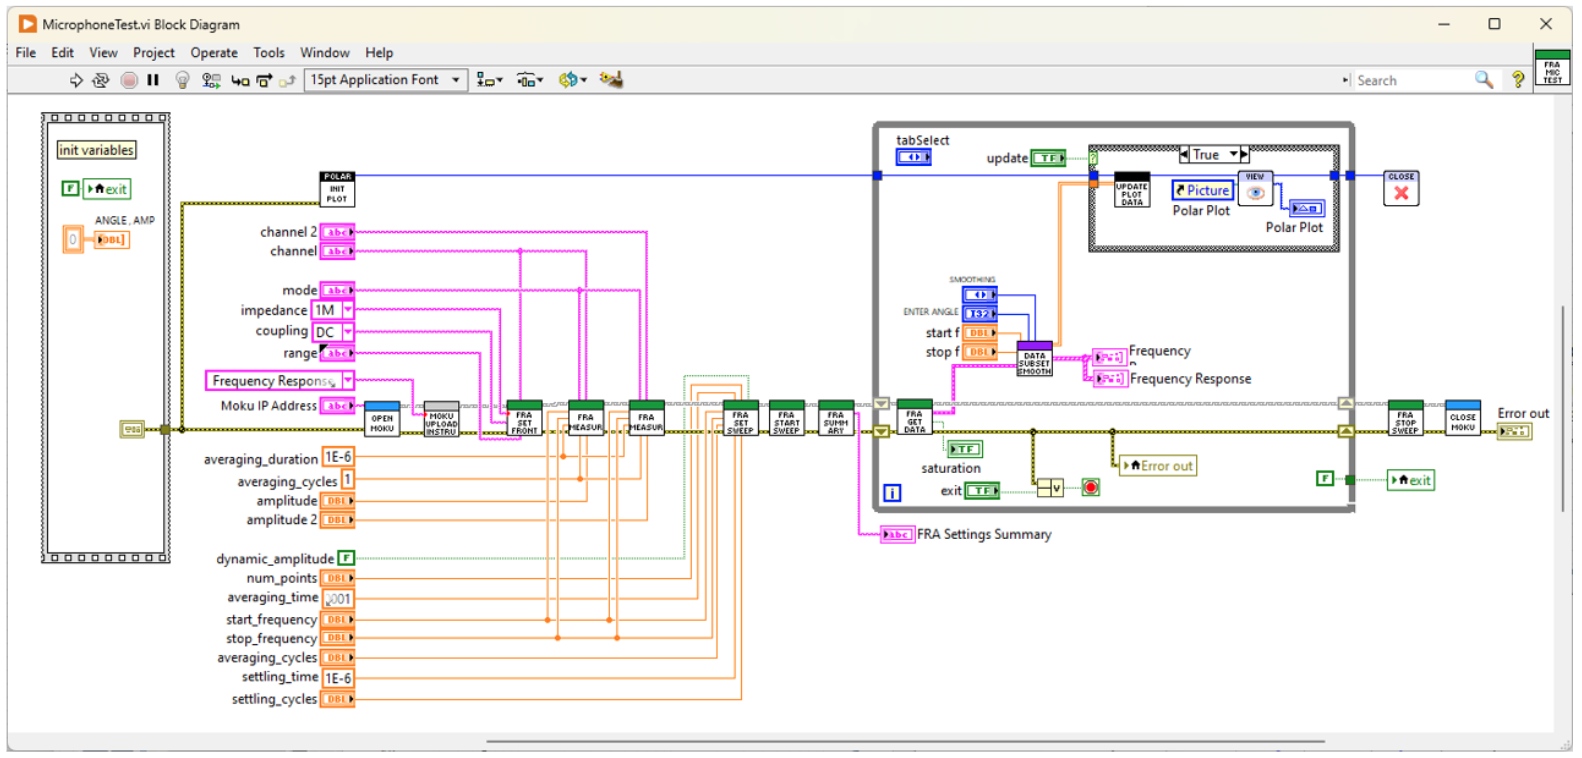
    Figure 5, the GUI for POLAR mode, shows FRA configuration parameters, the frequency response of the microphone for the current angle, and the resulting polar plot. The user manually moves the rotation stage, enters the angle, and starts the sweep. The amplitude value corresponding to 1000 Hz is extracted from the sweep data and appended to the polar plot. Figure 6 shows the LabVIEW block diagram.

    Figure 5: LabVIEW GUI, POLAR mode

    Figure 6: LabVIEW block diagram

    Automating the measurements

    While manual data collection is valuable for establishing a proof of concept, automation is key to achieving more efficient and consistent measurements. In part two of this experiment, we will implement a stepper motor to rotate the microphone during data collection via LabVIEW. This automation will streamline the measurement process, reducing human error and saving valuable time.

    Conclusion

    In this blog, we have shown the first steps of using the Moku:Go Frequency Response Analyzer to programmatically characterize and verify a device under test using LabVIEW. Starting with manual data collection, we verified our setup’s accuracy and replicated the microphone’s frequency response and polar pattern. Come back for part two to learn how to fully automate the procedure for a hands-off, streamlined approach to testing and data acquisition.

    Looking for more information on automating the measurements? Check out Part 2 of this experiment.

    For more information, click here or contact us at support@liquidinstruments.com.


    Try Moku in demo mode Download the Moku app → Get answers to FAQs Visit Knowledge Base → Connect with Moku users Join the user forum →

    Other Recommended Blog Posts

    Blog
    What is Generative Instrumentation?

    The AI-enabled technology for creating customized test solutions, including specialized measurements, real-time signal processing, and control capabilities

    Date: July 14, 2026

    Blog
    5 Advantages of FPGA-Based Customization for Test & Measurement

    How instruments with user-programmable FPGAs are replacing racks of test equipment, and what that means for your lab.

    Featuring: Moku Cloud Compile

    Date: May 22, 2026

    Blog
    Faster, more powerful real-time customization with MokuOS 4.2

    MokuOS 4.2 unlocks higher bandwidth, faster real-time processing, and more instruments on Moku:Delta, all with a simple software update.

    Date: March 19, 2026

    Back to all Blog

    Nav

    • Products
    • Instruments
    • Resources
    • Support
    • Company
    • Contact Us
    • Privacy Policy
    • Terms of Use

    Offices

    United States
    (619) 332-6230
    12526 High Bluff Dr.
    Suite 150
    San Diego, CA 92130

    Australia
    +61 2 6171 9730
    243 Northbourne Avenue
    Suite 1, Level 1
    Lyneham, ACT 2602

    Australia
    +61 3 7073 3594
    Suite 5C, Level 5,
    700 Swanston Street,
    Carlton, VIC – 3058


    Follow us

    LinkedIn YouTube X Facebook Instagram

    官方微信

    © 2026 Liquid Instruments. All rights reserved.