Please update your browser. For the best Liquid Instruments experience, update to the latest version of Chrome, Edge, Firefox, or Safari. Update Microsoft Edge.
Liquid Instruments Logo
Products
Hardware Platforms
Moku:Delta
Moku:Delta
New
For advanced design and validation
Moku:Pro
Moku:ProFor versatile test and measurement
Moku:Lab
Moku:LabFor experimental research labs
Moku:Go
Moku:GoFor quick testing and debugging
Compare Hardware
Compare HardwareView a side-by-side of all Moku hardware
Technologies
GenInst Studio
New
Generate personalized instruments
Integrated InstrumentsProfessional-grade instruments at your fingertips
Neural NetworkFPGA-powered neural network integration
Multi-Instrument ModeCombine instruments to create a customized test system
Moku CompileCode, compile, and deploy to your Moku's FPGA
Software
MokuOSDownload the Moku app for Windows, macOS, iPadOS & visionOS
APIsPython, MATLAB, LabVIEW
UtilitiesCommand line and graphical tools for file conversion
Instruments
Analysis
Oscilloscope
Spectrum Analyzer
Frequency Response Analyzer
Lock-in Amplifier
Phasemeter
Logic Analyzer / Pattern Generator
Time & Frequency Analyzer
Data Logger
Generation
Waveform Generator
Arbitrary Waveform Generator
Control & Conditioning
PID Controller
Digital Filter Box
FIR Filter Builder
Laser Lock Box
Custom & Utility
GenInst Studio
New
Gigabit Streamer
Custom Instrument
Neural Network
Multi-Instrument Mode
Applications
Optics and Photonics
Microscopy and Spectroscopy
Photon Counting
Quantum Optics
Aerospace and defense
A&D Instrumentation
Component Test
Automated Testing
Semiconductor Test
Control Systems and Bode Analysis
MEMS Testing
AI and Machine Learning
Generative Instrumentation
New
Neural Networks
Education
Education and Research
Resources
App Notes
Blog
Case Studies
Coursework
Guides
Product Documentation
Publications
Webinars
White Papers
Support
Company
Contact Us
About Us
Leadership
Partners
News & Updates
Press
Events Calendar
Careers
Store
Moku:Delta
Moku:Pro
Moku:Go
Upgrade Moku:Pro
Upgrade Moku:Lab
Upgrade Moku:Go
0
Get a quote Buy Now
Blog

Characterizing microphone frequency response and directionality with LabVIEW and the Moku:Go Frequency Response Analyzer – Part 2

September 19, 2023

    Introduction

    In Part 1 of this experiment, we showed the initial steps of how to use the Moku:Go Frequency Response Analyzer to programmatically characterize and verify a device under test (DUT) using LabVIEW. Starting with manual data collection, we verified our setup’s accuracy and replicated the microphone’s frequency response and polar pattern. Now in Part 2, we use a motorized rotation stage to fully automate the directional sensitivity characterization. 

    Instrumentation

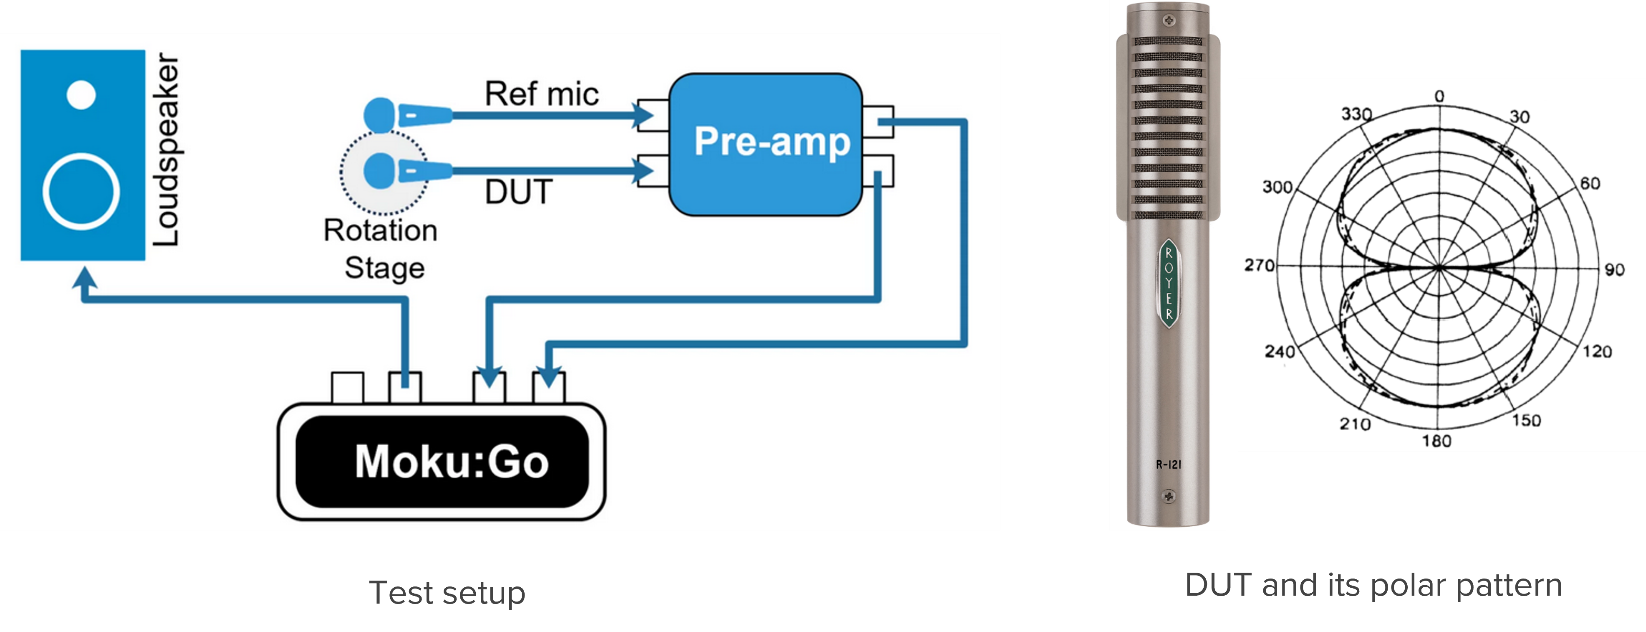
    We utilized the following materials, seen in Figure 1:

    1. Moku:Go Frequency Response Analyzer instrument
    2. Loudspeaker: Event PS6
    3. Reference microphone: Oktava MK-12-01
    4. Device Under Test (DUT): Royer r-121 microphone
    5. Preamplifier: Apogee Duet 
    6. Motorized rotation stage

    Figure 1: Test setup block diagram and device under test

    Automated directionality characterization

    To automate the characterization of the microphone’s directionality, we mounted the DUT on a motorized rotation stage. The rotation stage consists of a stepper motor, worm gear, and motor controller. Stepper motors offer excellent speed control, precise positioning, and repeatability of movement, all critical requirements for making reliable and consistent automated measurements. We assembled a plate with a microphone table mount that attaches to the rotation stage (Figure 2), which allows us to rotate the DUT a full 360° in discrete steps.
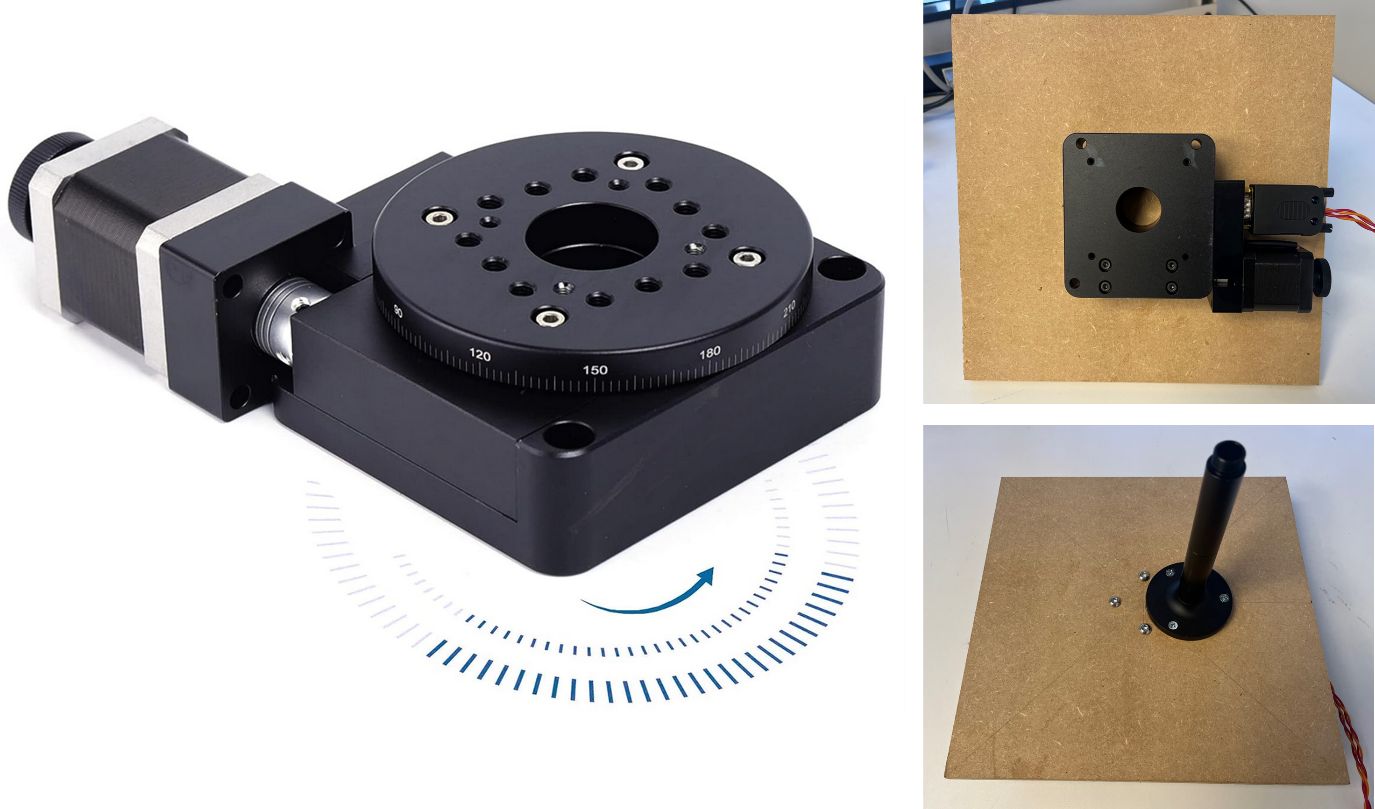
    Figure 2: Motorized rotation stage and mounting plate

    LabVIEW implementation

    The automated microphone characterization program controls the Moku:Go Frequency Response Analyzer, the stepper motor driving our rotation stage, and the live camera feed monitoring the DUT. The program controls DUT rotation, rotating it 360° in 15° increments, measures a sweep at each position, and extracts the value corresponding to 1 kHz before plotting it on the polar plot. For each DUT position, the program updates the frequency response plot. The live camera feed shows the physical rotation of the DUT, and various status messages are displayed on the front panel (Figure 3).
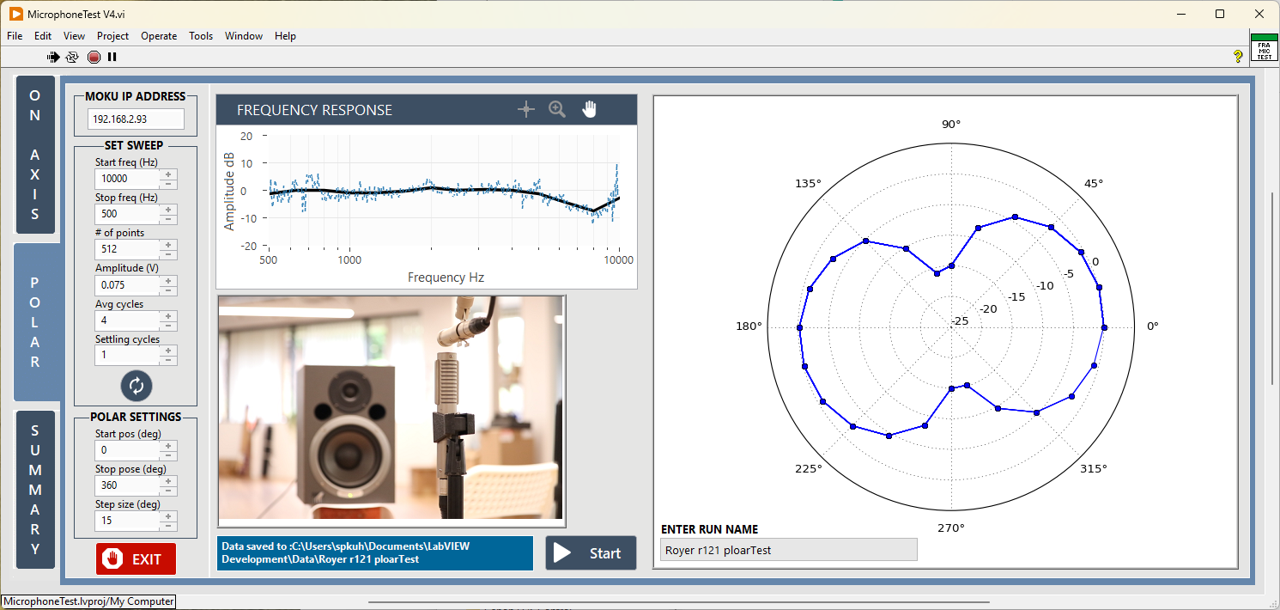
    Figure 3: LabVIEW graphical user interface
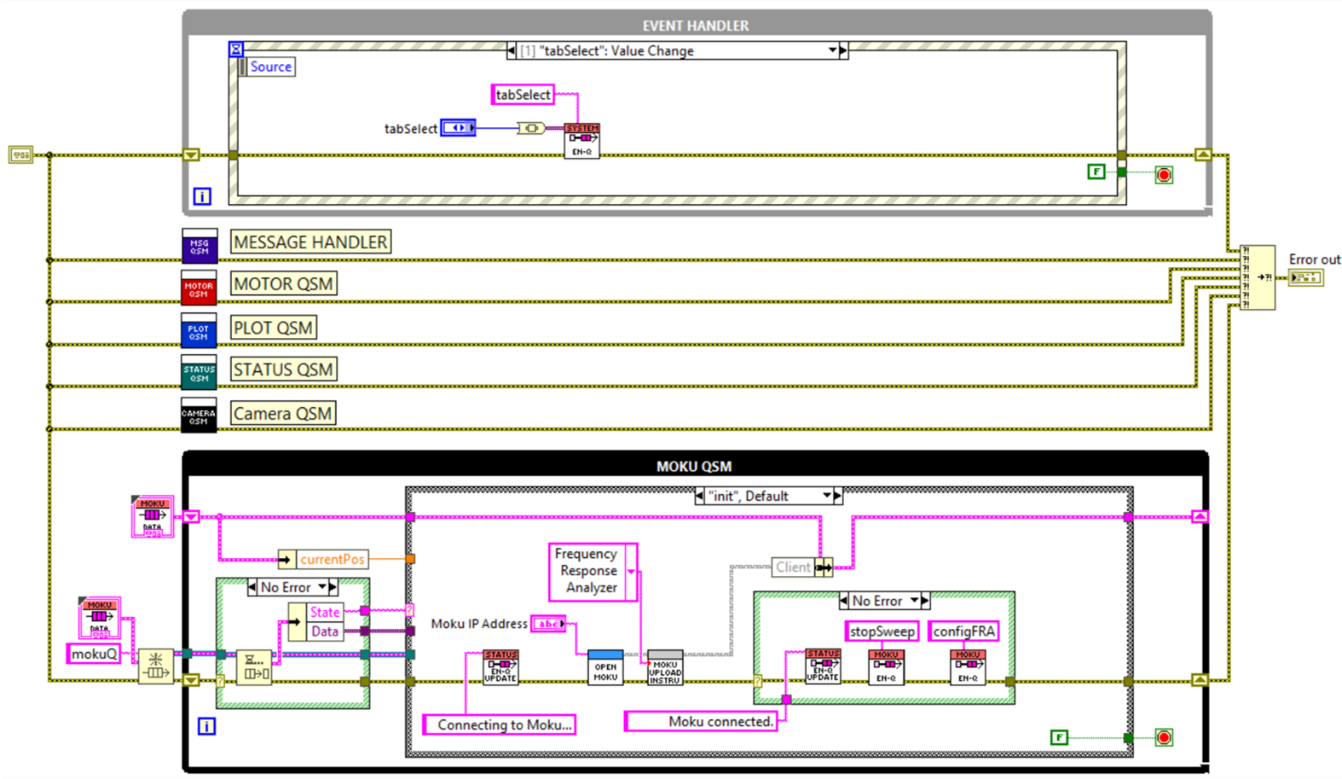
    The LabVIEW demo program graphical user interface (GUI) displays the configuration parameters, Moku IP address, the swept sine wave, and the rotation stage. In the center, you can view the frequency response plot and the live camera feed. On the right, you can watch the polar plot update in real time. The DUT rotates 360° in steps of 15° while the Moku device measures each position in the sweep, extracts the value corresponding to 1000 Hz, and plots it on the polar plot. The LabVIEW block diagram, seen in Figure 4, shows a detailed view of how we integrated the Moku device with the DUT, test fixture, and monitoring equipment.

    Figure 4: LabVIEW block diagram

    The program utilizes the queued message handler design pattern. Multiple sections of code run in parallel. Each block of code is dedicated to a task, with each block being a state machine.

    • Event handler – handles events triggered from the GUI
    • Message handler – passes messages between the event handler and queued state machines (QSMs) and between the QSMs themselves
    • Motor QSM – controls the stepper motor driving the rotation stage
    • Plot QSM – receives data from the Frequency Response Analyzer (FRA) measurement and updates the polar plot
    • Status QSM – relays status messages from the state machines to the front panel
    • Camera QSM – monitors the DUT with a real time video feed
    • Moku QSM – drives the loudspeaker, measures the reference mic and DUT response simultaneously, sends data to the Plot QSM, and has additional data processing including 1/3 octave smoothing and extracting amplitude value corresponding to 1 kHz

    The motor, plot, and Moku QSMs work together to complete the test sequence.

    Test sequence overview

    1. Moku FRA initiates a sweep (Moku QSM)

    2. Moku FRA Measures the response (Moku QSM)

    • Stops the sweep (Moku QSM)
    • Sends data to the plot (Plot QSM)
    • Tells the motor to go to the next position

    3. Motor determines the next position (Motor QSM)

    4. Motor rotates the DUT to the next position (Motor QSM)

    • Tells the FRA to start sweep (Moku QSM)

    5. Repeat steps until the DUT is rotated 360°. 

    Output data

    The program saves the following data:

    • Frequency response raw data for each measurement position
    • Polar plot data
    • Polar plot
    • FRA instrument settings

    The output data provides all the information you need to reproduce this measurement in the future, with easy data sharing being an integral part of the Moku: application.

    Results

    The DUT is a Royer R-121 bidirectional ribbon microphone. It has a figure-8 polar pattern, which means that it’s equally sensitive to sound picked up from the front and back of the microphone, and not as sensitive to sound coming in from the sides.

    Figure 5 shows a detailed view of the polar plot. A clear figure-8 polar pattern is visible, which is the expected result for this microphone. Also as expected, it appears to be equally sensitive to sounds picked up from the front and back of the microphone, but not as sensitive to sounds picked up from the sides. There is an approximate 15 dB attenuation from sound coming into the microphone from the sides.
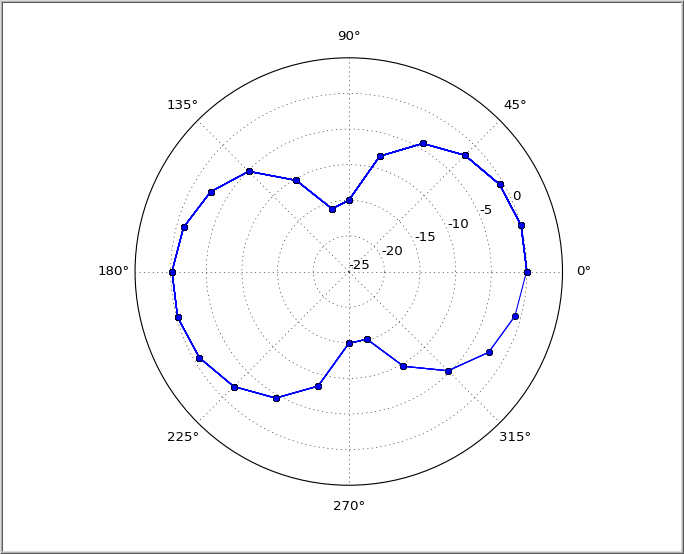
    Figure 5: DUT polar plot

    Conclusion

    In this blog, we have demonstrated how to fully automate the Moku:Go Frequency Response Analyzer to programmatically characterize and verify a device under test using LabVIEW.  The Liquid Instruments LabVIEW API makes it easy to integrate Moku alongside other manufacturers’ hardware to create custom automated test solutions.

    Want to see more examples performed live? Watch the webinar.

    For more information, click here. You can also contact us at support@liquidinstruments.com.


    Try Moku in demo mode Download the Moku app → Get answers to FAQs Visit Knowledge Base → Connect with Moku users Join the user forum →

    Other Recommended Blog Posts

    Blog
    What is Generative Instrumentation?

    The AI-enabled technology for creating customized test solutions, including specialized measurements, real-time signal processing, and control capabilities

    Date: July 14, 2026

    Blog
    5 Advantages of FPGA-Based Customization for Test & Measurement

    How instruments with user-programmable FPGAs are replacing racks of test equipment, and what that means for your lab.

    Featuring: Moku Cloud Compile

    Date: May 22, 2026

    Blog
    Faster, more powerful real-time customization with MokuOS 4.2

    MokuOS 4.2 unlocks higher bandwidth, faster real-time processing, and more instruments on Moku:Delta, all with a simple software update.

    Date: March 19, 2026

    Back to all Blog

    Nav

    • Products
    • Instruments
    • Resources
    • Support
    • Company
    • Contact Us
    • Privacy Policy
    • Terms of Use

    Offices

    United States
    (619) 332-6230
    12526 High Bluff Dr.
    Suite 150
    San Diego, CA 92130

    Australia
    +61 2 6171 9730
    243 Northbourne Avenue
    Suite 1, Level 1
    Lyneham, ACT 2602

    Australia
    +61 3 7073 3594
    Suite 5C, Level 5,
    700 Swanston Street,
    Carlton, VIC – 3058


    Follow us

    LinkedIn YouTube X Facebook Instagram

    官方微信

    © 2026 Liquid Instruments. All rights reserved.