Introduction
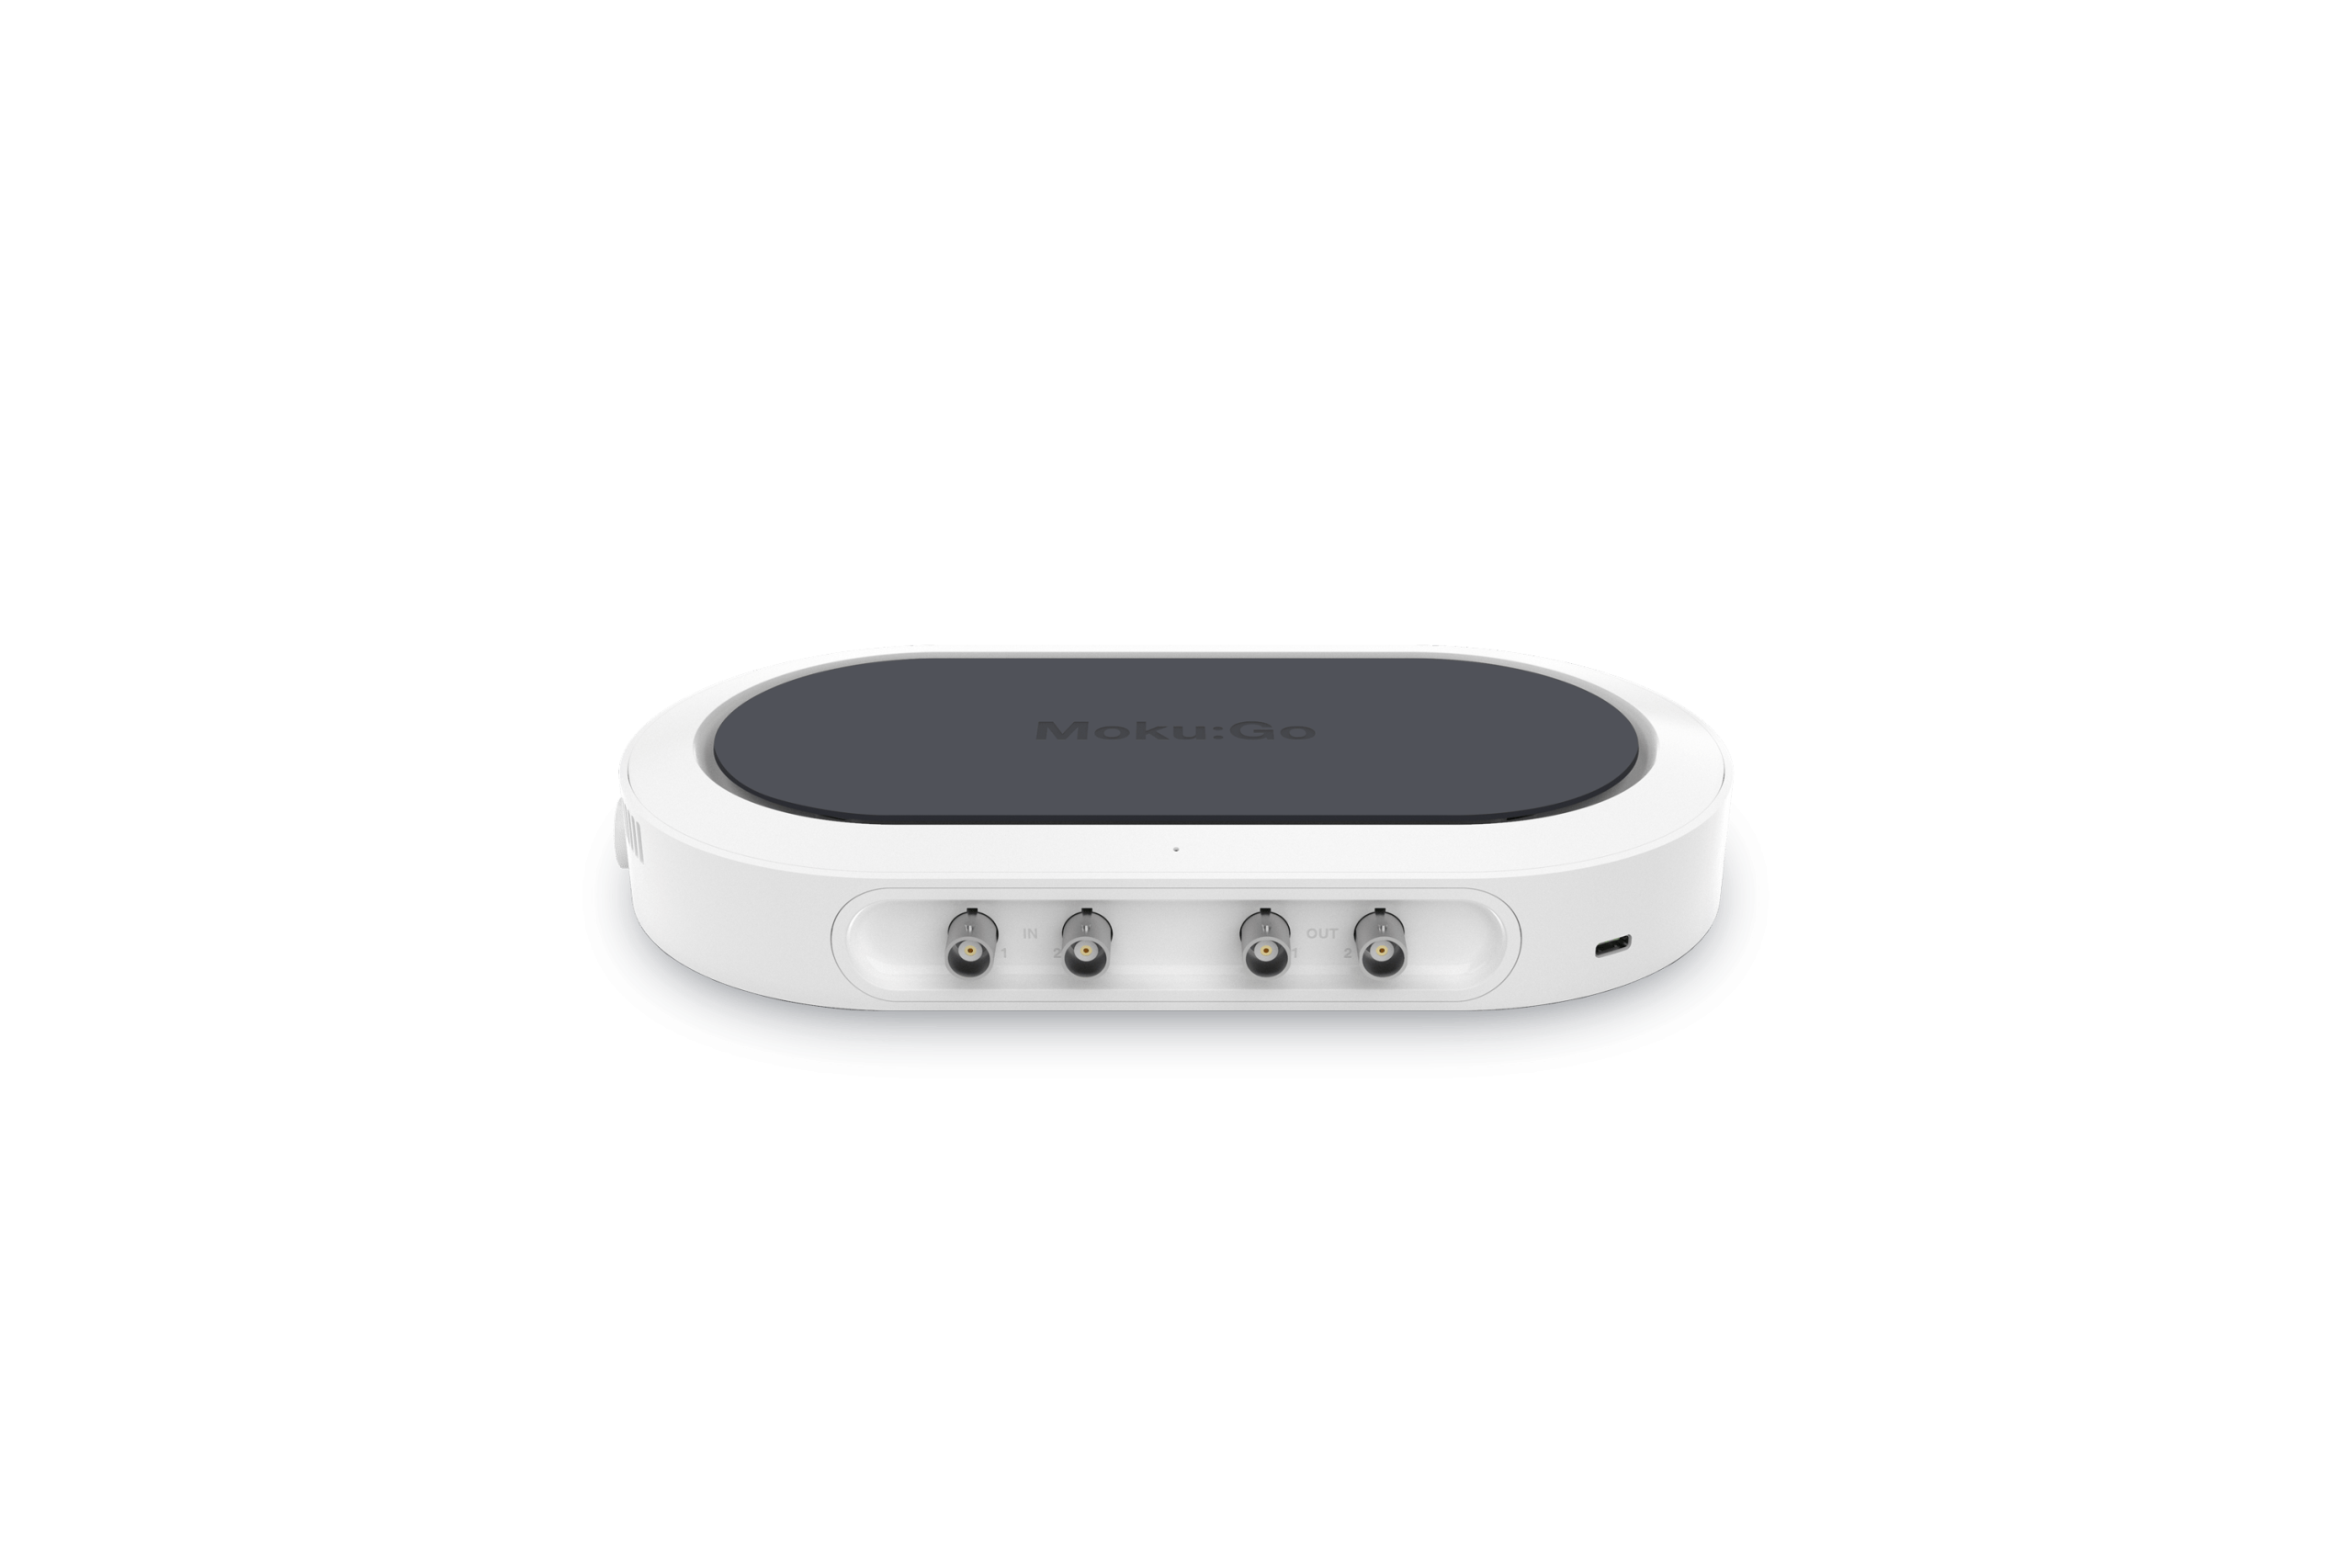
Understanding a microphone’s frequency response and directional sensitivity is essential for evaluating performance from the design stage through to production. Using the Shure SM57 microphone as our device under test (DUT), we aim to assess the characteristics of the microphone, as well as characterize the specific DUT by comparing our findings with the manufacturer’s datasheet. By starting with manual data collection, we can first verify our procedure before automating our measurements, paving the way for more efficient and accurate testing procedures. The software-defined Moku:Go Frequency Response Analyzer (FRA) allows us to apply a swept sine signal to our DUT to view the response in magnitude and phase. Programmatically running this verification allows us to reduce manual intervention, human error, and test time through LabVIEW.
(Looking for more information on automating the measurements? Check out Part 2 of this experiment.)
Instrumentation
We utilized the following materials, seen in Figure 1:
- Moku:Go Frequency Response Analyzer instrument
- Loudspeaker: Event PS6
- Reference microphone: Oktava MK-12-01
- Device Under Test (DUT): Shure SM57 microphone
- Preamplifier: Apogee Duet
- Manual rotation stage: Utilized for manual directionality data collection

Figure 1: Test setup block diagram
Frequency response characterization
To begin, we sweep the FRA from 35 Hz to 20 kHz and simultaneously measure the response of our reference microphone (Oktava Mk-12) and the DUT (SM57 microphone). The DUT response is then compared against the reference response (DUT/reference) to create a normalized curve. This approach allows us to make reliable and consistent measurements in the absence of things like an anechoic chamber or a perfectly calibrated loudspeaker. Figure 2 shows the frequency response of the SM57 collected using Moku:Go and LabVIEW on top, while the bottom graph shows the frequency response in dB from the manufacturer’s datasheet.

Figure 2: Frequency response in dB vs. Hz collected using the Moku:Go FRA (top) and the manufacturer’s specified frequency response (bottom)
Manual directionality characterization
After examining the frequency response, we focus on characterizing the microphone’s directionality, or sensitivity to sound relative to the angle of incidence. Directionality is typically displayed in the form of a polar plot. To accomplish this, we manually adjust the rotation stage while collecting sweeps at various angles relative to the loudspeaker. For each angle, we identify the amplitude value corresponding to 1000 Hz. The resulting polar plot in Figure 3 shows the SM57’s expected cardioid polar pattern.
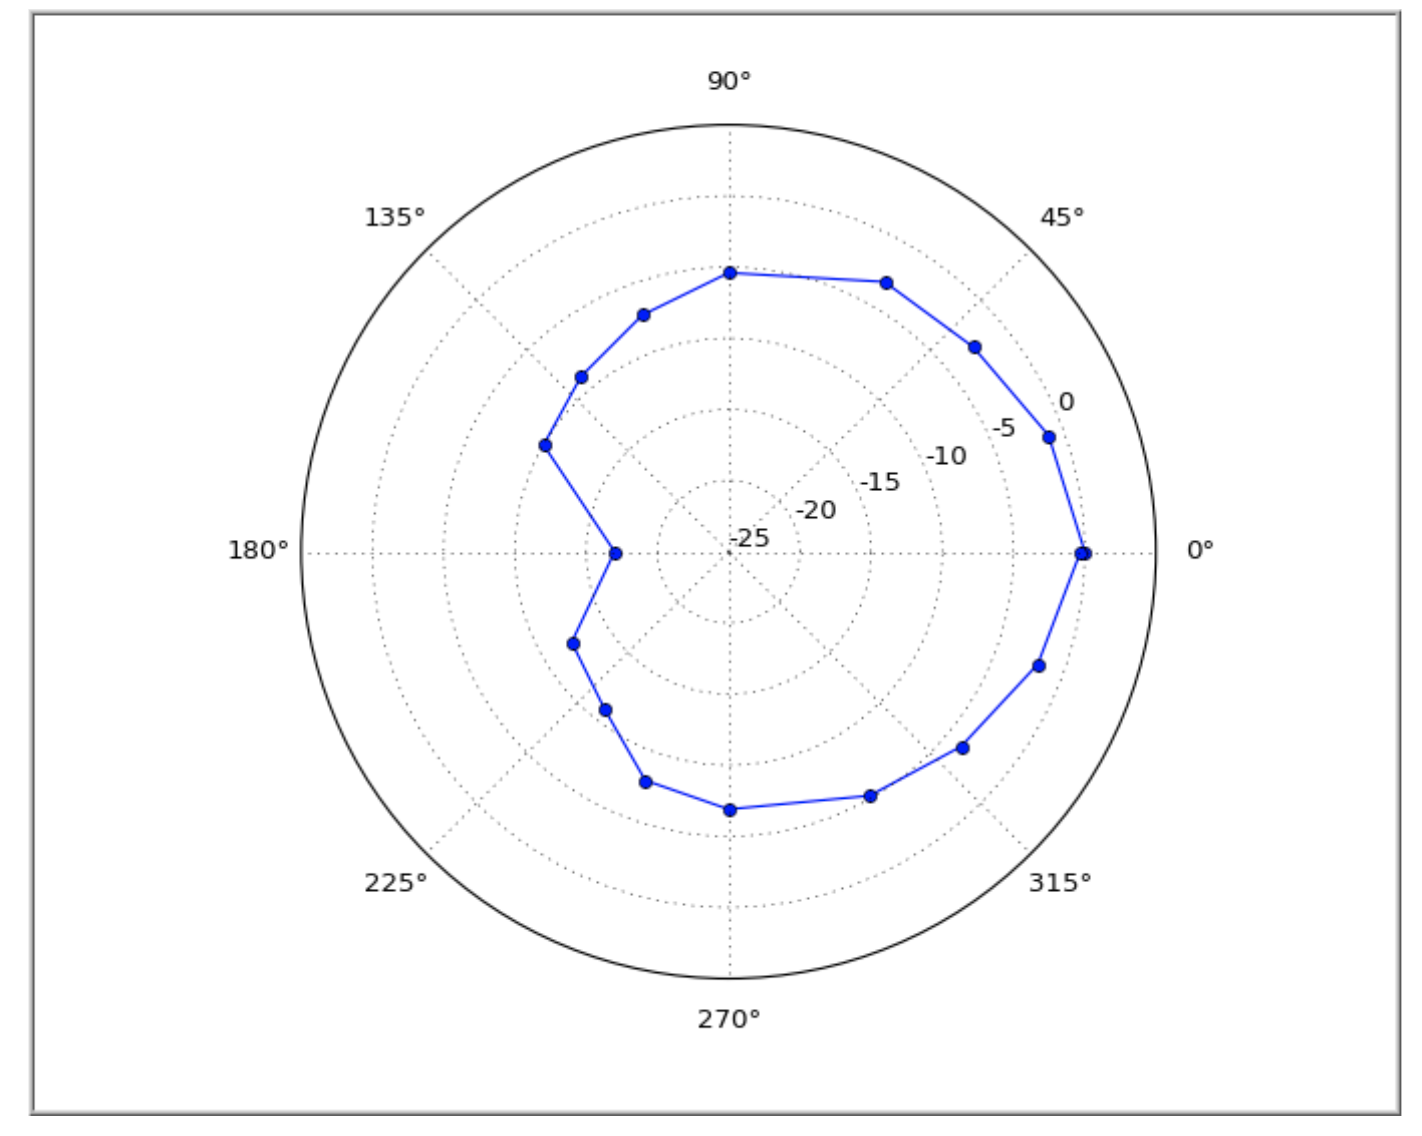
Figure 3: Cardioid polar pattern collected manually with Moku:Go
LabVIEW implementation
The LabVIEW code was created using Liquid Instruments LabVIEW API to control the Moku:Go FRA instrument. There are two testing modes: ON AXIS and POLAR. ON AXIS mode measures the frequency response of the microphone at 0˚ relative to the loudspeaker. POLAR mode measures the frequency response of the microphone at various angles relative to the loudspeaker. Figure 4, the graphical user interface (GUI) for ON AXIS mode, shows the FRA configuration parameters, the frequency response of the microphone, and the smoothing filter selection.

Figure 4: LabVIEW graphical user interface, ON AXIS mode
Figure 5, the GUI for POLAR mode, shows FRA configuration parameters, the frequency response of the microphone for the current angle, and the resulting polar plot. The user manually moves the rotation stage, enters the angle, and starts the sweep. The amplitude value corresponding to 1000 Hz is extracted from the sweep data and appended to the polar plot. Figure 6 shows the LabVIEW block diagram.
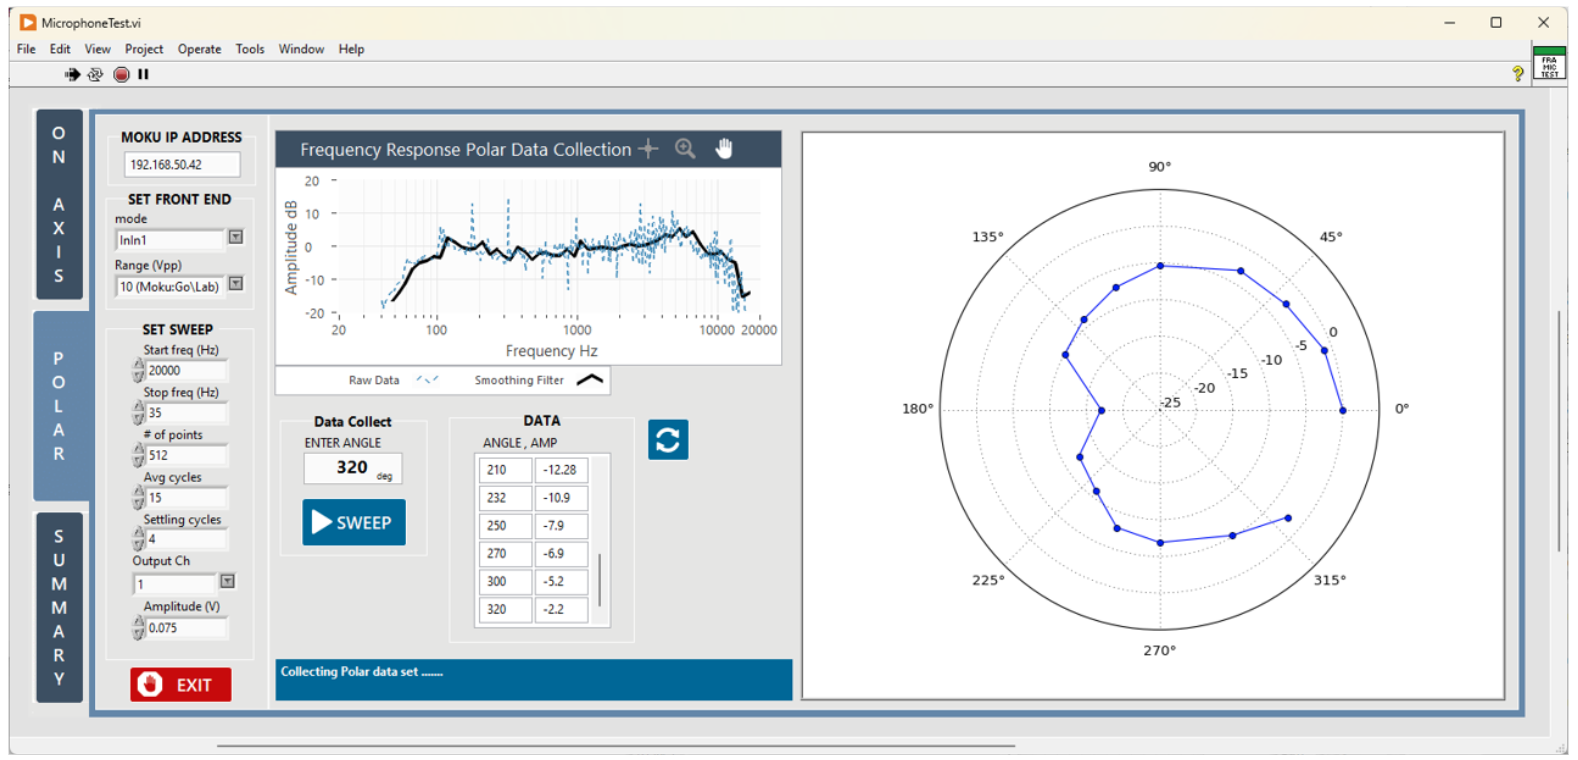
Figure 5: LabVIEW GUI, POLAR mode
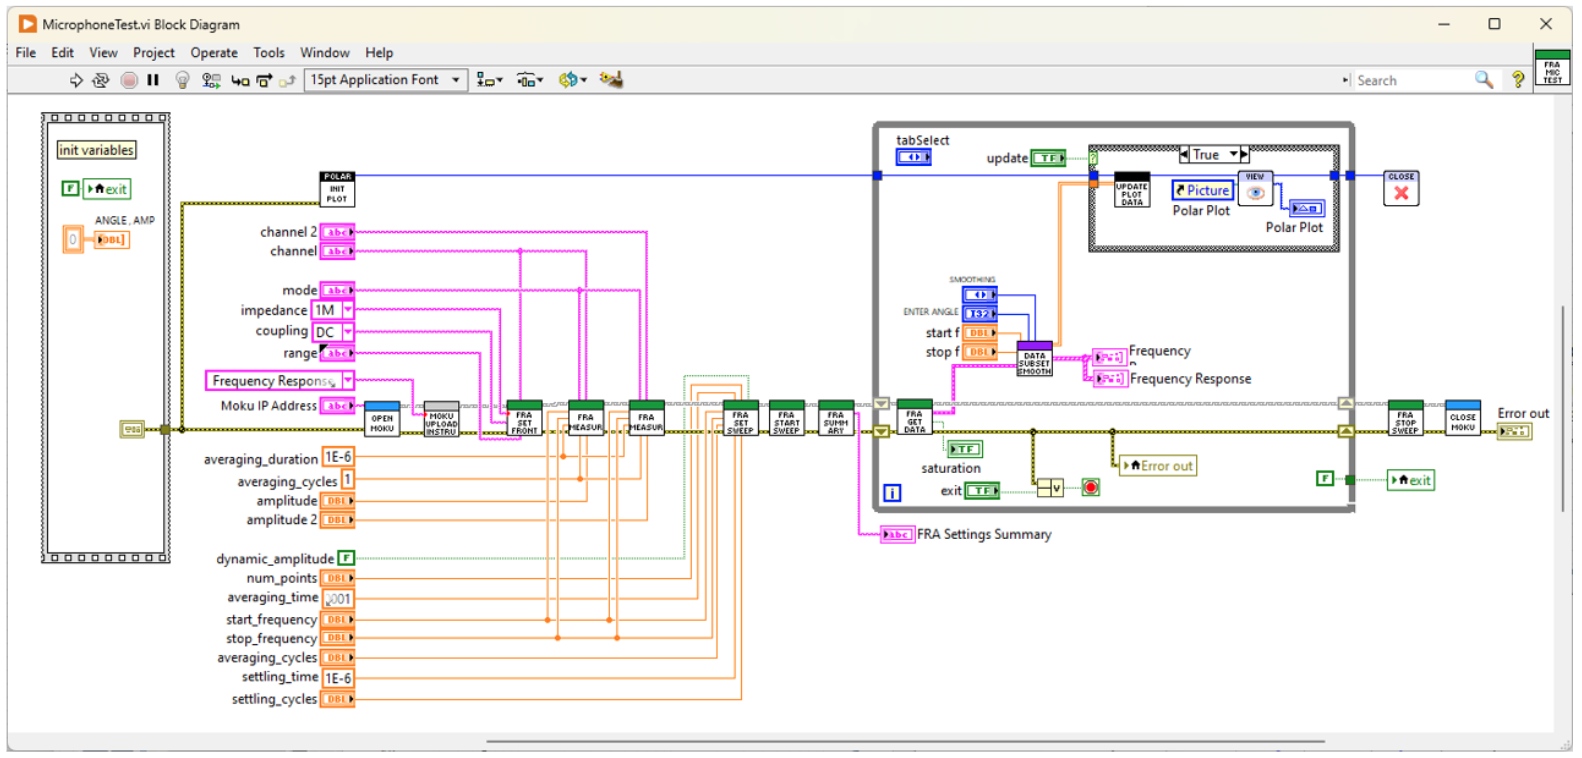
Figure 6: LabVIEW block diagram
Automating the measurements
While manual data collection is valuable for establishing a proof of concept, automation is key to achieving more efficient and consistent measurements. In part two of this experiment, we will implement a stepper motor to rotate the microphone during data collection via LabVIEW. This automation will streamline the measurement process, reducing human error and saving valuable time.
Conclusion
In this blog, we have shown the first steps of using the Moku:Go Frequency Response Analyzer to programmatically characterize and verify a device under test using LabVIEW. Starting with manual data collection, we verified our setup’s accuracy and replicated the microphone’s frequency response and polar pattern. Come back for part two to learn how to fully automate the procedure for a hands-off, streamlined approach to testing and data acquisition.
Looking for more information on automating the measurements? Check out Part 2 of this experiment.
For more information, click here or contact us at support@liquidinstruments.com.
