






Introduction
In Part 1 of this experiment, we showed the initial steps of how to use the Moku:Go Frequency Response Analyzer to programmatically characterize and verify a device under test (DUT) using LabVIEW. Starting with manual data collection, we verified our setup’s accuracy and replicated the microphone’s frequency response and polar pattern. Now in Part 2, we use a motorized rotation stage to fully automate the directional sensitivity characterization.Instrumentation
We utilized the following materials, seen in Figure 1:- Moku:Go Frequency Response Analyzer instrument
- Loudspeaker: Event PS6
- Reference microphone: Oktava MK-12-01
- Device Under Test (DUT): Royer r-121 microphone
- Preamplifier: Apogee Duet
- Motorized rotation stage
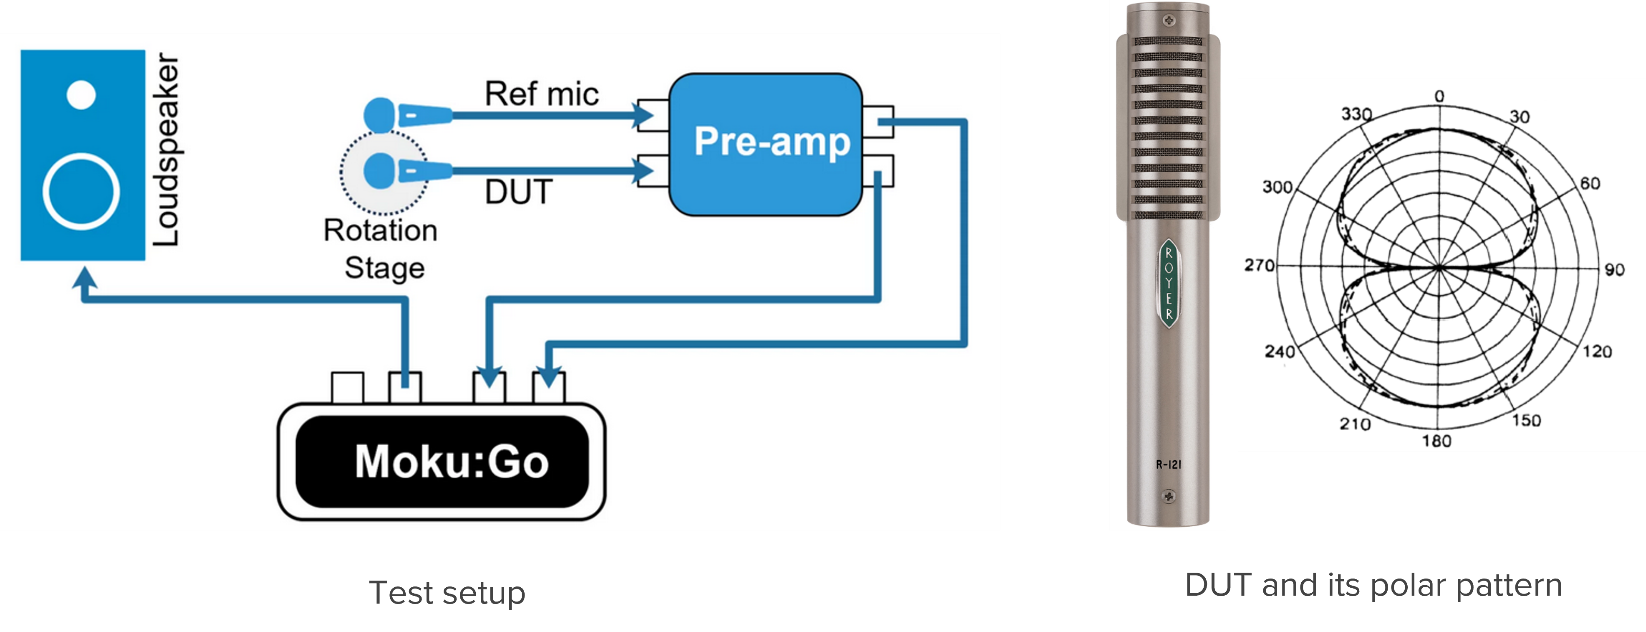
Figure 1: Test setup block diagram and device under test
Automated directionality characterization
To automate the characterization of the microphone’s directionality, we mounted the DUT on a motorized rotation stage. The rotation stage consists of a stepper motor, worm gear, and motor controller. Stepper motors offer excellent speed control, precise positioning, and repeatability of movement, all critical requirements for making reliable and consistent automated measurements. We assembled a plate with a microphone table mount that attaches to the rotation stage (Figure 2), which allows us to rotate the DUT a full 360° in discrete steps.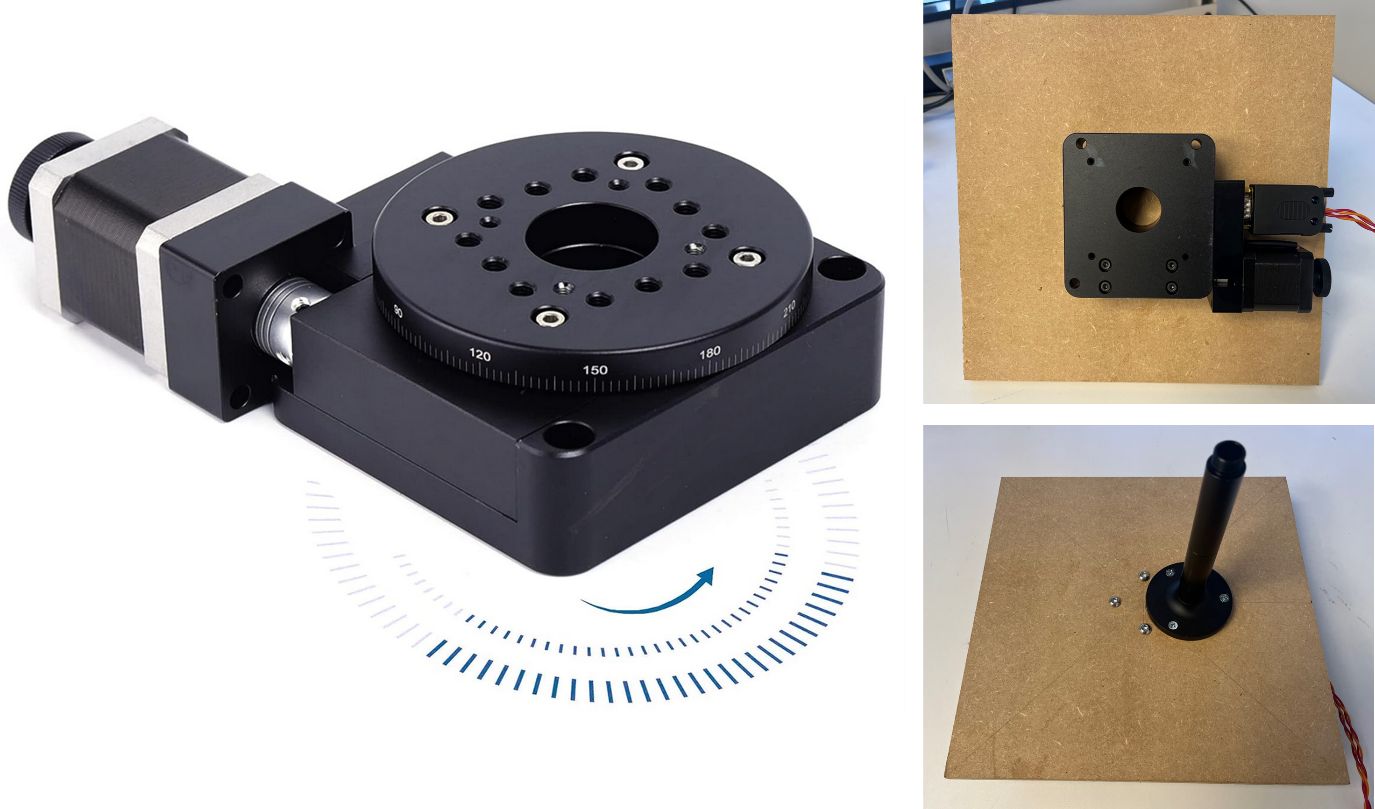
Figure 2: Motorized rotation stage and mounting plate
LabVIEW implementation
The automated microphone characterization program controls the Moku:Go Frequency Response Analyzer, the stepper motor driving our rotation stage, and the live camera feed monitoring the DUT. The program controls DUT rotation, rotating it 360° in 15° increments, measures a sweep at each position, and extracts the value corresponding to 1 kHz before plotting it on the polar plot. For each DUT position, the program updates the frequency response plot. The live camera feed shows the physical rotation of the DUT, and various status messages are displayed on the front panel (Figure 3).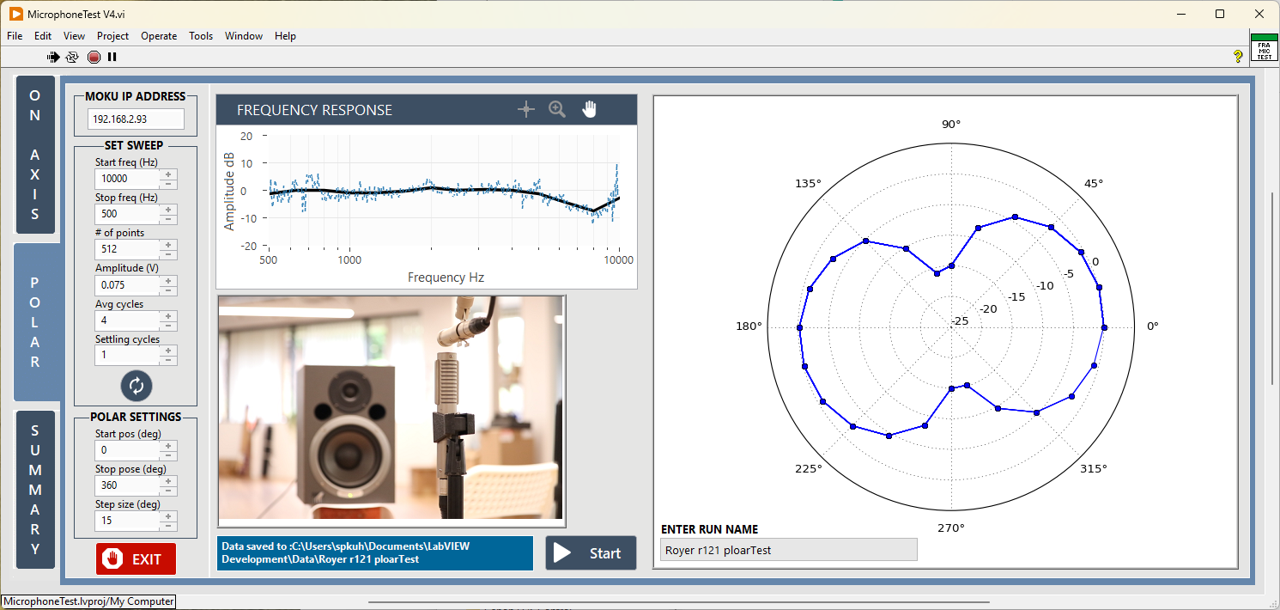
Figure 3: LabVIEW graphical user interface
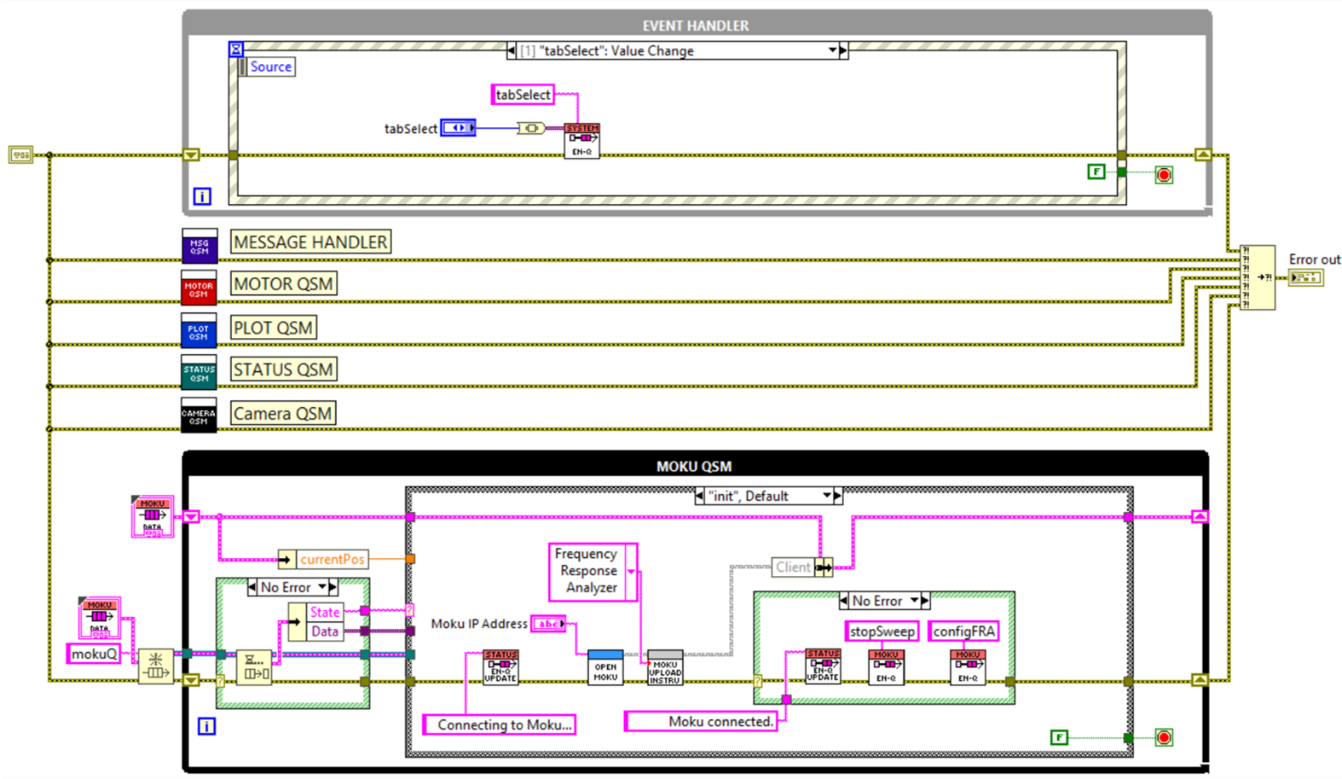
Figure 4: LabVIEW block diagram
- Event handler – handles events triggered from the GUI
- Message handler – passes messages between the event handler and queued state machines (QSMs) and between the QSMs themselves
- Motor QSM – controls the stepper motor driving the rotation stage
- Plot QSM – receives data from the Frequency Response Analyzer (FRA) measurement and updates the polar plot
- Status QSM – relays status messages from the state machines to the front panel
- Camera QSM – monitors the DUT with a real time video feed
- Moku QSM – drives the loudspeaker, measures the reference mic and DUT response simultaneously, sends data to the Plot QSM, and has additional data processing including 1/3 octave smoothing and extracting amplitude value corresponding to 1 kHz
Test sequence overview
1. Moku FRA initiates a sweep (Moku QSM) 2. Moku FRA Measures the response (Moku QSM)- Stops the sweep (Moku QSM)
- Sends data to the plot (Plot QSM)
- Tells the motor to go to the next position
- Tells the FRA to start sweep (Moku QSM)
Output data
The program saves the following data:- Frequency response raw data for each measurement position
- Polar plot data
- Polar plot
- FRA instrument settings
Results
The DUT is a Royer R-121 bidirectional ribbon microphone. It has a figure-8 polar pattern, which means that it’s equally sensitive to sound picked up from the front and back of the microphone, and not as sensitive to sound coming in from the sides. Figure 5 shows a detailed view of the polar plot. A clear figure-8 polar pattern is visible, which is the expected result for this microphone. Also as expected, it appears to be equally sensitive to sounds picked up from the front and back of the microphone, but not as sensitive to sounds picked up from the sides. There is an approximate 15 dB attenuation from sound coming into the microphone from the sides.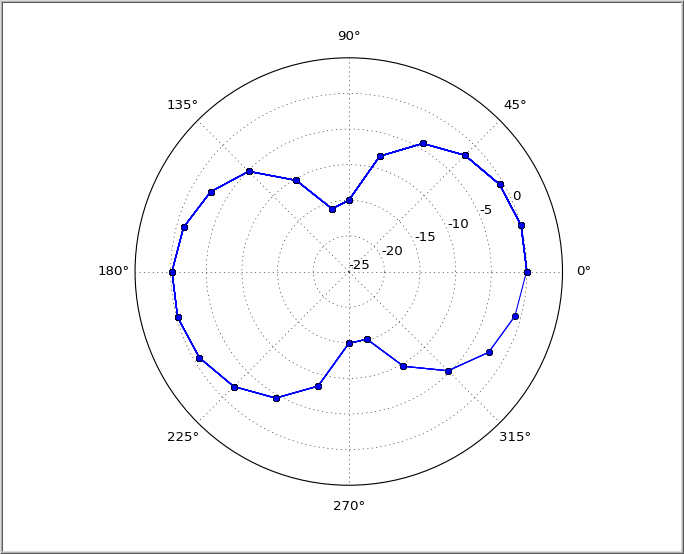
Figure 5: DUT polar plot