






This recap and Q+A complement our webinar, Measuring single-photon events with reconfigurable, FPGA-based instrumentation, which we co-hosted with Laser Focus World on April 15, 2025. If you weren’t able to attend live, you can register now for on-demand access here. In addition to a webinar summary, we’re providing in-depth answers to select audience questions below.
Webinar recap
During this presentation, we gave an overview of photon counting, both in terms of physical setup and potential applications, including advantages, challenges, and critical requirements. We introduced the FPGA-based Moku platform and its reconfigurable suite of test and measurement instruments, focusing on the Moku Time & Frequency Analyzer, which can act as an efficient photon counting solution due to its combination of high data throughput, parallel processing, and zero dead time. In a live demonstration, we deployed the Time & Frequency Analyzer alongside other instruments using Multi-Instrument Mode. First, we generated a sequence of digital data and encoded it onto a pulsed carrier wave through pulse-position modulation (PPM), after which we detected and decoded the waveform with the Time & Frequency Analyzer. For the second demo, we simulated a Hanbury-Brown-Twiss setup using electrical pulses and an Arduino Uno. We observed the histogram populate in real time and showed how to collect export timestamped data using the Time & Frequency Analyzer.
Questions from the audience
Why, exactly, is measuring single-photon events more accurate, especially in applications such as long-distance LiDAR?
In LiDAR, information is encoded in either the modulation of amplitude, phase, or frequency (for a continuous source), or the spacing of pulses (for a pulsed source). When traveling over short distances, the fidelity of the returning signal is generally high. However, when sending information over long distances, the signal is subject to heavy interference from the atmosphere, attenuating the return power to low levels. When using an analog detector in this case, it can be overwhelmed by background noise, from both thermal processes and any amplifiers present. This approach results in a poor SNR and can make coherent demodulation difficult. By contrast, single-photon detectors only “click” when they detect a real photon event, eliminating the input noise introduced by the analog-to-digital converter. Detecting single photons also allows for accurate timestamping, the ability to “gate” signals — listening for a signal only when you expect it, and the ability average over many iterations. These factors can increase the SNR compared to coherent demodulation methods.
In quantum optics, there is the g2 parameter that measures auto-correlation effects (coincident rate). Can you comment about how to quantify the g2 parameter?
The second-order correlation function, g2(𝜏), measures the probability of detecting two photons separated by a time delay 𝜏, which is normalized to the value expected from uncorrelated photons. The value at 𝜏=0 is of particular importance, as this can infer information about the light source. For example:
- If g2(0) > 1, then the light source tends to emit photons in groups. This is called bunching behavior, and is usually indicative of a thermal light source.
- If g2(0) < 1, then the light source tends to emit photons at regular intervals, with very little chance of emitting more than one at a time. This is called antibunching behavior, and is a desirable trait for single-photon sources.
- If g2(0) = 1, then there is no correlation between emitted photons. This is usually true of a coherent light source, such as a laser.
You can read more about the autocorrelation function in our Hanbury-Brown-Twiss configuration guide. As to how to calculate the g2(𝜏) function for a given HBT data set, this information can be obtained through a histogram of the coincidence rate, C(𝛕), as well as the total number of separate events recorded by detectors A and B. The formula for g2(𝜏) as a function of delay time 𝜏, is given by:
\(g^2(tau) = frac{C(tau)T}{N_a N_b Delta tau}\)Where C(𝛕) is the number of coincidence events that occur within the bin centered on delay time 𝛕, is the width of the bin in units of time, T is the total length of the measurement in time, and NA and NB are the total number of individual events captured at detectors A and B, respectively. To perform this using the Moku Time & Frequency Analyzer, you can use the embedded Data Logger to generate a list of timestamped Events A and B. You can then export this data to your host PC, where you will need to define your bin width as well as calculate the coincidence rate for each time bin. With enough events, this should give you an estimate of the autocorrelation rate of your source.
For Hanbury-Brown-Twiss measurements, can you use a sync pulse with the paired detectors for triggering? Does that require three input channels from Moku:Pro, or can Moku:Go and Moku:Lab also be used for this?
Yes, you can use a sync pulse. In fact, you may not need to use the third analog channel at all, as both Moku:Pro and Moku:Lab feature a TTL trigger input on the reverse side, which could be used for triggering the capture as well. Moku:Go, unfortunately, does not support a TTL trigger input, so you would be limited to one input channel. There are a couple ways to integrate this trigger into your measurements with the Time & Frequency Analyzer. If you’d like to measure the time from your trigger event to one of your photon events, from the Events tab you can set the input source to “Ext. trig.” for any one of Events A through D, as shown in Figure 1.
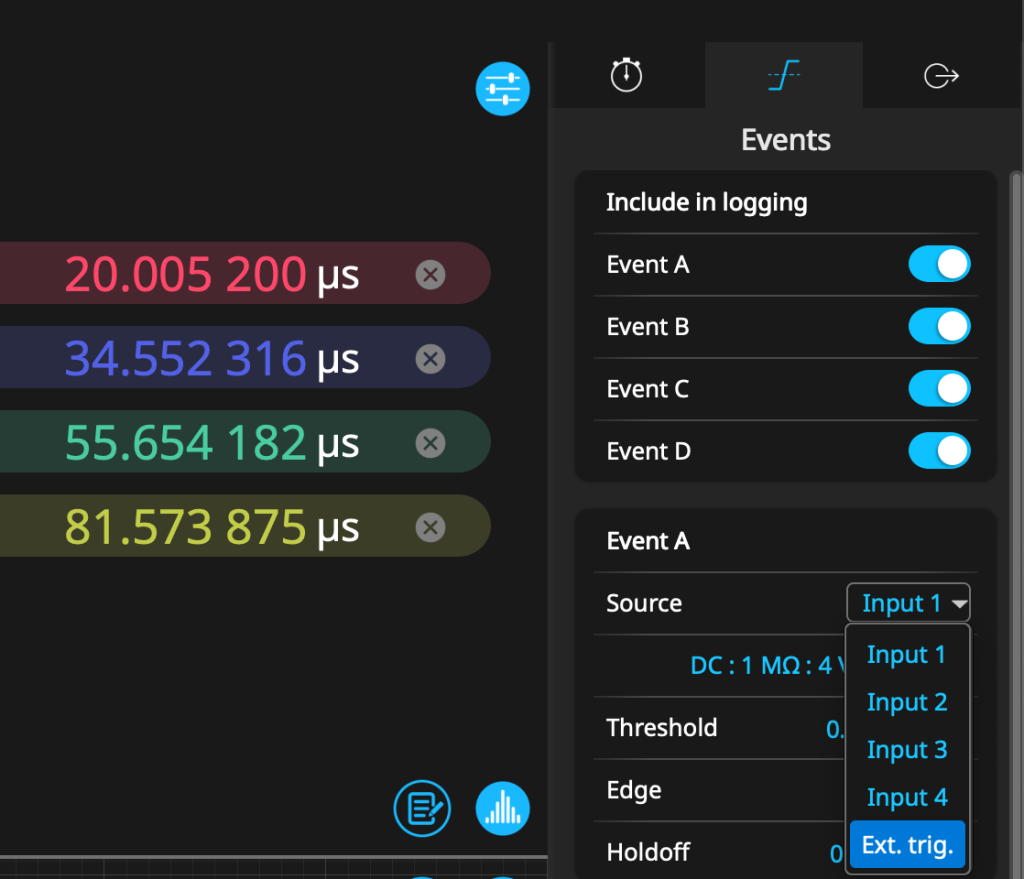
Figure 1: Events in the Time & Frequency Analyzer can be sourced from the external trigger input, as well as any of the analog input channels. If you want to only capture events that happen within a trigger window, you can navigate to the “Intervals” tab and set the acquisition mode to “Gated.” The source of this gate can be any of the analog inputs, or the external trigger, as shown in Figure 2. You can also adjust the gate threshold as needed.
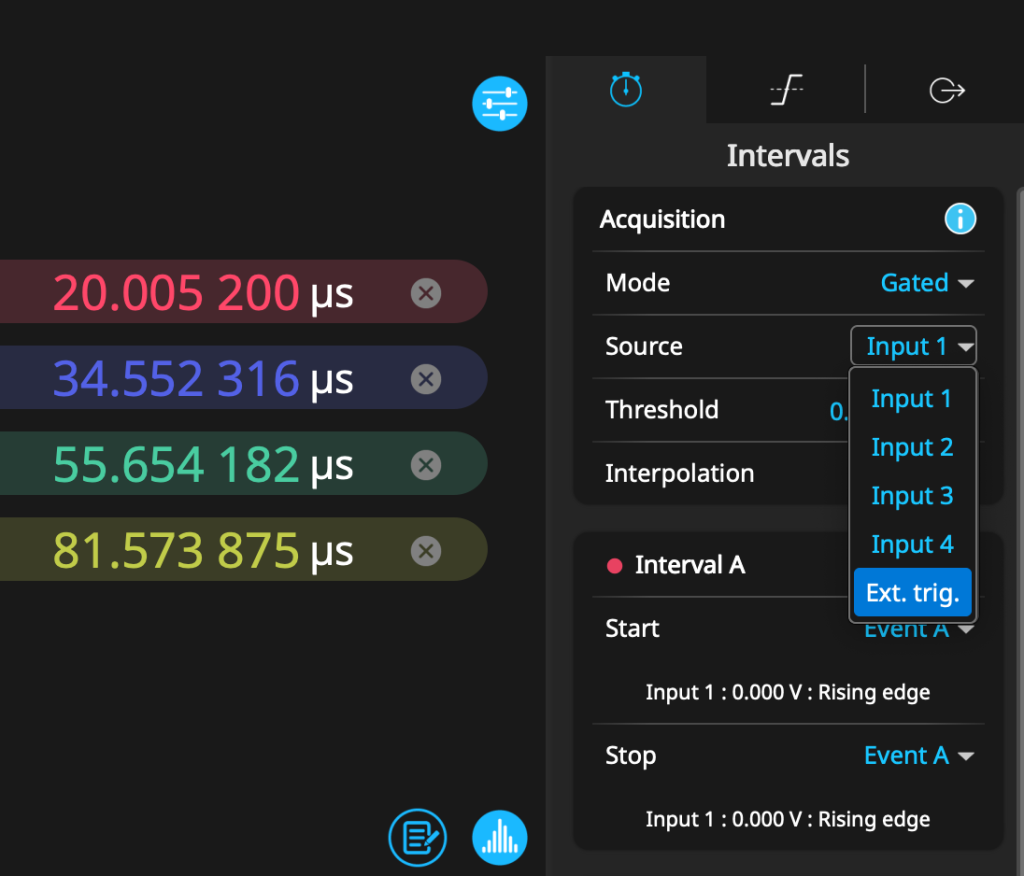
Figure 2: In addition to continuous and windowed mode, the Time & Frequency Analyzer supports gated mode, where events are only captured as long as the applied gate is active.
What factors limit the maximum event rate?
The Moku Time & Frequency Analyzer has two maximum event rates specified: one for burst logging and one for sustained logging. For sustained logging, the event rate of 10 MSa/s is primarily limited by the write speed to the Moku:Pro SSD — not from any physical limitation of the FPGA itself. The maximum burst rate of 312.5 MSa/s (for Moku:Pro) is more interesting to examine. The ADC on the Moku:Pro frontend has a maximum sampling rate of 1.25 GSa/s. However, at least two samples must be recorded for each event, as Moku uses linear interpolation to precisely determine the timestamp. If you want to read more about this process, check out our application note on the topic. This interpolation sequence puts a hard cap on the event logging rate. Due to the way the DSP algorithm is implemented, the actual cap on the event logging rate ends up at one event per four ADC samples — in the case of Moku:Pro, 312.5 MSa/s.
Is metastability an issue, since, in the real world, you will trigger on external events asynchronous to your clock? How do you handle this in your instruments?
Metastability refers to a common issue with FPGAs where a given register receives an input very close in time to the next occurring clock edge. Since the input does not “settle,” before the clock flips, this can cause the FPGA to exhibit strange behavior. These are known as “metastable” states, where the register is not well defined to be either zero or one. In photon counting this can be a concern if you are passing asynchronous digital signals directly to the FPGA, as these events are random — it is more than likely an event will eventually occur in close proximity to the edge of the clock. This could cause data loss or inaccurate time stamping. In Moku’s case, the TTL signals originating from some single-photon detectors are first passed through the analog frontend. Even though they are technically “digital,” they are treated as analog signals by the ADC and digitized accordingly. Since the ADC samples synchronously with the system clock on the FPGA, all timing is controlled and metastability is not an issue for the Moku Time & Frequency Analyzer. Thank you for viewing our webinar. We look forward to seeing you again. For more insightful demonstrations, check out our webinar library for on-demand viewing.
More questions?
Get answers to FAQs in our Knowledge Base
If you have a question about a device feature or instrument function, check out our extensive Knowledge Base to find the answers you’re looking for. You can also quickly see popular articles and refine your search by product or topic.
Join our User Forum to stay connected
Want to request a new feature? Have a support tip to share? From use case examples to new feature announcements and more, the User Forum is your one-stop shop for product updates, as well as connection to Liquid Instruments and our global user community.