






A time and frequency analyzer is a versatile instrument that can accurately measure time intervals between events. These events are typically time-varying voltage signals or pulses, and the instrument starts or stops recording an event when the input voltage reaches a given threshold. A key feature of time and frequency analyzers is their ability to provide high-resolution measurements (often in the picosecond range) of the duration of such events. Because they can count the number of these events as well, these instruments are sometimes referred to as counters or time interval counters. In the frequency domain, a time and frequency analyzer can use the time interval information to calculate the instantaneous frequency and deviation of a signal. Is a time and frequency analyzer the same thing as a frequency counter? The time and frequency analyzer is a flexible, general-purpose instrument that combines several powerful functions sometimes associated with other instruments. Instruments that can count and analyze time intervals are sometimes called time interval analyzers, time interval counters, or event counters. Instruments that are primarily used for measuring frequency stability and phase noise are more commonly known as frequency counters or frequency analyzers. An instrument that can do all or most of these functions is sometimes called a universal counter. The time and frequency analyzer falls under the last category.
What types of measurements do time and frequency analyzers perform?
Oscillator characterization: By measuring the time differences between successive events, this instrument can calculate the frequency of event occurrence. With instantaneous frequency information, the time and frequency analyzer can determine the stability of an external frequency clock, also known as an Allan deviation measurement. Jitter and phase noise analysis: Jitter refers to the short-term, random variance in the period of an electrical signal. Its frequency-domain counterpart is called phase noise, as random fluctuations of the period will result in frequency broadening. Jitter is a critical parameter for many RF and electronic devices, as it determines the reliability of signals transmitted and received by these devices. Time and frequency analyzers can measure jitter using statistical analysis, plotting the time intervals between successive events in a histogram format. Photon counting: In quantum optics applications, photons are produced by physical systems such as lasers, atoms, or spin ensembles. Knowing the second-order correlation statistics of these emitted photons can give insight into the nature of the light source. Photon counting applications typically use a time and frequency analyzer in conjunction with one or more photodetectors to convert the incident photon to an electrical signal. Radar and LiDAR: From radio waves to visible light, the ability to precisely measure the time between light pulses is critical in these applications. The distance to an object is determined by the time it takes for a pulse to return after reflecting off the object. The precision in measurement of distance, speed, and shape of the object in question is directly related to the precision in time measurement, making a high-precision time and frequency analyzer a necessity. Crystallography: As with radar and LiDAR, a time and frequency analyzer can be used in crystallography to measure time intervals between the arrival of X-ray photons at a detector. The correlation of arrival times in response to certain stimuli can be used to investigate the dynamics of molecular structures and reactions at the atomic level. Pulse-width modulation (PWM): PWM is a technique used to encode information by varying the widths of a pulse sequence based on the amplitude of a signal, and is also commonly used to regulate the power sent to devices such as motors or LEDs. Time and frequency analyzers can be used to monitor and measure the exact duration of each pulse, allowing the signal to be decoded from the PWM sequence for validation.
What are the key parameters of a time and frequency analyzer?
Time resolution (~ps to ~ns): This time interval is the smallest that can be accurately resolved by the instrument in a single measurement. It is usually referred to as single-shot time resolution to indicate that the instrument can achieve this resolution within a single occurrence, with no averaging. Frequency resolution (digits/s): In frequency analysis mode, the resolution is usually given as a number of digits per second. This number refers to how much precision can be attained within a given time window. For example, a resolution of 12 digits/s can determine frequency with 12-digit accuracy over a collection window of one second. If the measurement window were reduced to 1 ms, then the frequency could only be measured with an accuracy of 9 digits. Input sensitivity and range: This value represents the minimum and maximum amplitude that can be reliably measured by the instrument. Events with an amplitude lower than the sensitivity range may not be detected. Bandwidth or frequency range: Usually measured in megahertz (MHz), the bandwidth represents the minimum and maximum frequency for which the time and frequency analyzer can accurately detect events. Measurement rate: Time and frequency analyzers can time tag events, which means that a timestamp is attached to each event as it occurs. While this process is useful for subsequent analysis of the data, the precision required for accurate timestamping limits the data throughput rate. Usually, the maximum number of samples that can be written to the memory (or streamed to a PC) is specified on the datasheet. Dead time: The dead time of a detector is the minimum amount of time by which two events can be resolved. If an event occurs within the dead time, the detector will not count in. Large dead times can have adverse effects on the total count of events from a system, especially if they are randomly distributed in time.
An all-digital, FPGA-based time and frequency analyzer
The Moku Time & Frequency Analyzer is the newest of the 14 instruments available for all FPGA-based Moku devices. It functions as a standalone instrument, or works alongside other Moku instruments in Multi-instrument Mode for maximum efficiency. It offers a diverse array of features that replace the functionality of traditional time interval analyzers, frequency counters, universal counters, and others. This versatility allows users to perform a broad range of functions such as photon counting, phase noise, or LiDAR measurements. Events are specified by a voltage threshold and whether they are triggered on a rising or falling edge. The Moku Time & Frequency Analyzer can then count the time interval between any two events, as well as plot a lossless histogram of the data in real-time (Figure 1). The instrument also can calculate instantaneous frequency information and keeps a running total of events. On the output side, it can produce a voltage proportional to either the total number of events or the time interval itself, which is useful for applications involving active feedback loops. All of these features can easily be controlled with the click of a button through the Moku:app, or integrated into existing code via the Moku Python API.
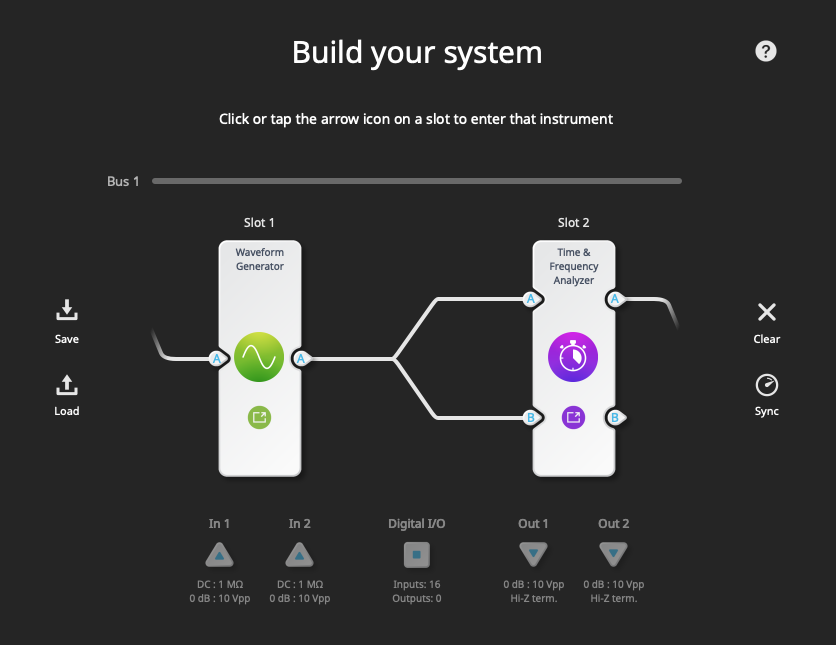
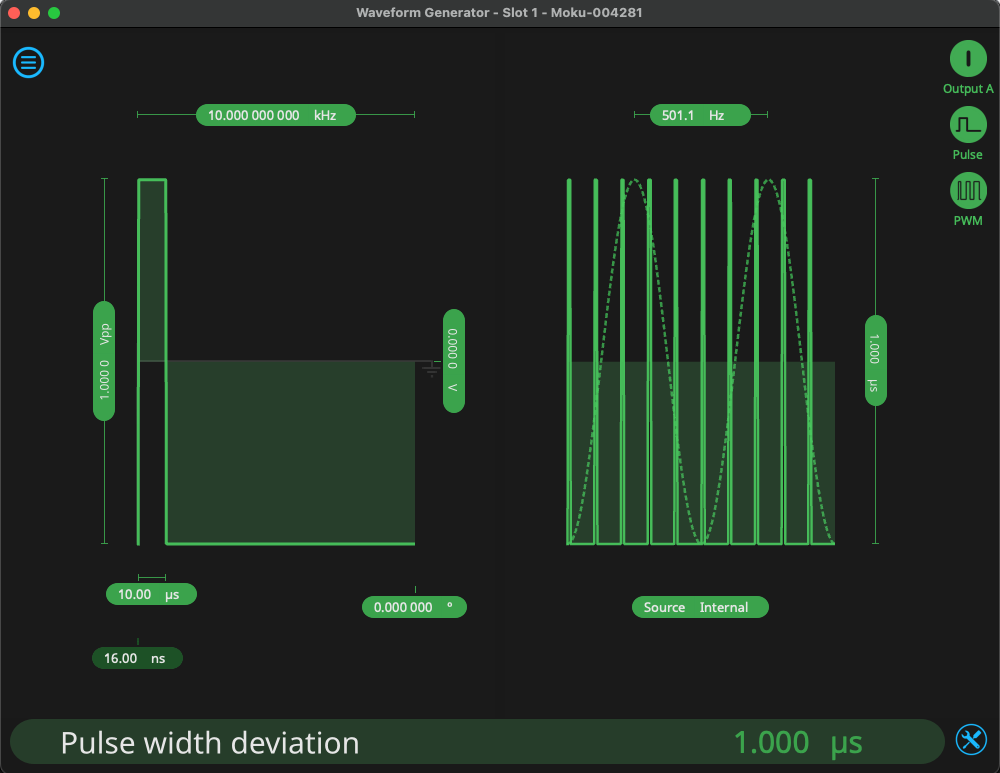
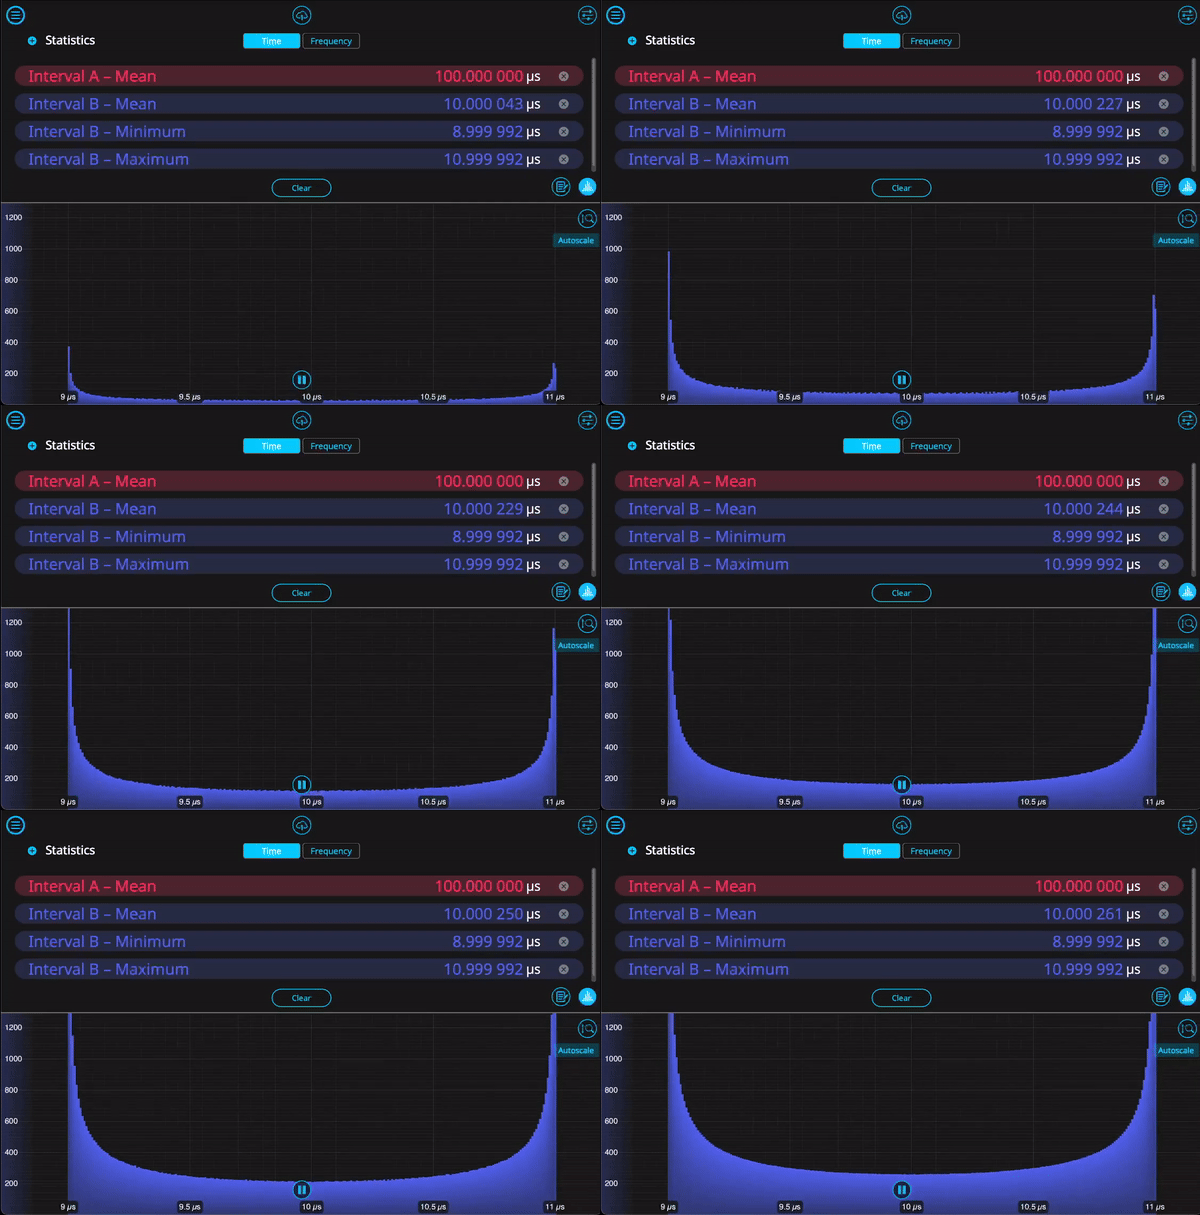
Figure 1: The Moku Time & Frequency Analyzer being used in Multi-instrument Mode. Top: The Moku Waveform Generator and Time & Frequency Analyzer in the instrument select screen. Middle: The Waveform Generator creates a pulse-width modulated sequence, which is in turn measured by the Time & Frequency Analyzer. Bottom: The Time & Frequency Analyzer can make time-interval measurements between any combination of events, as well as event counts and event rates. It can also plot a histogram of the time intervals. The results of the pulse modulation are seen in blue on the bottom of the screen.
Choosing a time and frequency analyzer
A time and frequency analyzer can perform a wide array of measurements, ranging from time interval and frequency characterization to more specialized applications such as phase noise analysis and photon counting. Because this flexible instrument can measure time differences with high resolution, count events, and calculate instantaneous frequencies, it is a valuable tool to maximize efficiency across a range of scientific and technological fields. With the new Moku Time & Frequency Analyzer, the reconfigurable, FPGA-based Moku platform continues to evolve in functionality, helping maximize precision and flexibility for professionals in complex research and engineering applications. For more information, see our white paper on the Moku Time & Frequency Analyzer, or take a look at our visual guide for example use cases.
Questions?
Get answers to FAQs in our Knowledge Base
If you have a question about a device feature or instrument function, check out our extensive Knowledge Base to find the answers you’re looking for. You can also quickly see popular articles and refine your search by product or topic.
Join our User Forum to stay connected
Want to request a new feature? Have a support tip to share? From use case examples to new feature announcements and more, the User Forum is your one-stop shop for product updates, as well as connection to Liquid Instruments and our global user community.