






This article details how Moku:Pro is used to precisely measure and minimize ion oscillations (micromotion) in advanced atomic clocks, using the Time & Frequency Analyzer instrument.
If you are familiar with an atomic clock, it’s probably due to the fact that a global array of more than 80 such clocks make up the basis for coordinated universal time (UTC). The concept of an atomic clock is now synonymous with “precision,” and the very best atomic clocks reach fractional uncertainties at the 19th decimal place. In order to achieve this precision, one has to characterize and control a variety of external perturbations, including electric and magnetic field noise, surrounding black body radiation, and any coupling which causes the “clock” atoms to gain motional energy. The ability to anticipate and correct for these types of frequency-shift-inducing effects is critical to maintaining the accuracy and stability of atomic clocks. At Colorado State University, the group of Christian Sanner [1] performs research on trapped-ion based optical atomic clocks. Part of their work involves ensuring that all external perturbations are kept to a minimum. For this they use Moku:Pro, an FPGA-based device that delivers a reconfigurable suite of test and measurement instruments. Leveraging the Time & Frequency Analyzer, they are able to check the residual motion of trapped ions, and apply the appropriate corrective measures to minimize it.
The challenge
To trap ions, one typically starts with neutral atoms and removes an electron with laser energy. Once ionized, the atoms feel strong electric forces due to the electric potential created by the ion trap electrodes. A configuration of time-varying AC and DC potentials (“Paul trap” with typical drive frequencies in the RF range of tens of MHz) makes it possible to trap ions in free space. The ions are then brought to sub-mK temperatures via a method called Doppler cooling. In this process, the ions are exposed to a velocity-dependent light force, leading to a net energy loss. Figure 1 shows an ion trap apparatus surrounded by optics for Doppler cooling and fluorescence detection.
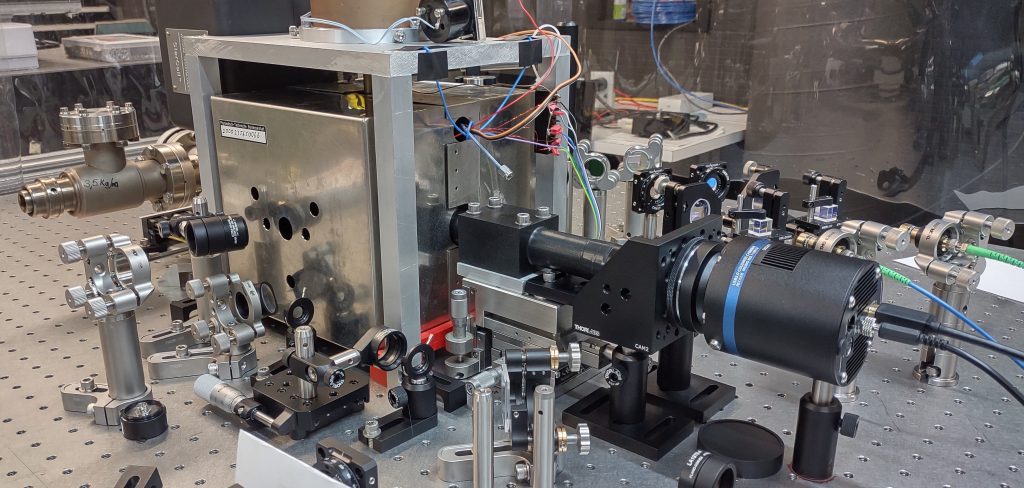
Figure 1: An ion trap apparatus. Photograph courtesy of Christian Sanner, Colorado State University.Ideally, the trap’s time-varying electric fields will confine the ion at a point where the AC and DC fields vanish. In practice, however, any stray electric field present nearby can displace the ion from the ideal trap center, in which case the applied RF causes the ion to oscillate within the trap — also known as micromotion. This has adverse effects on the performance of the system; for an optical ion clock it leads to unwanted Stark shifts and time dilation shifts of the transition frequency. Since it is impossible to completely remove stray electric fields, researchers typically apply additional compensation fields to offset the perturbations introduced by the stray fields. However, the issue remains of how to detect if an ion is undergoing micromotion in the first place. That’s where Christian Sanner and his team introduced the Moku Time & Frequency Analyzer to precisely measure the residual amount of micromotion.
The solution
A wide variety of micromotion detection methods have been developed over the last 30 years. Some of them rely on the same concepts on which Doppler cooling operates. For instance, “photon correlation” methods [2, 3] detect trap-drive-synchronous ion fluorescence modulation. In the case of improperly compensated stray fields, such a modulation arises in the light scattered from an ion during Doppler cooling due to the micromotion-induced Doppler shift and the corresponding photon scattering rate modulation. In other words, scattering of the red-detuned laser cooling light will increase if the ion is approaching the laser beam during a micromotion half-cycle and will decrease when the atom is moving away from the light source during the other half-cycle. A convenient configuration for implementing this cross-correlation measurement, used by the CSU team, can be seen in Figure 2. The Moku Time & Frequency Analyzer essentially performs lock-in detection of discretized photon scattering events by repeatedly measuring the time interval between the detection of a scattered photon and the next zero-crossing of the trap drive RF signal.
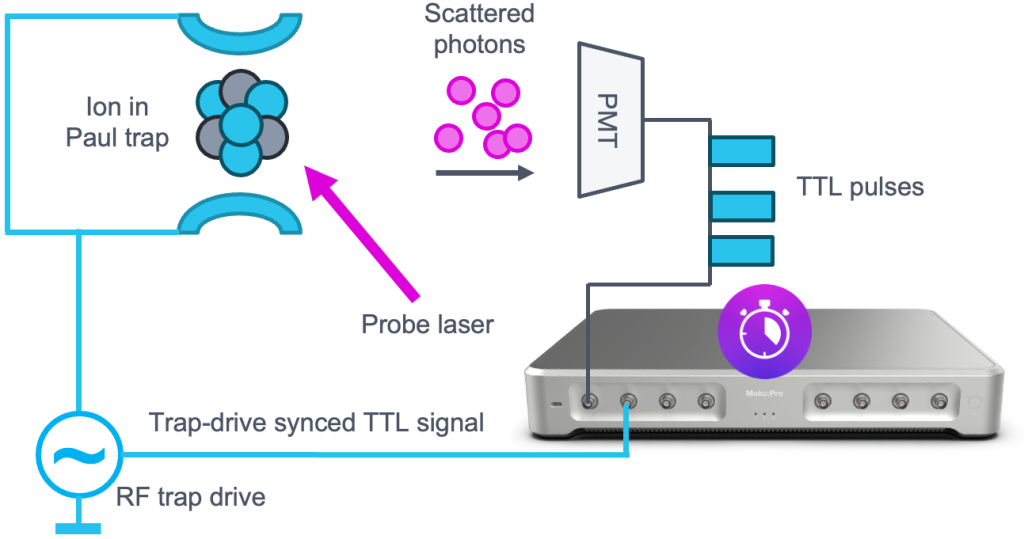
Figure 2: Schematic of the cross-correlation measurement setup with the Moku Time & Frequency Analyzer instrument. Photons scattered on the ion are collected on a photomultiplier tube (PMT), which sends for each detected photon a TTL pulse to the Moku instrument.
The result
By building up a histogram of the measured time intervals one can reveal trap-drive-synchronous ion fluorescence modulation and therefore quantify the micromotion amplitude. Two example histograms are shown in Figure 3. If the micromotion in the trap is small, then the distribution of photon events within a trap drive period will be relatively flat (Figure 3a). If the system has large micromotion, then the photon detection events are non-uniformly distributed. The histograms generated by the Time & Frequency Analyzer allowed the team to detect the micromotion in the trap in real time. With this information, they apply compensation fields to cancel out the deleterious effects of stray electric fields and view the results. When the micromotion reached an acceptable level, they could then proceed to the next stage of their optical ion clock experiments.
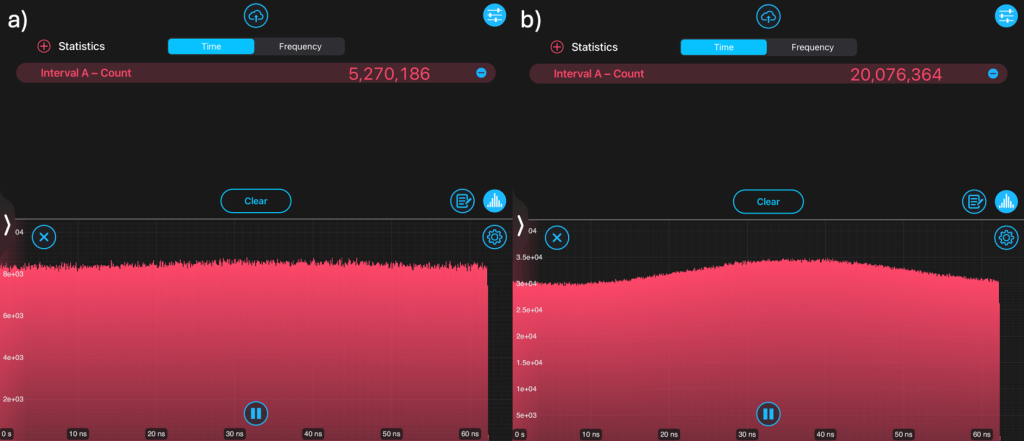
Figure 3: Moku Time & Frequency Analyzer results. a) Photon detection histogram for an ion trap with small micromotion (good compensation). b) Detection histogram for an ion trap with larger micromotion, showing pronounced trap-drive-synchronous fluorescence modulation. In the future, the Sanner Lab has plans to incorporate other instruments, such as the Neural Network, into their research. Alongside the Time & Frequency Analyzer, the Moku Neural Network could help further improve the efficiency of laser cooling and optical clock interrogation sequences.
References
[1] Colorado State University Department of Physics. https://www.physics.colostate.edu/christian-sanner/ [2] [1]D. J. Berkeland, J. D. Miller, J. C. Bergquist, W. M. Itano, and D. J. Wineland, “Minimization of ion micromotion in a Paul trap,” Journal of Applied Physics, vol. 83, no. 10, pp. 5025–5033, May 1998, doi: https://doi.org/10.1063/1.367318. [3] J. Keller, H. L. Partner, T. Burgermeister, and T. E. Mehlstäubler, “Precise determination of micromotion for trapped-ion optical clocks,” Journal of Applied Physics, vol. 118, no. 10, Sep. 2015, doi: https://doi.org/10.1063/1.4930037.