Abstract
In part 1, we introduced Dual Frequency Resonance Tracking (DFRT) as an alternative to established resonance tracking techniques, such as phase-locked loops (PLL). For some resonators, there is an abrupt phase shift at resonance, making a PLL sub-optimal for this task. Resonance tracking is becoming increasingly important, especially for systems like piezo response force microscopy (PFM), which rely on precision resonance tracking to drive a cantilever to extract the cleanest image. Micro-electromechanical systems (MEMS) are another type of system that require precise resonance tracking to validate fabrication and optimize performance.
In Part 2, the DFRT method is tested on a crystal resonator, where the changes in resonance are on the order of hundreds of hertz for a typical frequency stability of +/- 50 ppm (parts per million) from the nominal frequency. Heating the crystal causes the resonance to shift, which can be measured effectively by the DFRT method.
MEMS devices, like MEMS gyroscopes, rely on precision resonance tracking to ensure efficient power consumption. Devices like this rely on oscillating masses that undergo rotation and use the resulting Coriolis force to determine the angular motion. To ensure low power consumption, these masses are driven at their resonant frequency which makes tracking this resonance, and the resulting change, necessary.
Introduction
Precise resonance tracking is becoming more important as new technologies are leveraging the capabilities of crystal resonators in their designs. In some designs, environmental factors can affect crystals, especially heat. Heating a crystal resonator causes the resonant peak to shift, so being able to effectively and quickly track these changes is necessary for certain applications. Traditional resonance tracking methods, such as a PLL, work for most applications but break down under certain conditions. A PLL relies on a constant phase difference between inputs and outputs at resonance, which allows locking onto this phase difference to track the resonant peak. Some resonators have an abrupt phase shift at resonance which makes it difficult for a PLL to keep a constant phase difference. Dual frequency resonance tracking can combat this shortcoming by not relying on phase to track resonance, but by instead using two signals that are above and below resonance in the frequency domain. This allows the DFRT system to constantly compare the amplitudes of these frequency components and tune the waveform generator to make these amplitudes equal. This resonance tracking was tested with a quartz crystal, which is a common type of resonator.
The crystal that was used for this experiment was a 4.096 MHz (nominal) quartz crystal, with a frequency stability of +/-50 ppm. By using a crystal with a small tolerance, the limits of the DFRT can be tested.
Changing resonance in the crystal
In part 1, we configured the Moku FIR Filter Builder as a narrow bandpass filter with a specific center frequency to simulate the behavior of a resonator. By changing the center frequency of this filter, we were able to simulate a deviation in resonance. In part 2, a real quartz crystal is manipulated to change resonance while DFRT tracks the resonant peak.
Crystal resonators are typically very stable and have a very high Q-factor, which is a measure of the quality of the crystal. Under normal conditions, there will be only minimal deviation in the resonant peak. There are certain conditions that will cause the resonant peak to change, such as applying heat to the crystal. Crystal resonators will have working temperatures specified in their datasheets, and crystals typically maintain resonance within tolerance into relatively high temperatures. Continuing to increase the temperature past the specified range will cause resonance to drift outside tolerance.
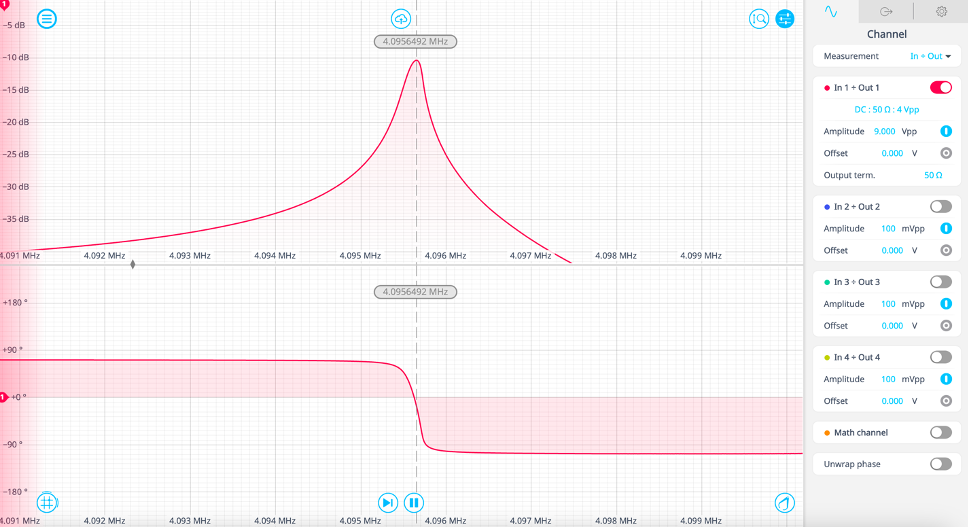
To first verify the resonant frequency of the crystal, the Moku Frequency Response Analyzer (FRA) was used. This tool allows the user to view the frequency response of a device or circuit. The FRA works by sweeping a sine wave over a specified frequency range and plotting the response of the device, as well as plotting the phase shift as a function of frequency. By using the FRA, it’s possible to locate the resonant peak, then compare it to the nominal resonance.
When implementing DFRT, it is important to drive the resonator or cantilever with frequencies on opposite sides of resonance. For example, if the resonant peak was 1 MHz, the resonator could be driven at around 900 kHz and 1.1 MHz to effectively track the changes in resonance. The spacing of the frequency offsets are determined by the expected Q-factor of the crystal. If the spacing is too wide, the response could be too weak or noisy to effectively track resonance. In Figure 1, the actual resonant frequency is 4.0956 MHz, so the frequencies of the drive signal were 4.0951 and 4.096 MHz. Typically, the resonant peak of the crystal is very stable, but it is possible to introduce conditions to shift the resonant peak. Changing the load capacitance of the crystal is one way to alter the resonant peak. Another way to change the peak is to exceed the working parameters listed in the data sheet. The crystal in the experiment has an operating temperature from -10 C to 60 C but was heated to 120 C. This should cause the crystal to behave out of specification. When the crystal is heated, its resonant frequency increases, and by using the DFRT method it is possible to track this change and ensure that the crystal is being driven at resonance.
Dual frequency resonance tracking
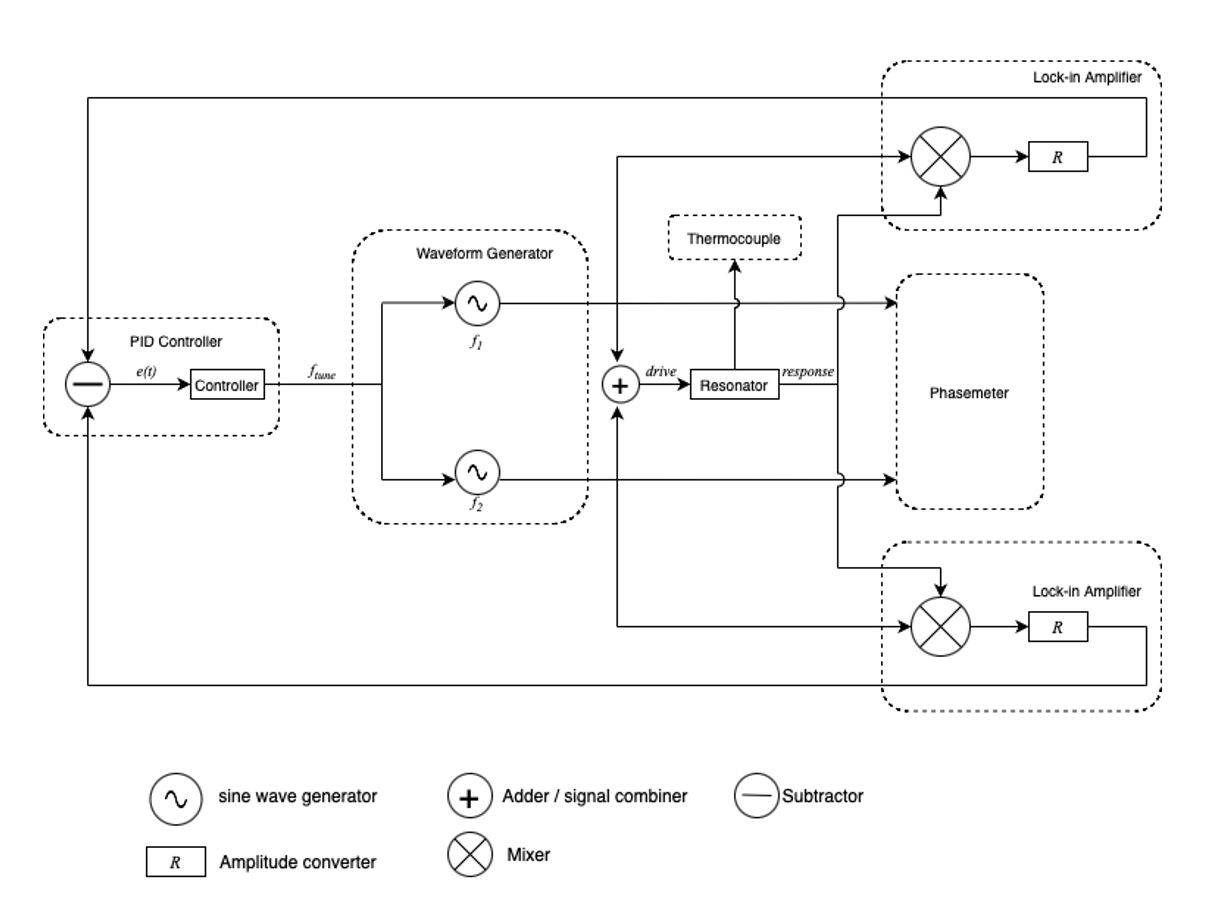
A typical DFRT setup will include two waveform generators to drive the device under test (DUT), two lock-in amplifiers to extract the amplitudes of the resonator response, and some sort of control signal, typically generated from a PID controller, to tune the frequencies of the generated waveforms.
The Moku FRA was used on the crystal to first get an idea of the frequency of the resonant peak. This is done first because it is necessary to drive the resonator with frequency components above and below resonance. Once resonance is known, it is possible to drive the resonator at suitable offset frequencies.
Another consideration is the frequency modulation (FM) depth of the waveform generator. In part 1, the FM depth was +/-1 MHz/V which was appropriate for a resonant peak moving 250 kHz, which corresponds to a voltage level of 250 mV. In the case of the crystal, the resonant peak is moving over a much smaller frequency range. In this experiment, the FM depth used was +/- 9 kHz/V. This was chosen with some preexisting knowledge of the system. It is known that the range of the PID output in this application is +/- 1 V, and this is fed into the waveform generator. The input of the generator has a 10x attenuation, which means that the PID range is +/- 0.1 V. When multiplied by the FM depth, this results in a frequency range of +/- 900 Hz which is a suitable range for a high Q crystal.
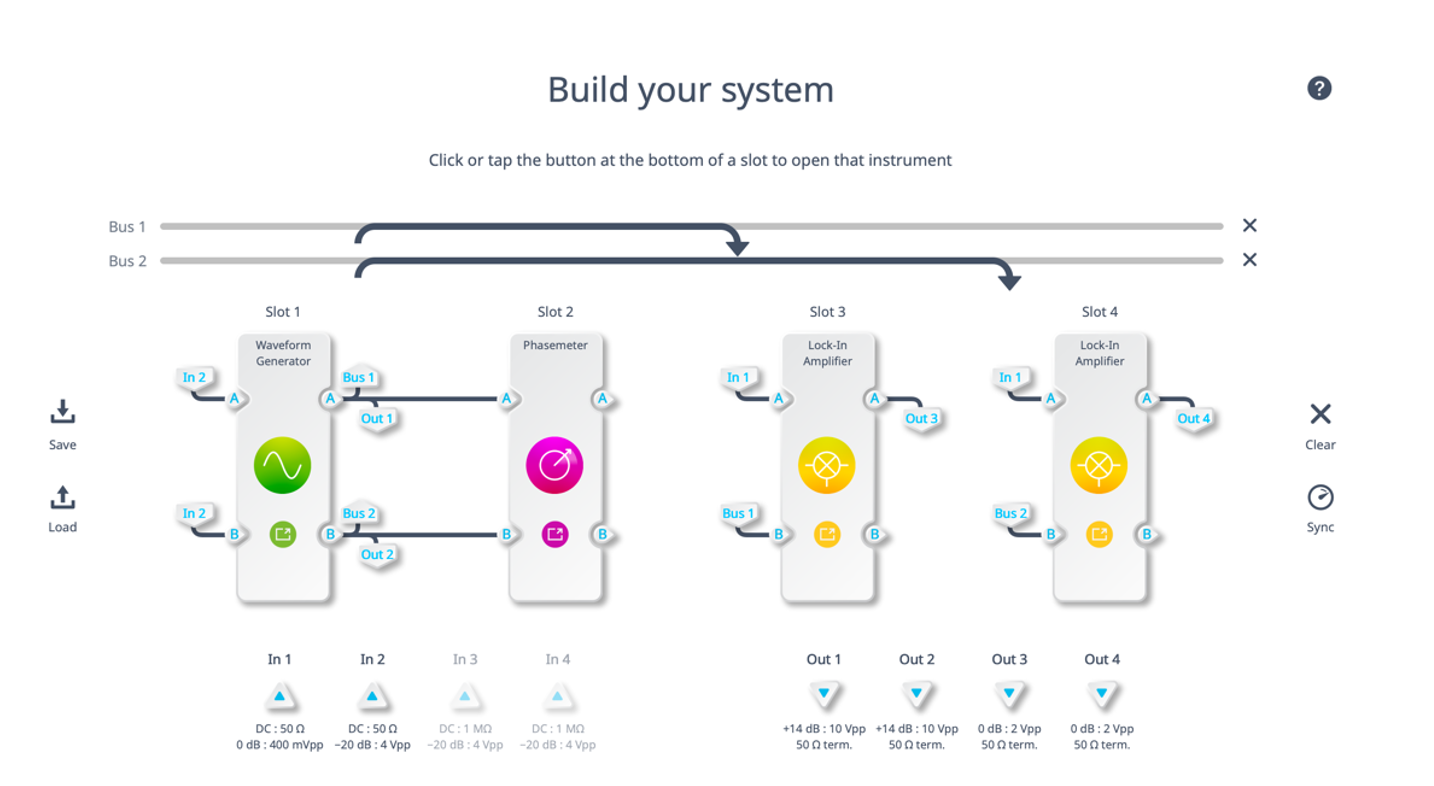
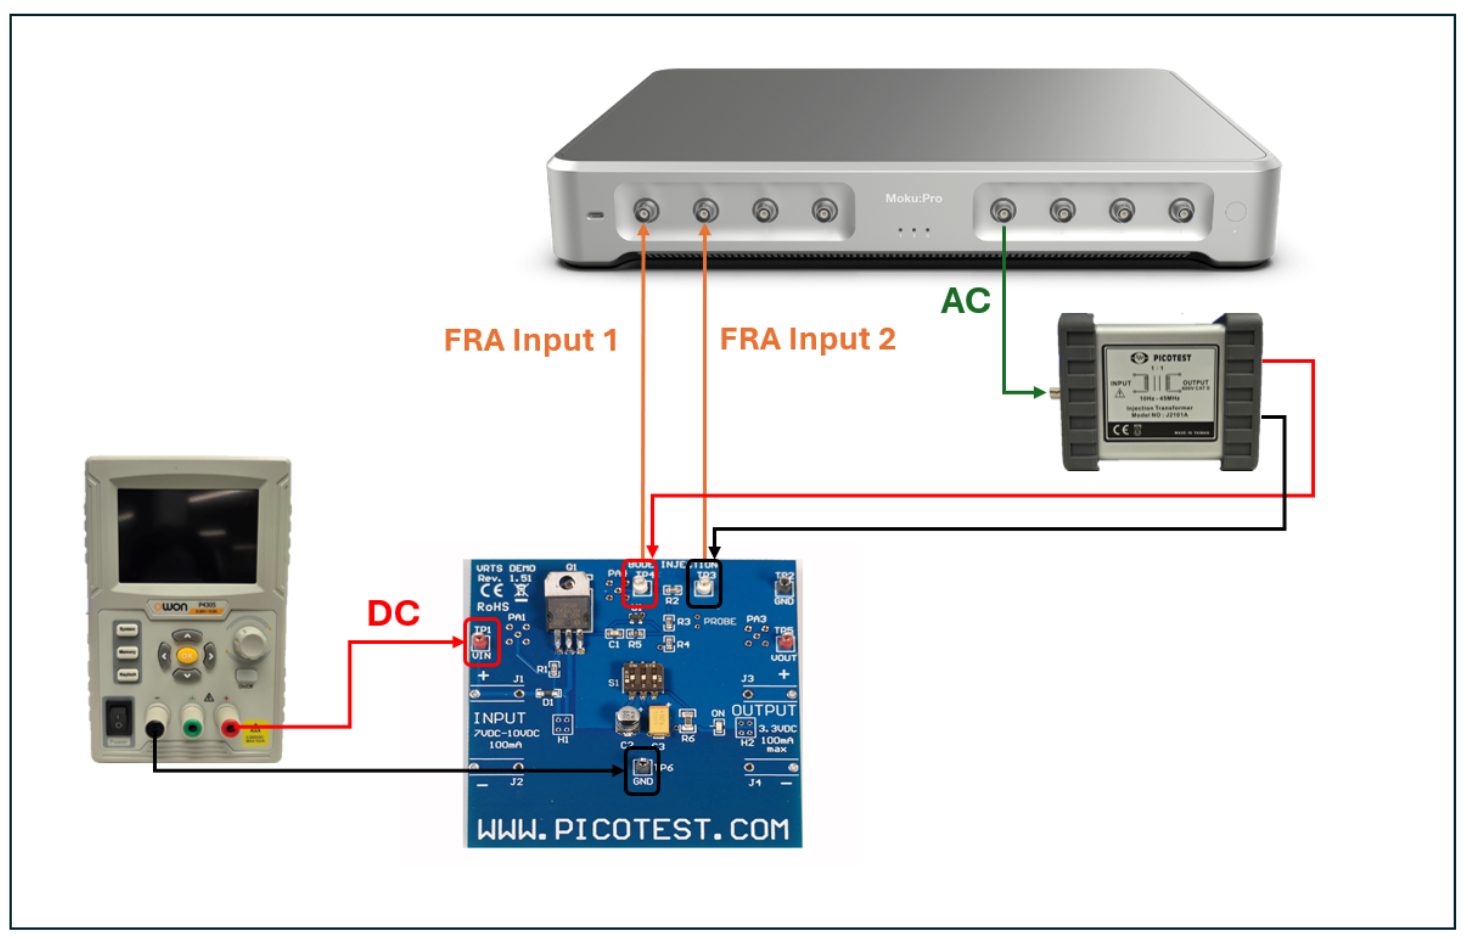
The setup of the system is very similar to the set up in part 1, apart from adding a Phasemeter and thermocouple to the system, as well as transferring the PID Controller to a separate Moku. Output 3 and 4 are routed to the input of the PID, and the output of the PID is routed to the input of the Waveform Generator via Input 2, seen in Figure 2. The Phasemeter will track the frequencies of the two signals generated by the Waveform Generator. Since the system is driving the amplitudes of two frequency components until they are equal, it’s possible to say that the resonant frequency is the average of the two frequencies. By adding a Phasemeter into the system, it’s possible to measure the frequency of the two waveforms in real time thus allowing the user to track resonance in real time.
The thermocouple logged the temperature of the crystal as it was heated with a heat gun. This allows the user to record the temperature of the crystal as its resonance changes. It is also useful to check the tolerance of the crystal, as it’s possible to see at which temperature the crystal begins to behave out of spec.
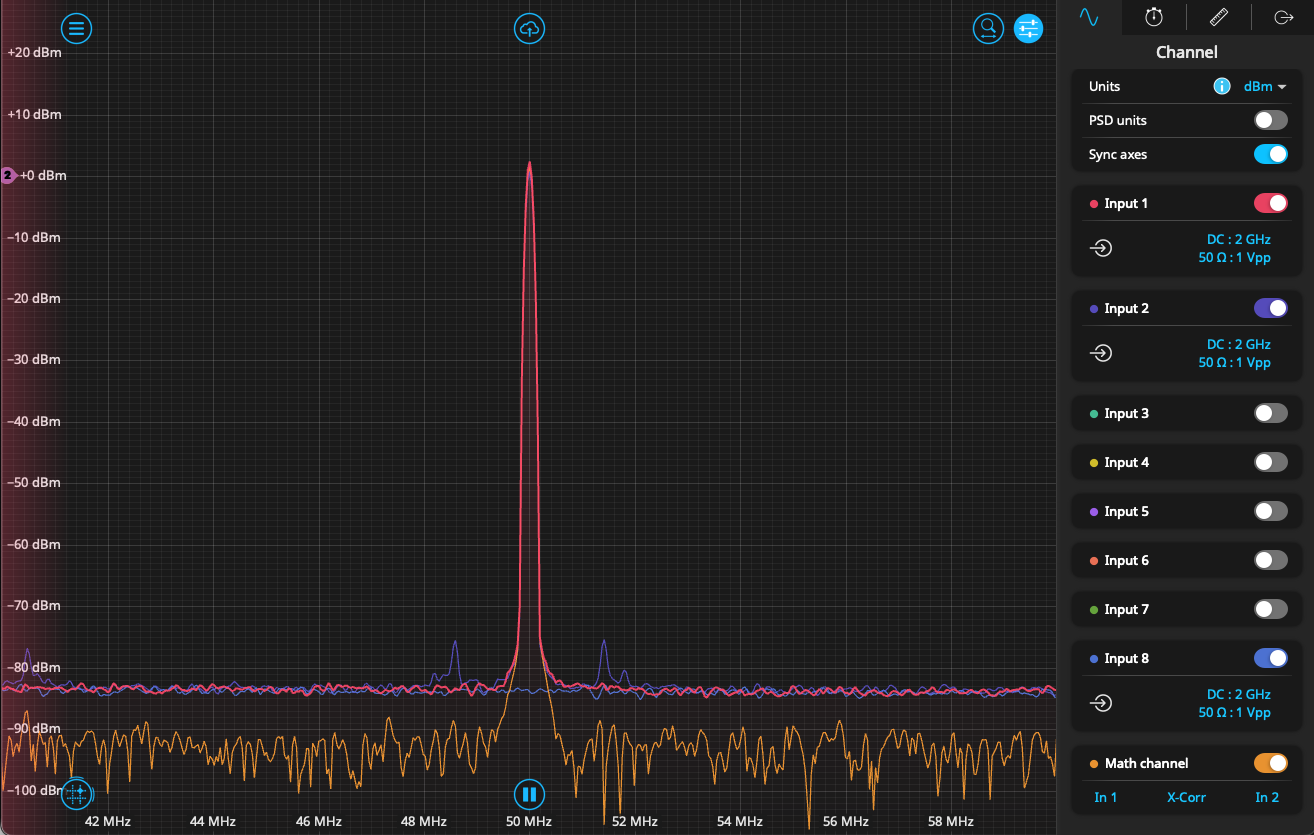
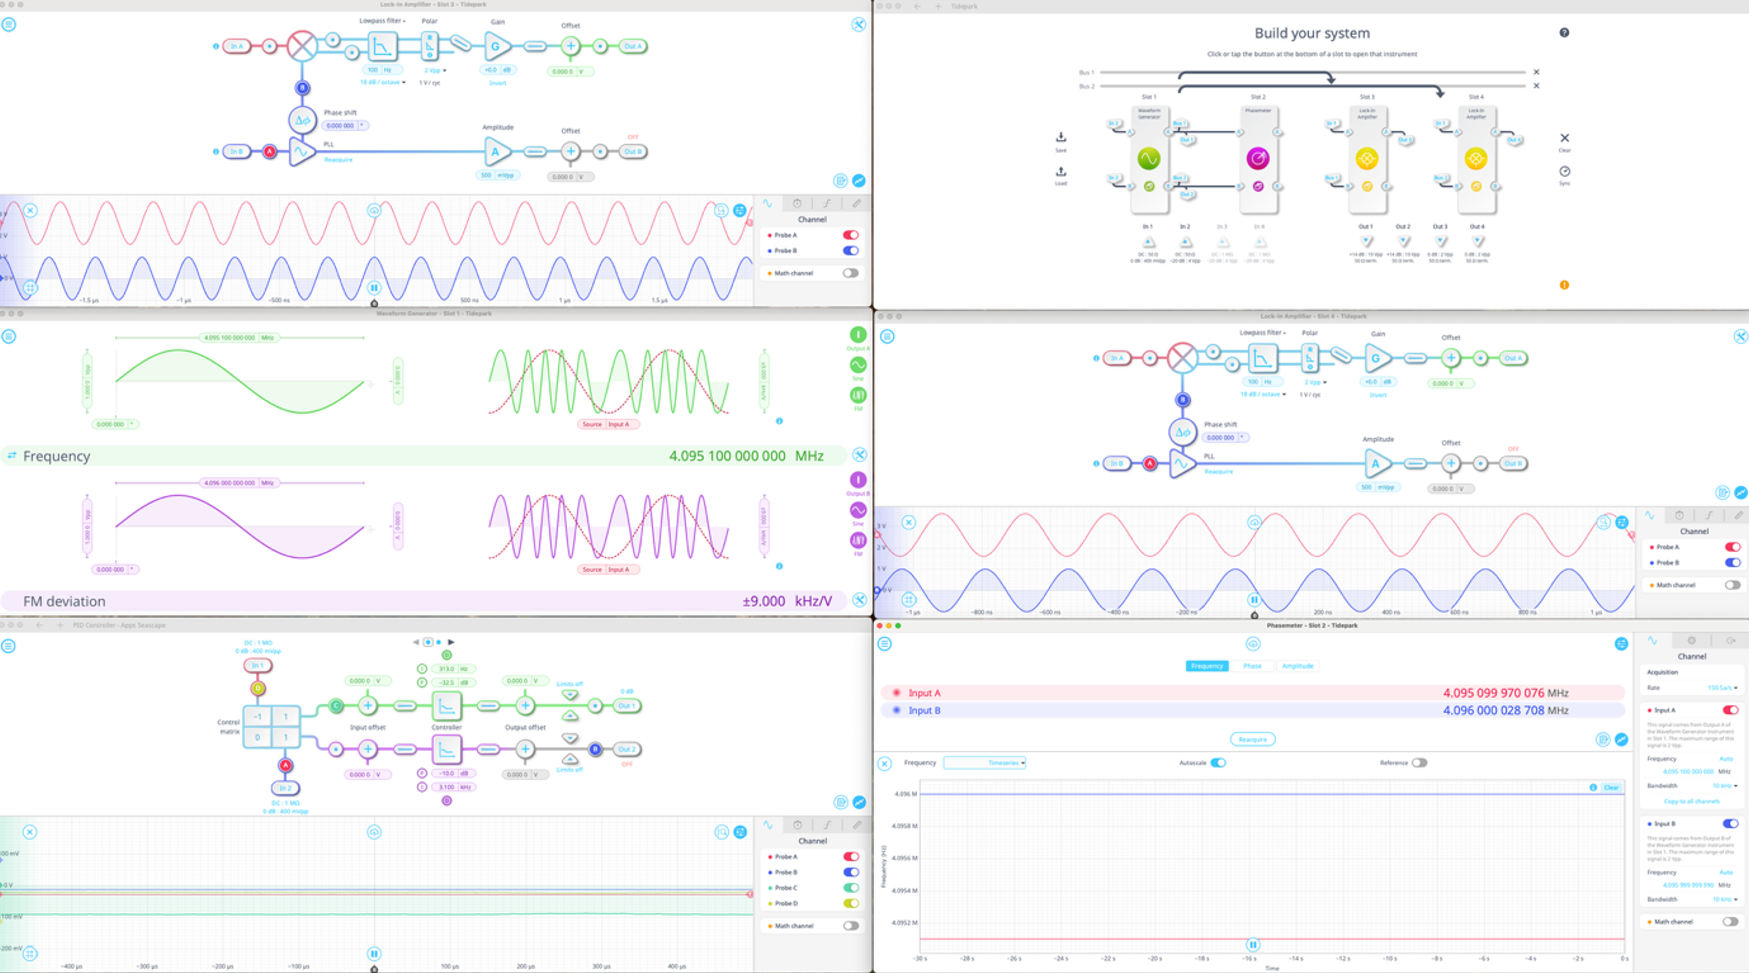
Multi-Instrument Mode allows users to not only create entire systems on a single Moku device, but also use all instruments simultaneously, as shown in Figure 3. Most of the DFRT system was implemented onboard one Moku, with the PID Controller on a second Moku operating as a single instrument. The Moku app allows users to control multiple instruments and Moku devices simultaneously for ease of use and real-time system analysis.
The experiment
Once the system was set up, data acquisition began. The data that was taken and synthesized for this experiment was temperature, frequency, and PID output. The PID output was recorded because it will be used as a control signal for the Waveform Generators. By comparing the PID output with the FM depth of the Waveform Generator, it’s possible to calculate how much resonance is changing. The PID Controller will drive the Waveform Generator frequency up or down until the amplitudes of the two frequency components are equal. The change in frequency is determined by the FM depth and PID voltage. Therefore, changes in resonance can be calculated from these values. The FM depth is important to consider so that the PID output does not saturate. If using an FM depth that is too small, the PID output will saturate before it can drive the Waveform Generators to the correct frequency.
Once each instrument has been configured correctly, the Waveform Generators are turned on to drive the resonator. Upon first engaging the Waveform Generators, the PID output stays relatively unchanged since the amplitude of each frequency component is essentially equal. The output of the PID doesn’t begin to change until external heat is applied to the resonator.
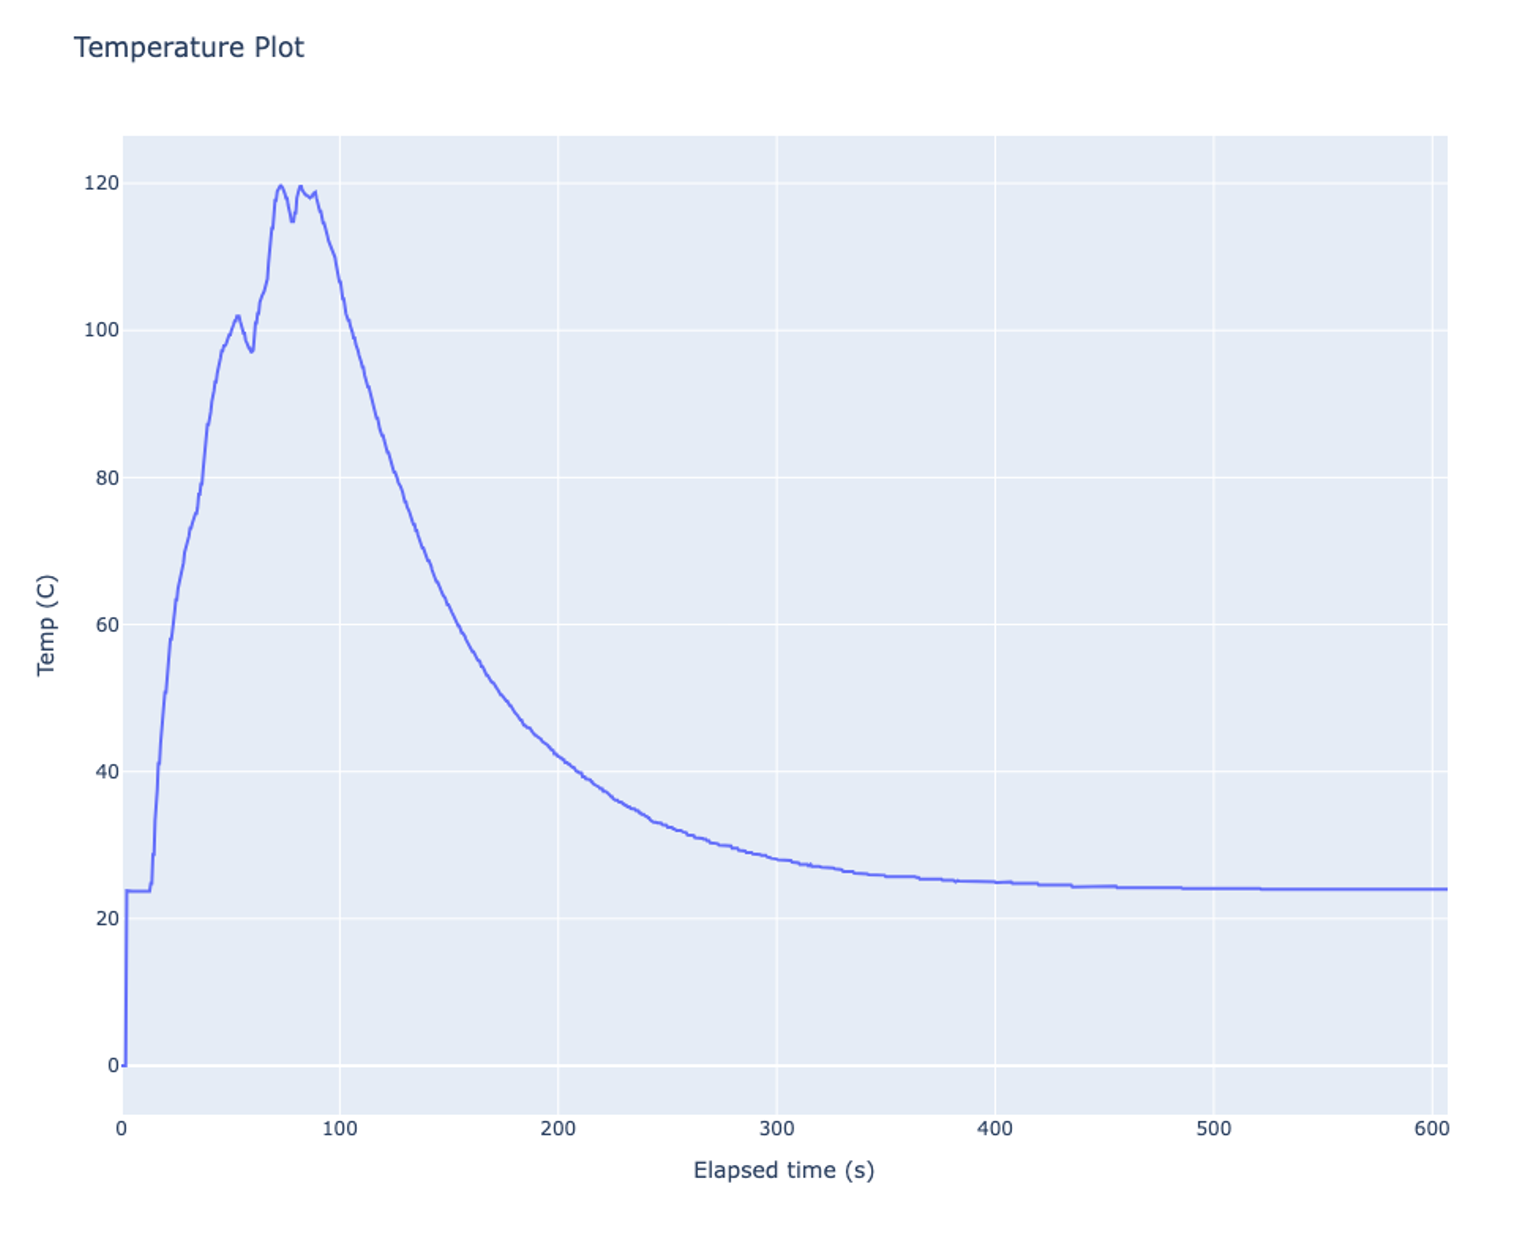
Figure 4 shows the temperature curve over the 10 minutes that the experiment took place. The resonator was consistently heated until it reached 120 C and was allowed to slowly cool to room temperature. During this process, the Phasemeter was being monitored for comparison to the temperature curve, seen in Figure 5.
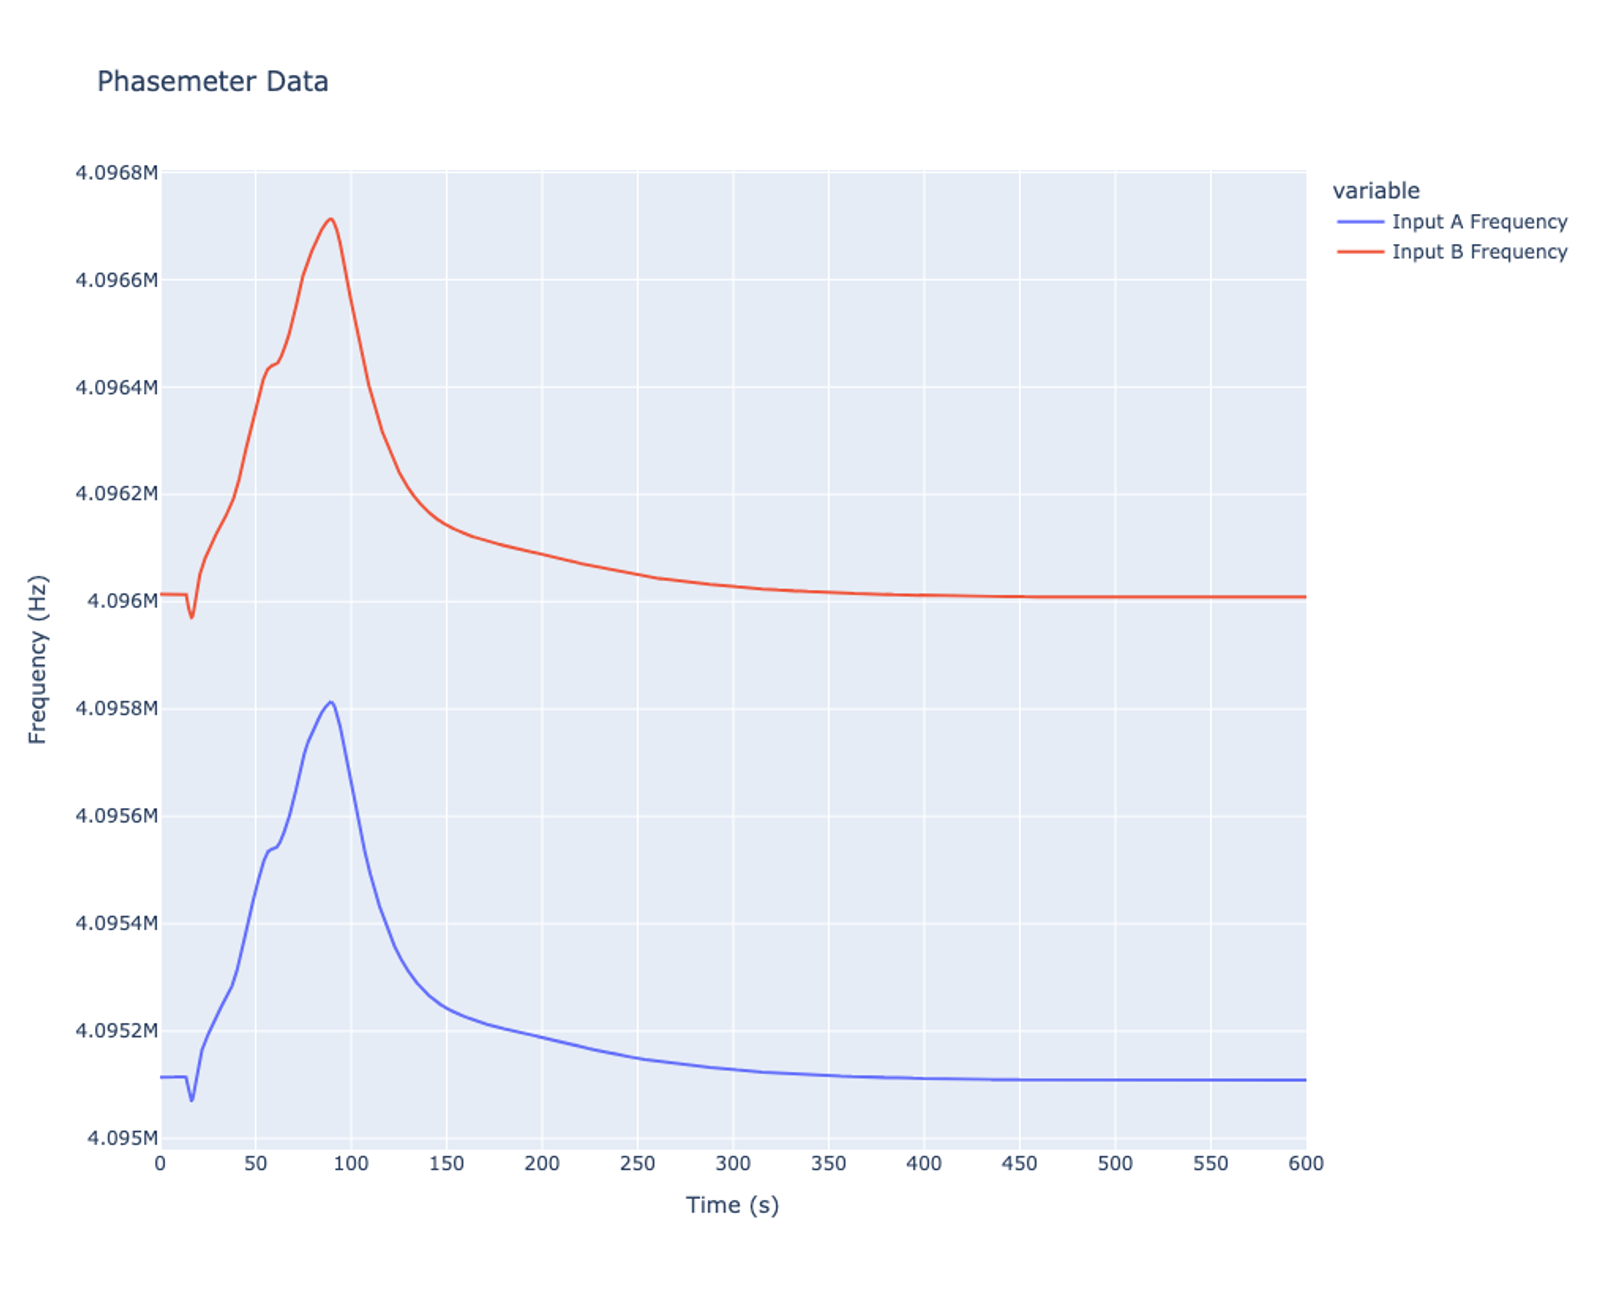
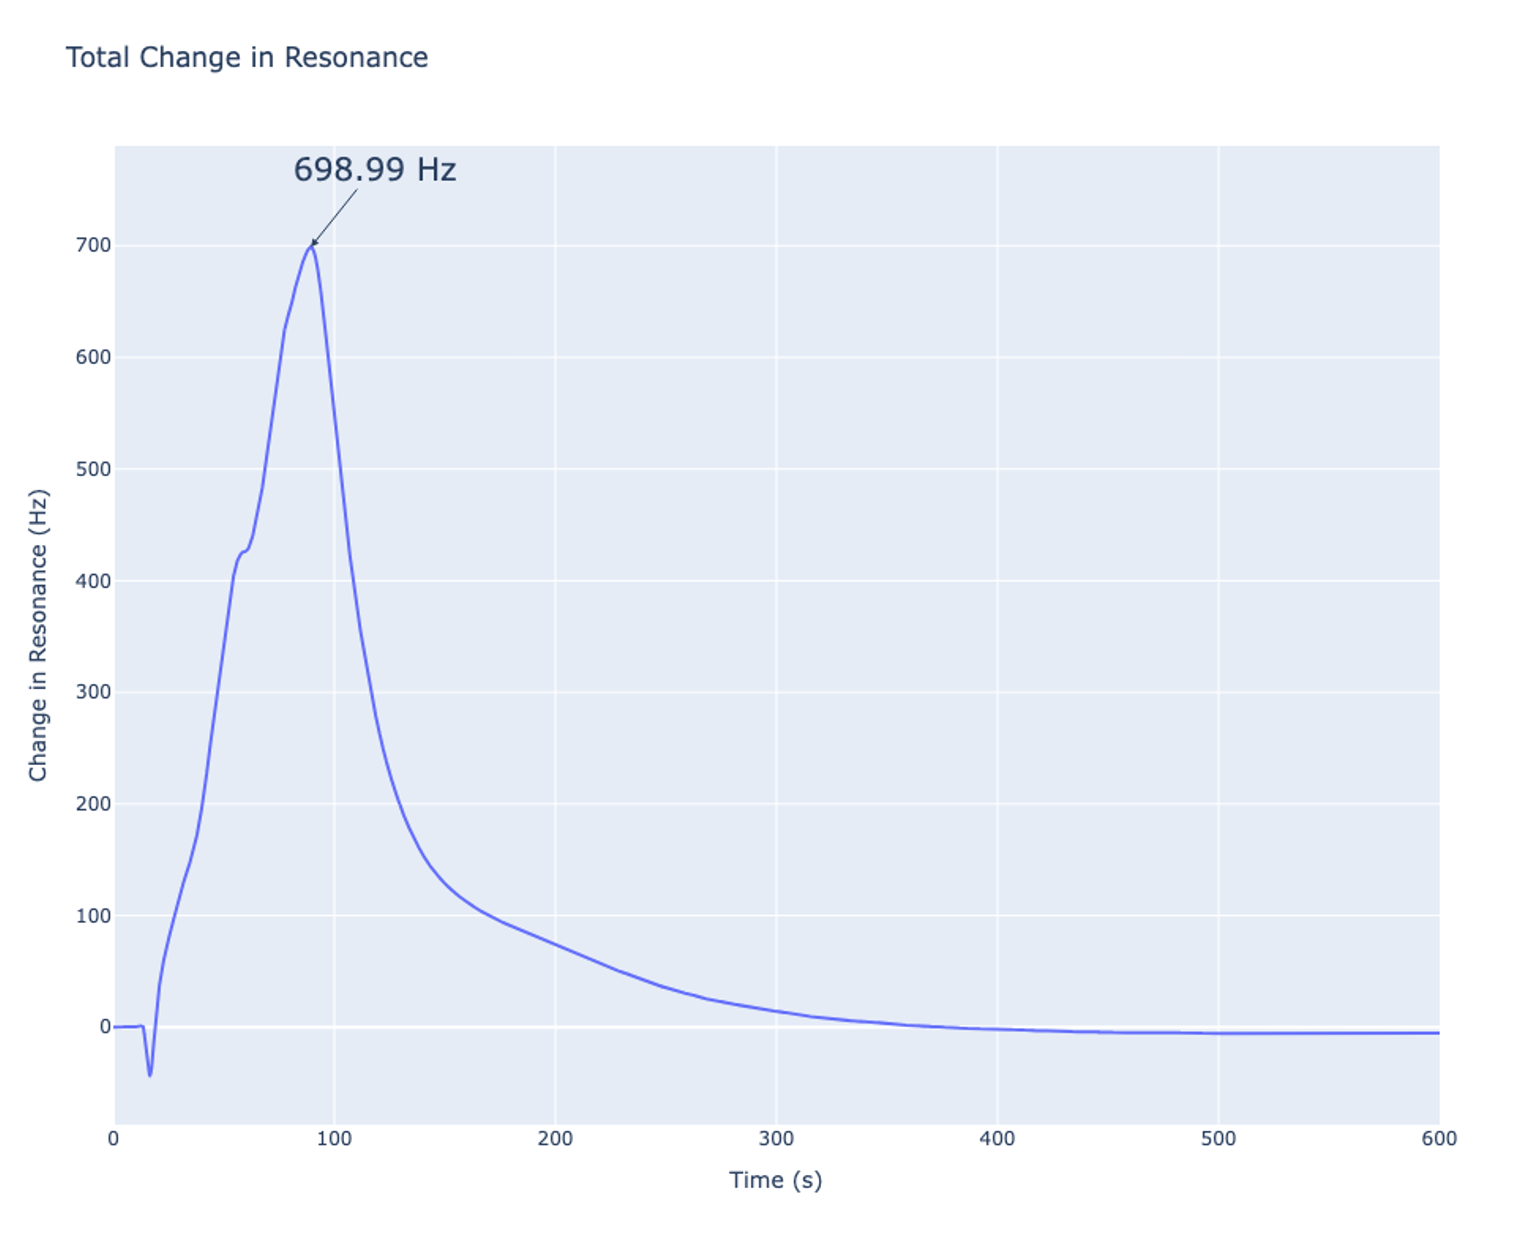
By plotting the Phasemeter results, it is much easier to track where resonance is and how much it has changed because the resonant frequency is the average of these two curves. By tracking only one of the curves, it is easy to see from Fig. 6 that the resonant peak increased 698.99 Hz while being heated. This can be verified by looking at the output of the PID Controller and using the FM depth to calculate the changes in resonance.
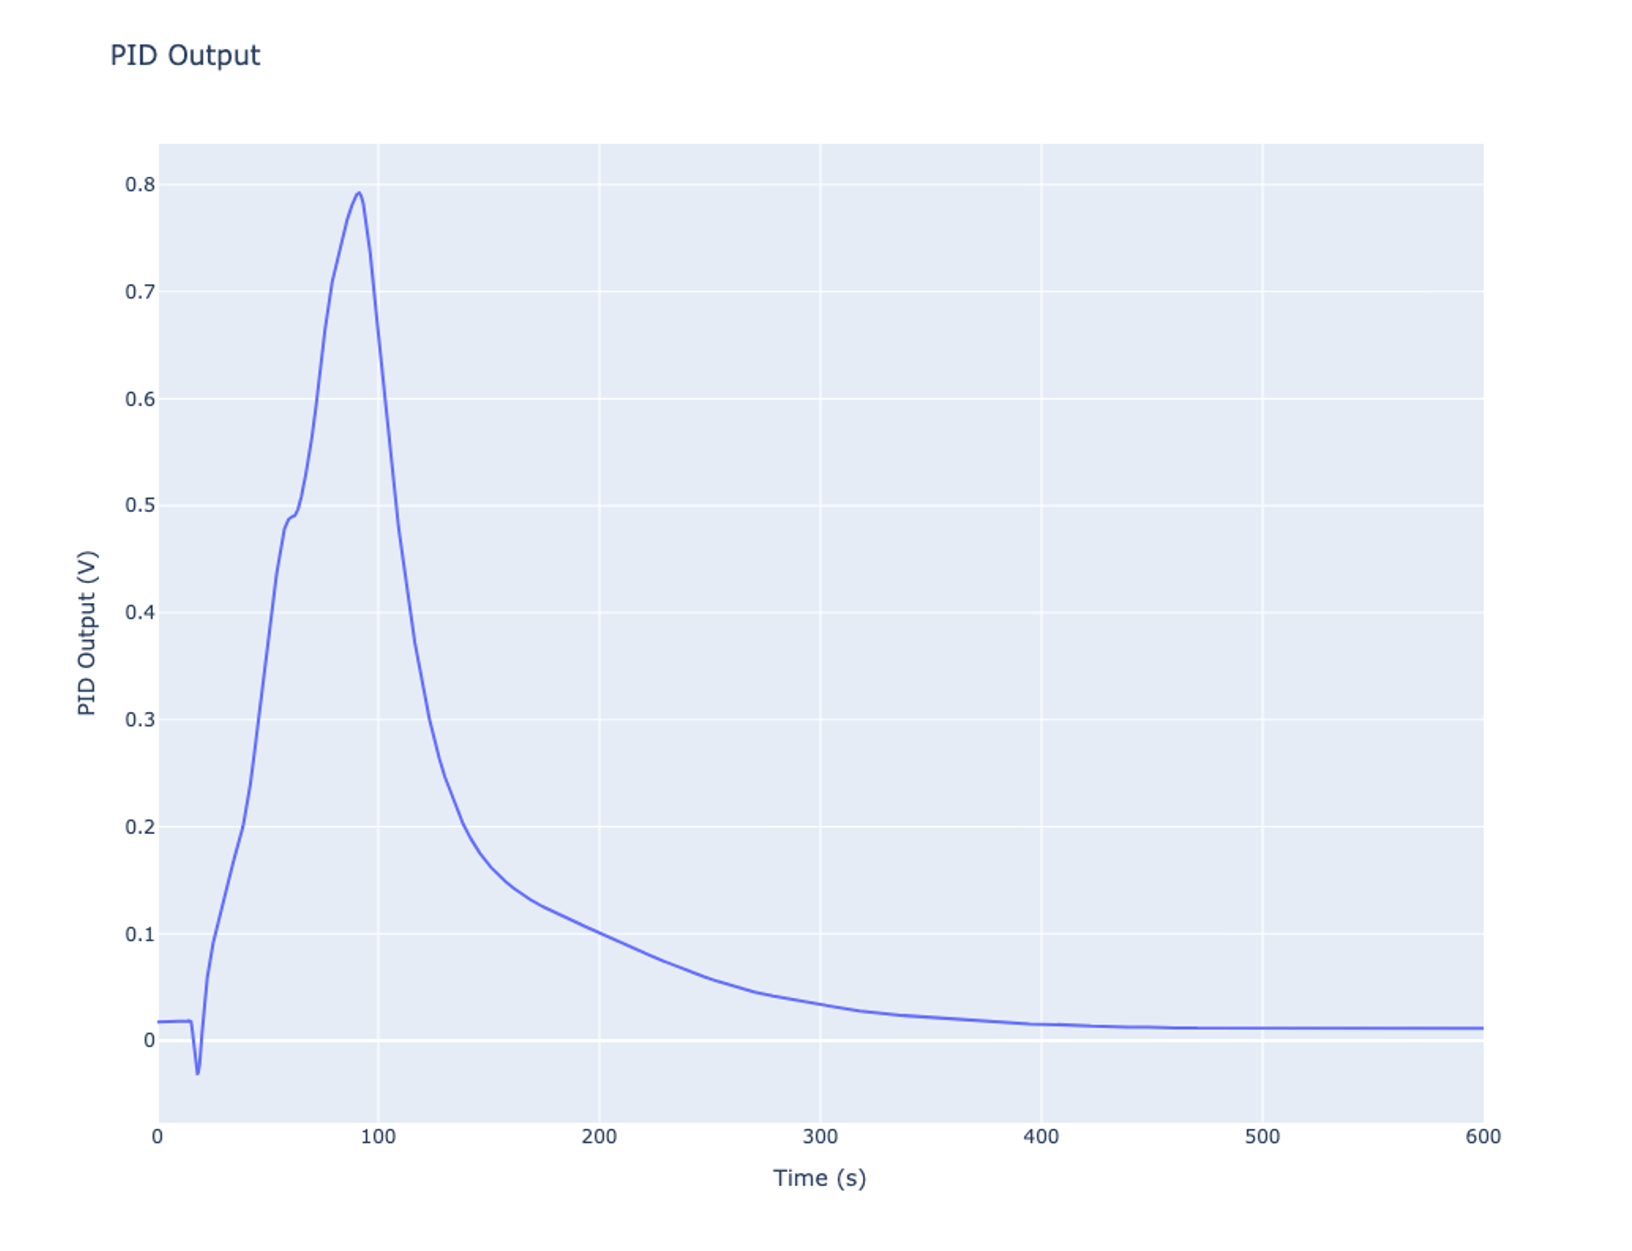
It is important to note that the PID Controller was being used on a second Moku:Pro. The output of the PID was connected to input 2 of the Moku running the Waveform Generator, with a -20 dB attenuation on the input. This means that the signal coming out of the PID Controller and into the Waveform Generator has a 10x reduction in magnitude. This was done intentionally to prevent the PID Controller from entering saturation before tracking the change in resonance.
Observing the output, there is a change of about 0.775 V. Since the Waveform Generator has -20 dB attenuation on its input, the control signal seen by the waveform generator is 0.0776 V. By multiplying this by the FM depth of the Waveform Generator, the change in resonance is 698.99 Hz or about 700 Hz which is consistent with what is seen in the Phasemeter.
Frequency and temperature relationship
Heating up the resonator changes resonance by some frequency per degree. In this experiment, temperature data was taken in parallel with the frequency data which allows further analysis of the relationship between temperature and frequency. Doing further data analysis allows the user to construct a “cooling curve”. This curve shows the cooling down of the crystal and how the temperature affects the resonant frequency of the crystal.
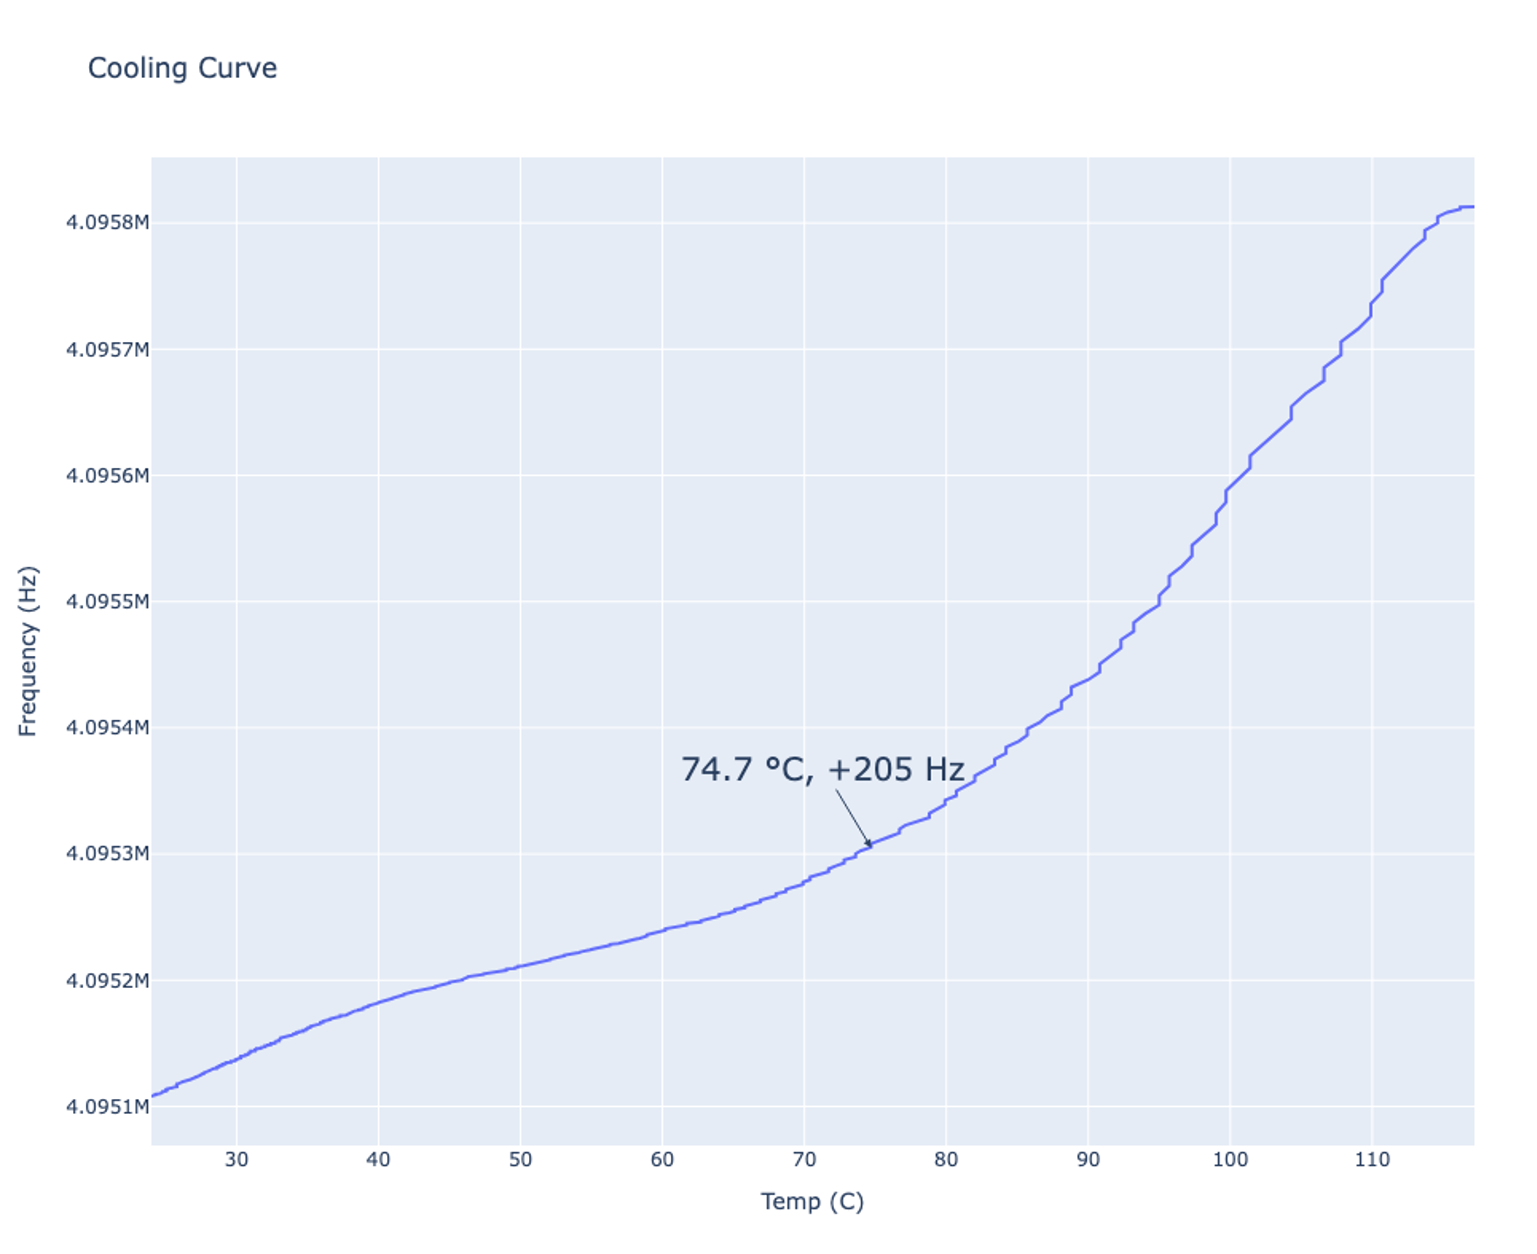
Figure 8 shows the cooling curve and the corresponding frequency of the lower frequency waveform at that temperature. By tracking the change in one of the signals, it’s possible to effectively track the change in resonance since both Waveform Generator signals will change by the same amount. This crystal is rated with a frequency tolerance of +/-50 ppm while in the temperature range of -10 C to 60 C. The frequency tolerance of +/- 50 ppm corresponds to a change of about 205 Hz while under normal temperatures. Based on the plot, the crystal remains in tolerance up to 74.7 C which is normal for stable crystal resonators. Resonance continues to rise until 120 C when heat is no longer applied.
Summary
Dual Frequency Resonance Tracking (DFRT) is an alternative method to the already established resonance tracking techniques, such as a phase locked loop (PLL). DFRT was implemented on two Moku:Pro devices and used to track the resonance of a real crystal oscillator that underwent heating to change its resonance and was able to track movement on the order of 100 Hz of a 4.096 MHz crystal. While the Frequency Response Analyzer can track the resonant peak, the resolution is limited when compared to dedicated resonance tracking techniques. By tracking the temperature and frequency changes, it is possible to construct curves which track the resonant peak and compare the temperature the changes in resonance.