




Please update your browser. For the best Liquid Instruments experience, update to the latest version of Chrome, Edge, Firefox, or Safari. Update Microsoft Edge.
Liquid Instruments Logo
Products
Hardware Platforms
Moku:Delta
Moku:Delta
New
For advanced design and validation
Moku:Pro
Moku:ProFor versatile test and measurement
Moku:Lab
Moku:LabFor experimental research labs
Moku:Go
Moku:GoFor quick testing and debugging
Compare Hardware
Compare HardwareView a side-by-side of all Moku hardware
Technologies
GenInst Studio
New
Generate personalized instruments
Integrated InstrumentsProfessional-grade instruments at your fingertips
Neural NetworkFPGA-powered neural network integration
Multi-Instrument ModeCombine instruments to create a customized test system
Moku CompileCode, compile, and deploy to your Moku's FPGA
Software
MokuOSDownload the Moku app for Windows, macOS, iPadOS & visionOS
APIsPython, MATLAB, LabVIEW
UtilitiesCommand line and graphical tools for file conversion
Instruments
Analysis
Oscilloscope
Spectrum Analyzer
Frequency Response Analyzer
Lock-in Amplifier
Phasemeter
Logic Analyzer / Pattern Generator
Time & Frequency Analyzer
Data Logger
Generation
Waveform Generator
Arbitrary Waveform Generator
Control & Conditioning
PID Controller
Digital Filter Box
FIR Filter Builder
Laser Lock Box
Custom & Utility
GenInst Studio
New
Gigabit Streamer
Custom Instrument
Neural Network
Multi-Instrument Mode
Applications
Optics and Photonics
Microscopy and Spectroscopy
Photon Counting
Quantum Optics
Aerospace and defense
A&D Instrumentation
Component Test
Automated Testing
Semiconductor Test
Control Systems and Bode Analysis
MEMS Testing
AI and Machine Learning
Generative Instrumentation
New
Neural Networks
Education
Education and Research
Resources
App Notes
Blog
Case Studies
Coursework
Guides
Product Documentation
Publications
Webinars
White Papers
Support
Company
Contact Us
About Us
Leadership
Partners
News & Updates
Press
Events Calendar
Careers
Store
Moku:Delta
Moku:Pro
Moku:Go
Upgrade Moku:Pro
Upgrade Moku:Lab
Upgrade Moku:Go
0
Get a quote Buy Now
Build personalized instruments with GenInst Studio in minutes, not months. | Register for the webinar
White papers

Introduction to the Moku:Lab Spectrum Analyzer

A getting started guide

May 7, 2020

    Updated April 24, 2023.

    Spectrum analyzers are essential test and measurement instruments in the lab. They are used to display and analyze signals in the frequency domain. Compared to the Fast Fourier Transform (FFT) function available in some oscilloscopes, frequency-swept spectrum analyzers typically provide better spectral resolution while maintaining a large frequency span. However, spectrum analyzers can be much slower than the FFT-based approach, especially at a finer resolution. The Moku:Lab Spectrum Analyzer instrument uses a hybrid technique, which delivers the advantages of both approaches and balances the speed and frequency span. In this guide, we will use the Moku:Lab Spectrum Analyzer and Oscilloscope to introduce the key differences between hybrid spectrum analyzer and FFT-based approaches and familiarize ourselves with some of the key settings of the Moku:Lab Spectrum Analyzer.

    Download Printable Version

    Limitations of FFT-based approach

    Frequency domain signal analysis is an essential technique used to identify and separate unwanted noise from a signal of interest. Compared to time-domain analysis, it’s much easier to spot the noise and optimize the system to filter out the unwanted part with frequency-domain analysis. The Fast Fourier Transform is a mathematical algorithm that computes the frequency-domain responses of a signal from the time-domain trace. It is a standard built-in feature for many modern digital storage oscilloscopes and provides a good first glance of the signal in the frequency domain. However, the spectral resolution (R) of the FFT is proportional to the sampling rate (Fs) divided by the number of FFT points (N). On the other hand, the highest frequency on the FFT spectrum is limited to half the sampling rate. This means the larger the frequency span, the poorer the resolution (larger R), as demonstrated in the equations below.

    20-0504_AppNoteBlogPost-IntroductionToMokuLabsSpectrumAnalyzer_01-Formula-01

    This limits the FFT-based approach in characterizing finer details at high frequencies. Throughout this application note, we will use a 10 MHz sine wave, frequency modulated (FM) at 5 kHz with an FM deviation of 1 kHz as the signal of interest (Figure 1). We will use the name FM1 for this signal. Figure 2 shows the FFT spectrum of FM1, generated with Moku:Lab’s Oscilloscope. The ± 5 kHz side bands cannot be resolved by the FFT analysis. Also, multiple aliasing bands can be seen on the spectrum.

    20-0504_AppNoteBlogPost-IntroductionToMokuLabsSpectrumAnalyzer_02-Figure-01

    Figure 1: The FM signal at 10 MHz generated by the Moku:Lab Waveform Generator

    20-0504_AppNoteBlogPost-IntroductionToMokuLabsSpectrumAnalyzer_03-Figure-02

    Figure 2: FFT spectrum of the FM1, calculated by the Moku:Lab Oscilloscope


    Moku:Lab hybrid Spectrum Analyzer approach

    To overcome the limitation of the FFT-based approach, the Moku:Lab Spectrum Analyzer digitally mixes the signal of interest with a local oscillator (LO) f1 to bring the frequency of interest to near DC range, as shown in Figure 3. The theory of frequency mixing can be found in our Moku:Lab Lock-In Amplifier video (https://youtu.be/H2O2ADqEkHM). Then, the spectrum analyzer performs an FFT on this low frequency signal.

    20-0504_AppNoteBlogPost-IntroductionToMokuLabsSpectrumAnalyzer_04-Figure-03

    Figure 3: Signal processing flow of the Moku:Lab Spectrum Analyzer

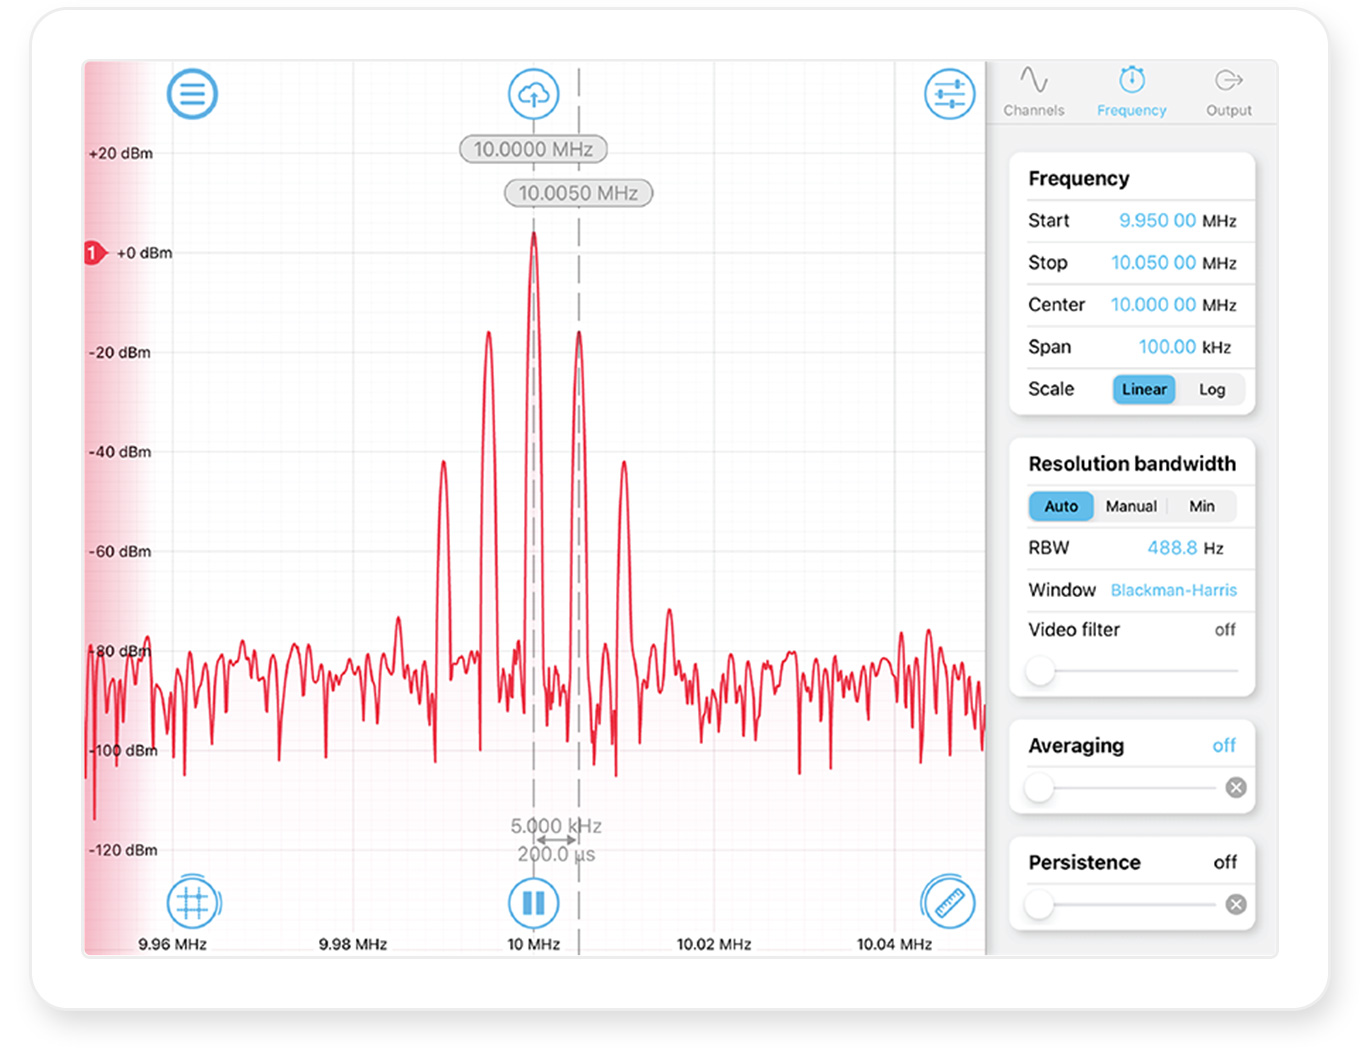
    As we discussed before, FFT performs best with smaller frequency spans. This hybrid approach allows the starting point of the spectral window to be selected at any given frequency (compared to the pure FFT approach, which always starts at 0). Any part of the spectrum can be analyzed with a narrow span. The spectral resolution is no longer limited by the upper frequency of the spectrum but rather is related to the frequency span. Therefore, you can get a spectrum with high resolution, even at higher frequencies. In Figure 4, we used the Moku:Lab Spectrum Analyzer to analyze FM1. All the side bands, including the significant harmonics, can be easily resolved.
    20-0504_AppNoteBlogPost-IntroductionToMokuLabsSpectrumAnalyzer_05-Figure-04

    Figure 4: Spectrum of FM1, acquired with the Moku:Lab Spectrum Analyzer

    Frequency, resolution bandwidth, and video filter

    As we discussed in the previous section, a narrower frequency span provides finer spectral resolution. The smallest span that covers the signal frequencies of interest is recommended.

    The resolution bandwidth (RBW) defines the spectral resolution of the spectrum analysis. It is determined by the number of points that are used for the FFT and the window function applied to the signal prior to calculating the FFT. A narrower resolution bandwidth provides better spectral resolution. However, it may slightly increase the measurement time.

    The video filter smooths the spectrum by averaging adjacent pixels on the displayed spectrum. It is a postprocessing technique and does not affect the on-board spectrum acquisition process. A larger video filter will produce smoother spectra at the expense of poorer frequency resolution and can reduce the amplitude of narrow spectral features.

    Averaging is another method to improve the signal-to-noise ratio. It has a similar effect to the video filter. It is recommended when capturing relatively stable features and does not reduce the resolution of the spectra.

    Figure 5 shows the effect of resolution bandwidth, video filter, and averaging on FM1.

    20-0504_AppNoteBlogPost-IntroductionToMokuLabsSpectrumAnalyzer_06-Figure-05

    Figure 5: Effects of RBW, video filter, and averaging


    Moku:Lab Demo mode

    You can download the Moku:Lab App from the Apple App Store and experience it in demo mode. Detailed features of the Moku:Lab Spectrum Analyzer can be found at https://liquidinstruments.com/support/moku-lab-instruments/spectrum-analyzer/


    Questions or comments?

    Please contact us at support@liquidinstruments.com

    Try Moku in demo mode Download the Moku app → Get answers to FAQs Visit Knowledge Base → Connect with Moku users Join the user forum →

    Other Recommended White papers

    White papers
    Building advanced triggers for test using AI-enabled tools

    Compressing weeks of custom development and replacing fixed Oscilloscope trigger modes with Generative Instrumentation

    Date: July 14, 2026

    White papers
    Scaling parallel device testing with Python and FPGA-based tools

    How combining software flexibility with hardware determinism increases test throughput and reliability in R&D and production

    Featuring: Moku:Delta, Spectrum Analyzer, Oscilloscope, Python

    White papers
    Visualizing and characterizing qubit states in quantum systems

    Learn about the representing qubit states with the Bloch sphere, along with common pulse sequences and tips for implementation with Moku

    Featuring: Arbitrary Waveform Generator, Lock-in Amplifier, Moku:Delta, Moku:Pro

    Date: August 6th, 2025

    Back to all White papers

    Nav

    • Products
    • Instruments
    • Resources
    • Support
    • Company
    • Contact Us
    • Privacy Policy
    • Terms of Use

    Offices

    United States
    (619) 332-6230
    12526 High Bluff Dr.
    Suite 150
    San Diego, CA 92130

    Australia
    +61 2 6171 9730
    243 Northbourne Avenue
    Suite 1, Level 1
    Lyneham, ACT 2602

    Australia
    +61 3 7073 3594
    Suite 5C, Level 5,
    700 Swanston Street,
    Carlton, VIC – 3058


    Follow us

    LinkedIn YouTube X Facebook Instagram

    官方微信

    © 2026 Liquid Instruments. All rights reserved.