






Cross-correlation is a useful signal-processing method for obtaining electronic measurements. This versatile analytical technique eliminates uncorrelated, or random, noise from a given signal by comparing it with another reference signal. For applications such as feature detection, time-delay estimation, and signal similarity analysis, cross-correlation can also determine the temporal separation between two signals. Due to the high data stream and resource-heavy calculations required, especially in real-time scenarios, this method can be taxing on hardware — so it requires the right tools to achieve the best results. However, these challenges can be mitigated with reconfigurable, FPGA-based hardware.
What is cross-correlation, and how is it measured?
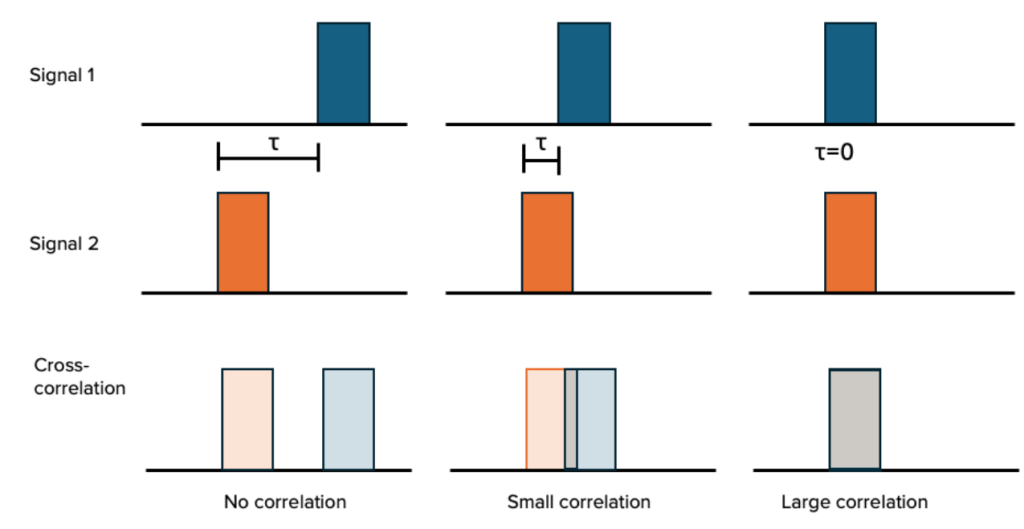
Essentially, cross-correlation is the measurement of how well two independent signals resemble each other, a concept also known as cross-similarity. A similar technique, called autocorrelation, applies when a signal is being matched to a lagged version of itself. Mathematically, cross-correlation is defined as the integral of the product of the two signals. One signal is usually given a variable time delay τ, and the cross-correlation is represented as a function of this time delay. For example, when the two signals do not have any time overlap, the function is zero. Depending on whether the signals are of similar or opposite amplitudes, the correlation function can also take on positive and negative values. Figure 1 shows a visual example of cross-correlation for several time delays.
What are some applications for cross-correlation measurements?
Phase noise analysis: The phase noise measurement of an unknown oscillator can often be limited by the added noise of the measurement electronics themselves. To solve this challenge, the device can be fed into two different demodulation channels. Performing cross-correlation analysis on the two resulting signals can remove the uncorrelated noise added by the separate local oscillators while preserving the correlated noise, which is the figure of interest. This allows for the measurement of phase noise lower than the measurement device itself. To learn more about phase noise analysis, check out our on-demand webinar, “Measuring time: quantifying modern clocks and oscillators.” co-hosted with Professor Andre Luiten. Time-delay estimation: The cross-correlation function between two similar signals produces an amplitude maximum when the two signals are matched in time. This is a valuable feature in applications such as determining range or time-of-flight in radar measurements, or synchronizing signals in telecommunications. Signal Analysis: Use cross-correlation to analyze seismic signals, radar, sonar, and other signals. Comparing an incoming signal to a known template can help detect events below the noise threshold, extract information, or identify specific events.
Accelerate cross-correlation measurements with an FPGA-based spectrum analyzer
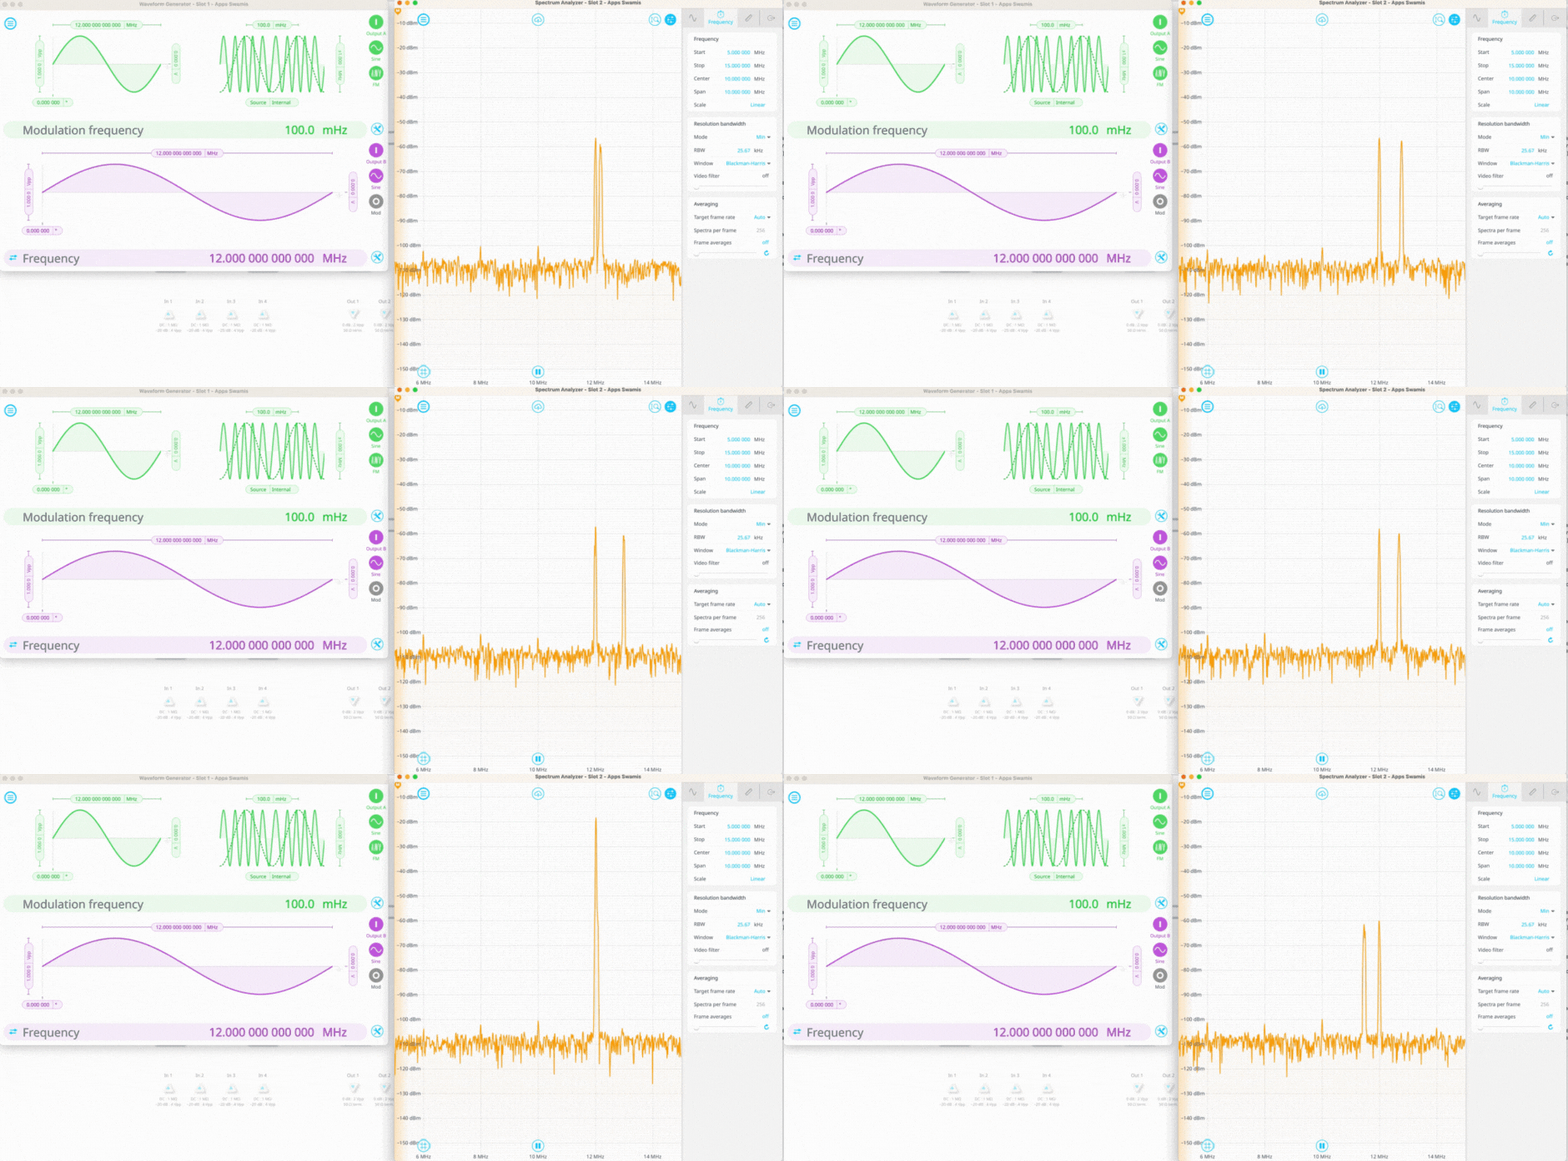
Field-programmable gate arrays, or FPGAs, stand out for their ability to handle large volumes of data efficiently and with high precision, making them an ideal choice for real-time applications such as cross-correlation measurements. Furthermore, the reconfigurable nature of FPGAs means that the same hardware can be reconfigured for different tasks or algorithms, providing a high degree of versatility. Moku:Pro is an FPGA-based device from Liquid Instruments that offers a reconfigurable suite of 15 test and measurement instruments for demanding research and engineering applications. The Moku:Pro Spectrum Analyzer instrument offers four channels for data recording, as well as a Math channel that can perform analysis on any combination of two inputs. With Moku Version 3.2 cross-correlation is now available as a math function. In addition to standalone mode, the Moku:Pro Spectrum Analyzer can function with two input channels in Multi-instrument Mode. Multi-instrument Mode partitions the FPGA of the Moku:Pro device so that multiple instruments can function simultaneously. This allows the Spectrum Analyzer to easily integrate with other Moku instruments such as the Waveform Generator or Phasemeter, with all-digital connections between instruments. This approach eliminates the insertion loss and phase drift that is characteristic of analog setups. Figure 2 shows Moku:Pro configured in Multi-instrument mode to perform a noise measurement. In this setup, the Waveform Generator in Slot 1 produces a signal that is slowly frequency modulated and a signal that is fixed at 12 MHz. These two signals are routed into Inputs A and B of the Spectrum Analyzer instrument in Slot 2. The Math channel is enabled with the cross-correlation function selected, which results in a third plot with the uncorrelated noise removed from the plot.
Time-correlated signals
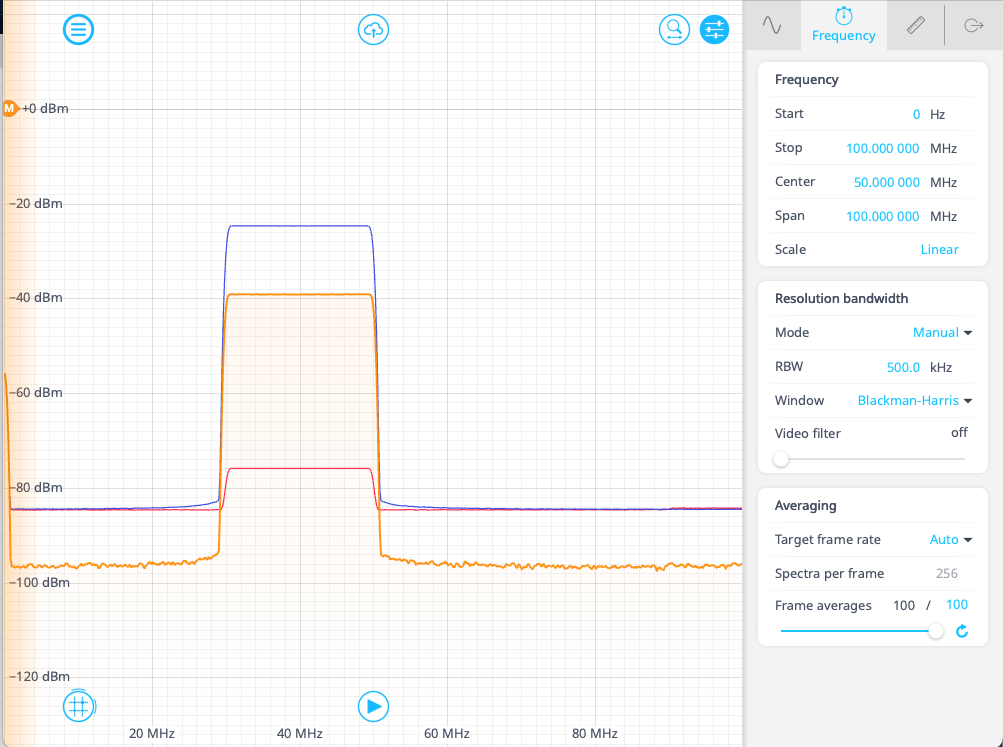
In this example, we show how cross-correlation can be used to measure signal similarity. Using the Moku Waveform Generator, a chirp pulse is produced on Channel A, sweeping the frequency from 50 MHz to 30 MHz over 1 ms. The signal on Channel A is purposely kept at low power. A reference signal on Channel B is also made, sweeping the same frequency range over the same amount of time. Both signals are fed into the Moku Spectrum Analyzer, where the math channel performs a cross-correlation measurement on the two signals. Figure 3 shows that the uncorrelated noise is removed and the signal on the Math channel has low noise outside of the band from 30 to 50 MHz. Inside this band, where the signals overlap, the calculated cross-correlation is very strong.
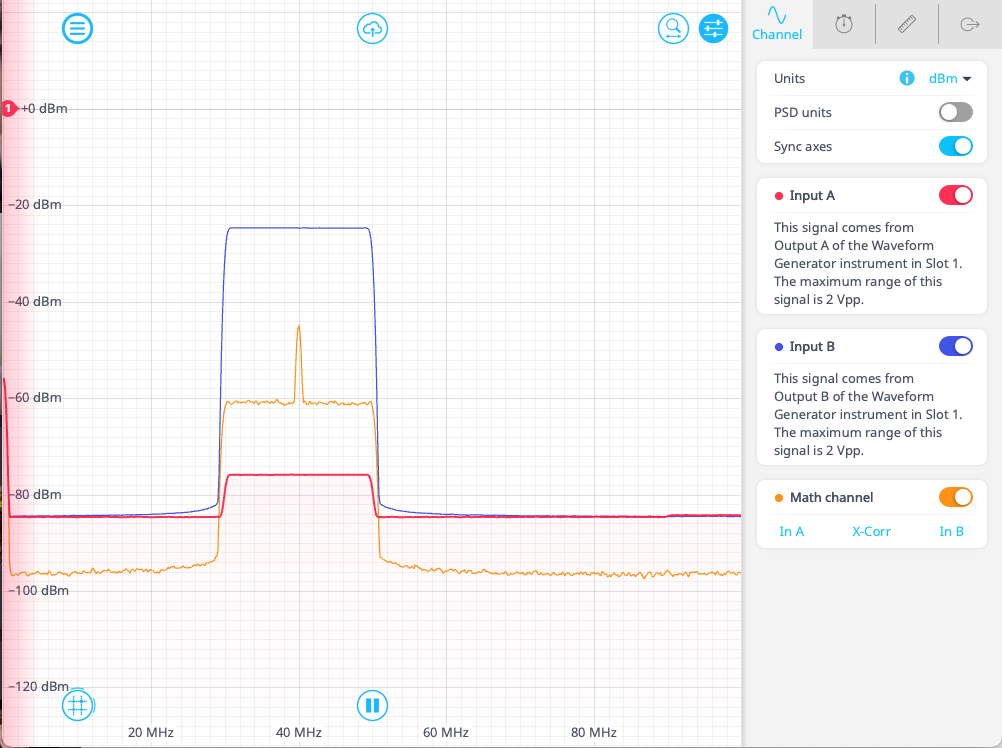
If the chirp is reversed in time, sweeping from 30 MHz to 50 MHz, the signal will look identical on the spectrum analyzer. However, the chirp now has lower temporal overlap with the reference signal, and the resulting cross-correlation measurement will be weaker. This can be seen in Figure 4, where the direction of the sweep on Channel A has been reversed. The two signals will both briefly overlap in the middle of their sweeps, resulting in a peak of the correlation plot at 40 MHz. This demonstrates the usefulness of this function for detecting and analyzing signal features, especially in the time domain.
Choosing the right spectrum analyzer for cross-correlation
Due to the reconfigurability of the Moku:Pro FPGA, as well as its capacity to handle large volumes of data in real time, the Moku:Pro Spectrum Analyzer can perform and analyze cross-correlation measurements with enhanced precision, flexibility, and efficiency. Whether it is in phase noise analysis, time-delay estimation, or signal similarity assessment, the use of Moku:Pro hardware for cross-correlation measurements offers high precision and versatility essential for advanced research and development applications. Check out these case studies to learn how scientists are using the Moku:Pro Spectrum Analyzer to advance their research with flexibility and speed:
Accelerating multiparameter estimation in quantum opticsAxion detection at DESY with Moku:Lab and Moku:ProUsing Moku:Pro for photonic IC control system research at Intel Labs
Questions?
Get answers to FAQs in our Knowledge Base
If you have a question about a device feature or instrument function, check out our extensive Knowledge Base to find the answers you’re looking for. You can also quickly see popular articles and refine your search by product or topic.
Join our User Forum to stay connected
Want to request a new feature? Have a support tip to share? From use case examples to new feature announcements and more, the User Forum is your one-stop shop for product updates, as well as connection to Liquid Instruments and our global user community.