






Contributed by Brian Wong and Dan Fu, Department of Chemistry, University of Washington
Summary
Moku:Pro’s Lock-in Amplifier (LIA) provides an intuitive, precise, and robust solution for self-heterodyne signal detection in Stimulated Raman Scattering (SRS) microscopy experiments. A quality LIA is a critical hardware component in SRS microscopy experiments with a modulation transfer detection scheme. In this updated case study we provide further details and descriptions of this application of a dual LIA application.
What is Stimulated Raman Scattering Microscopy?
SRS is a coherent Raman scattering process that allows for chemical imaging with both spectral and spatial information.1 It uses two synchronized pulsed lasers, namely pump and Stokes (Figure 1), to coherently excite the vibration of molecules. The SRS process occurs when the frequency difference of two lasers incident on a sample matches the vibrational frequency of the target molecule. The result of the vibrational excitation is that pump beam will lose photons while the Stokes beam will gain photons. When the loss of the pump beam is detected, this is called Stimulated Raman Loss (SRL) detection. The intensity loss ΔIₚ/Iₚ is typically on the order of 10-7-10-4, much smaller than typical laser intensity fluctuation. To overcome this challenge, a high-frequency modulation and phase-sensitive detection scheme is necessary to extract SRS signal from a noisy background.2 In the SRL detection scheme, the Stokes beam is modulated at a fixed frequency and the resulting modulation transfer to the pump beam is detected by the LIA.
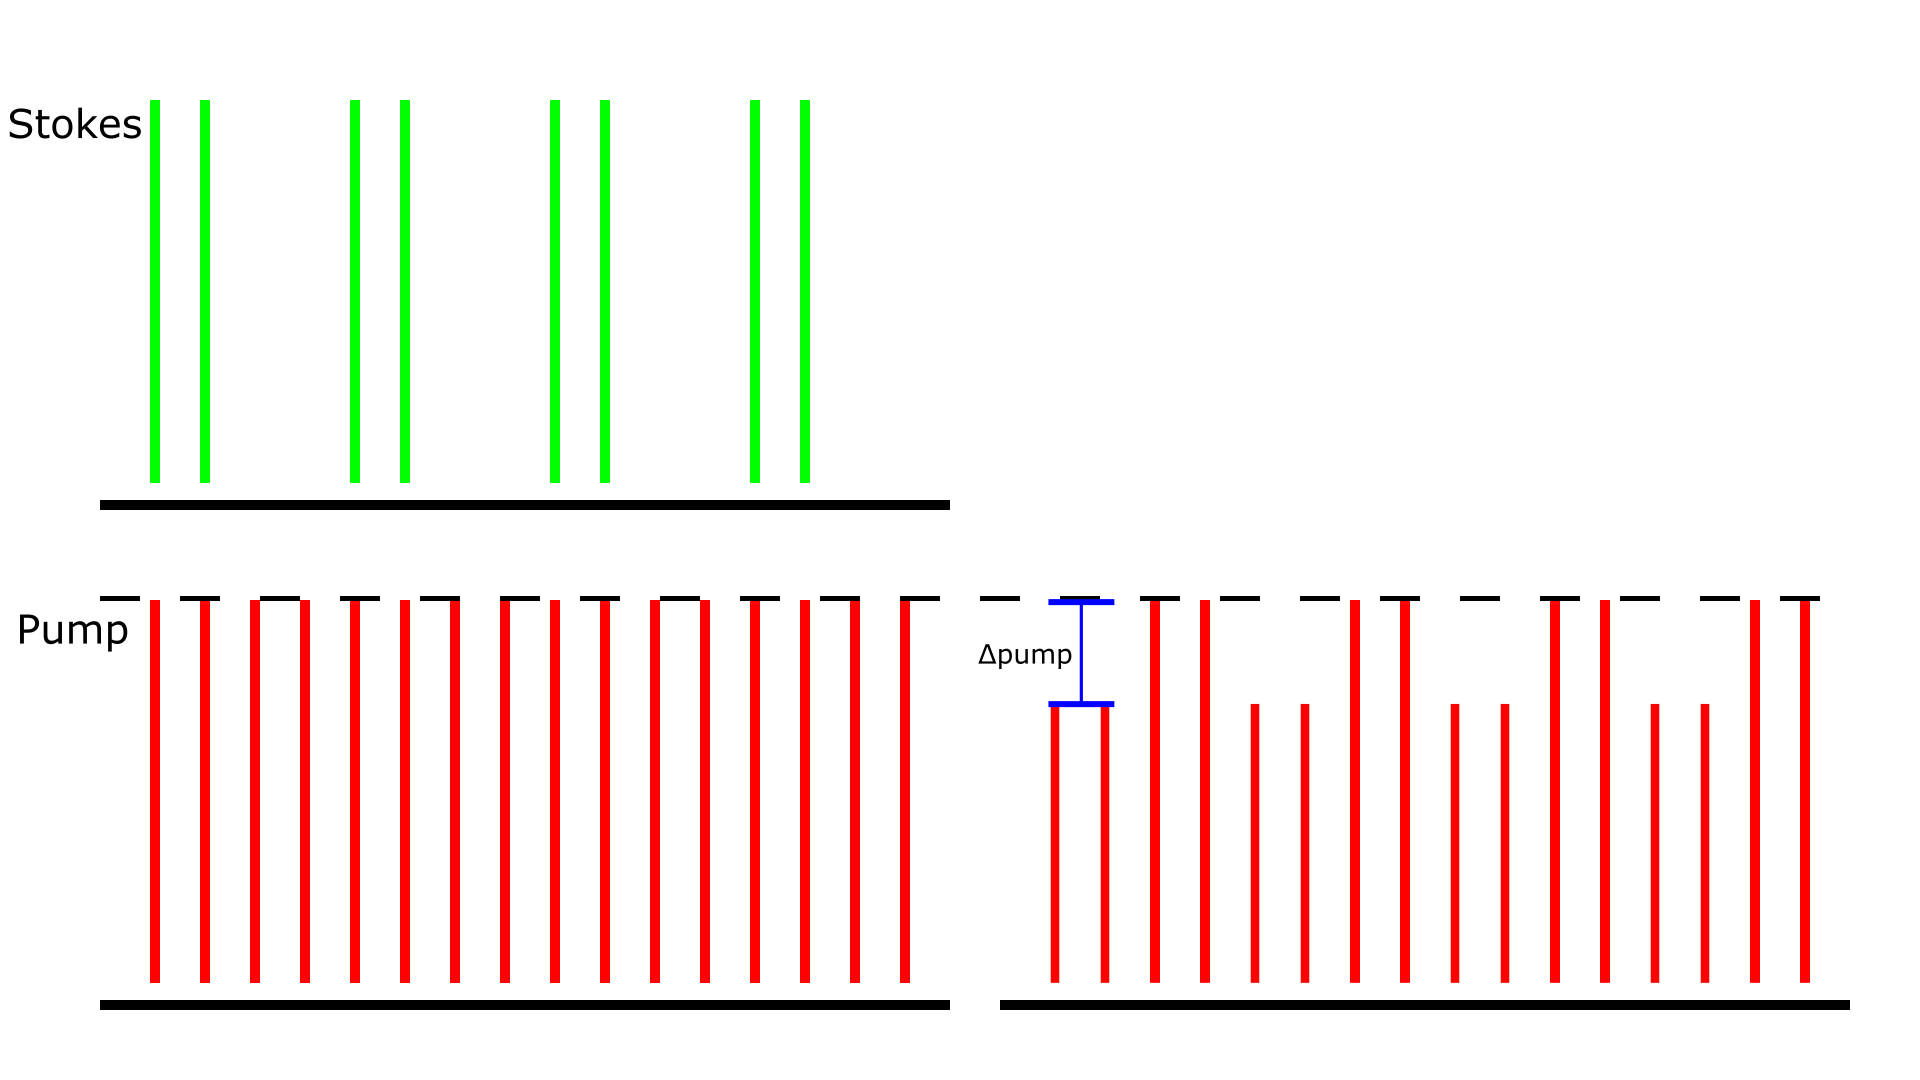
Figure 1: Stimulated Raman Loss detection scheme. The amplitude modulation transfer of Stokes to the pump beam due to SRS is detected. The demonstrated pump beam has a repetition rate of 80 MHz, and the Stokes beam has the same 80 MHz repetition but is also modulated at 20 MHz. The Δpump is what the LIA extracts in this detection scheme.
Instrumentation
The utilized laser system is capable of outputting two laser pulse trains at 80 MHz: the Stokes beam is at 1030 nm, and the pump beam is at 790 nm. The laser output is also used to synchronize the modulation: the 80 MHz reference is sent to a frequency divider to generate 20 MHz TTL output. These 20 MHz output are utilized twice: once as the driving frequency for the Electro-Optic Modulator to modulate the Stokes beam and once again as the reference into the input channel 2 (In B) of the LIA for the external phase-locked loop. The pump beam is detected by a silicon photo-diode, which is then sent to the input channel 1 (In A) of the LIA. The signal from output channel 1 (Out A) is sent to a data acquisition card to for image acqusition. The signal from output channel 2 (Out B) is minimized (by adjusting the phase shift).
Single channel Lock-in Amplifier configuration
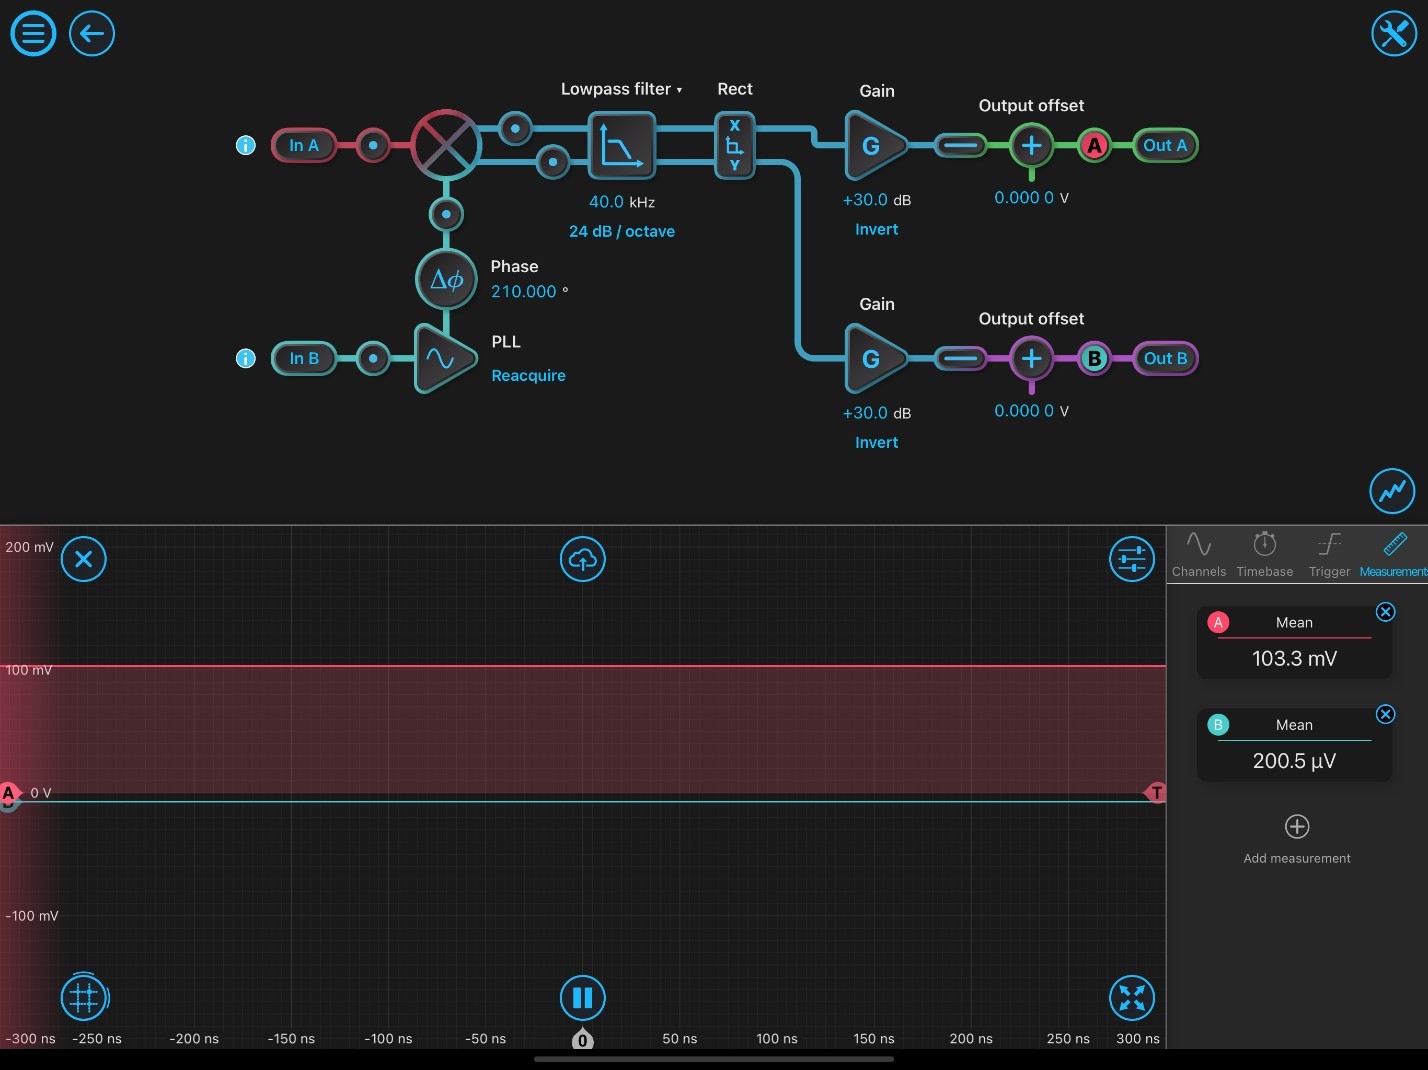
Figure 2: Typical Lock-in Amplifier Configuration Settings. Figure 2 demonstrates the initial settings of the LIA for use in SRS microscopy experiments. At initial setup, the phase-locked loop has to be reacquired. The inputs are configured to both be AC: 50 ohms. The phase shift (Df) is optimized by adjusting the phase degrees until Out A is maximized (positive value) and Out B is minimized (close to zero). Probe A shows SRS signal corresponding to the highest signal peak of DMSO (2913 cm-1) and is maximized to output 103.3 mV out of Out A. Probe B indicates the orthogonal output, which is minimized to zero. Once the LIA is optimized for the calibration solvent, samples are ready to imaged.

Figure 3: SRS HeLa Cell Image at the 2930 cm-1 Raman transition. Figure 3 is an image of HeLa cells taken using Moku:Pro Lock-in Amplifier. The shown image is generated from the SRS image at a Raman shift of 2930 cm-1, corresponding to the protein peak. The low-pass filter is set at 40 kHz, corresponding to a time constant of ~4 µs. The gain can be increased or decreased depending on the SRS signal size.
Dual channel imaging
Moku:Pro’s LIA can also be adapted for real-time two-color SRS imaging. This is performed by applying orthogonal modulation in SRS imaging and detecting both X and Y outputs of the LIA.3 In this case, the Stokes modulation has two parts: one 20 MHz pulse train that generates a SRS signal and another 20 MHz pulse train with 90° phase shift that generates another SRS signal targeting a different Raman band. Because of the 90° phase shift, the two channels (Out A and Out B) are orthogonal to each other and two SRS images can be acquired simultaneously without interference.


2850 cm-1 Lipid 2930 cm-1 Protein
Figure 4: Simultaneous two-channel SRS images of murine brain samples at two different Raman transitions using orthogonal modulation and outputs. Figure 4 is a representative image of utilizing dual channel X&Y outputs to generate two SRS images at 2930 cm-1 and 2850 cm-1 simultaneously.
Multi-Instrument Mode application
In most SRS microscopy experiments, the spectral range is limited to about 300 cm-1 because of limitations in the total bandwidth of the lasers. One approach to circumvent this technological barrier is to scan through wavelengths with the tunable laser. However, wavelength tuning is slow and often insufficient for experiments that are time sensitive such as live cell imaging. An alternative solution to this challenge is the introduction of a third laser beam to scan a different Raman transition region. This capability is especially appealing for simultaneous imaging of two spectral regions: one in the fingerprint region (e.g. ~1600 cm-1 for Amide vibration) and one in C-H region (e.g. ~2900 cm-1 for protein). In the SRL imaging approach, the experimental setup consists of one Stokes beam and two pump beams with different wavelength. The usual detection method for this setup requires separate detectors and separate LIAs. However, Moku:Pro’s Multi-Instrument Mode allows the deployment of multiple LIAs and so the second LIA can be implemented without the need for any additional hardware compromises
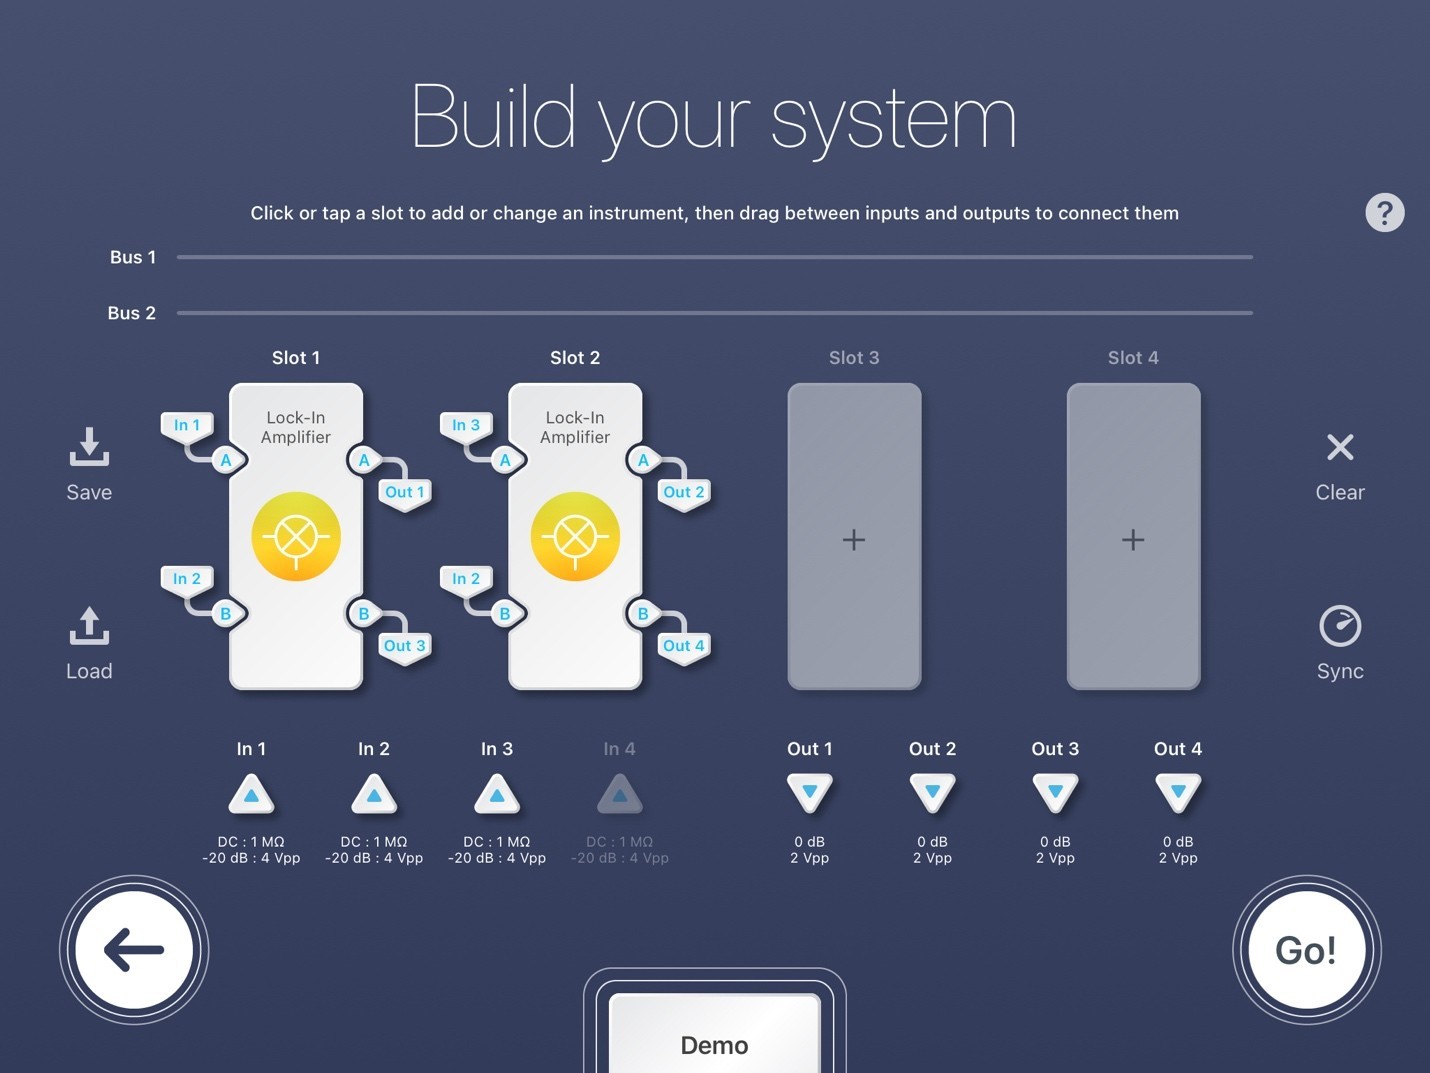
Figure 5: Moku:Pro Multi-Instrument Lock-in Amplifier configuration. Figure 5 demonstrates the multi-instrument mode settings of the LIA for simultaneous SRS microscopy experiments. For Slot 1, In 1 is the detected signal of the first photodiode, In 2 is the reference, Out 1 is the signal sent to the data acquisition card, and Out 3 is discarded. For Slot 2, In 3 is the detected signal of the second photodiode, In 2 is once again the reference, Out 2 is the signal sent to the data acquisition card, and Out 4 is discarded. This configuration uses just 2 of the 4 Moku slots. Slots 3 and 4 are unassigned, thus are available for further LIAs or any other Moku instrument. The inputs are all configured to be AC: 50 ohms. Each LIA Slot (1 and 2) follows the same setup as the single channel LIA configuration. Each detected signal (Out 1 and 2) sent to the data acquisition card should be maximized by adjusting their individual phase shifts. In the case of three lasers, Moku:Pro’s Multi-Instrument Mode can be configured with two lock-in amplifiers, simplifying the system down to one device without compromises. This allows researchers to take two SRS images of large wave number difference simultaneously, utilizing one Moku:Pro to process two photodiode detector signals.


2930 cm-1 Protein 2125 cm-1 C-D
Figure 6: HeLa cell SRS images taken with the multi-instrument setup at widely spaced apart Raman transitions. Figure 6 is a representative image of taking two SRS images of large wavenumber difference simultaneously utilizing one Moku:Pro to process two photodiode detector signals.
Conclusion
Moku:Pro’s LIA provides an excellent solution for a multitude of SRS microscopy experiments. In this document, typical single channel SRS imaging, dual channel imaging, and multi-instrument imaging were discussed. The user interface allows for intuitive and powerful controls for extracting the low-intensity SRS signal. Importantly, Moku:Pro’s multi-instrument tool functionality allows for complex imaging experiments on a compromise-free compact system.
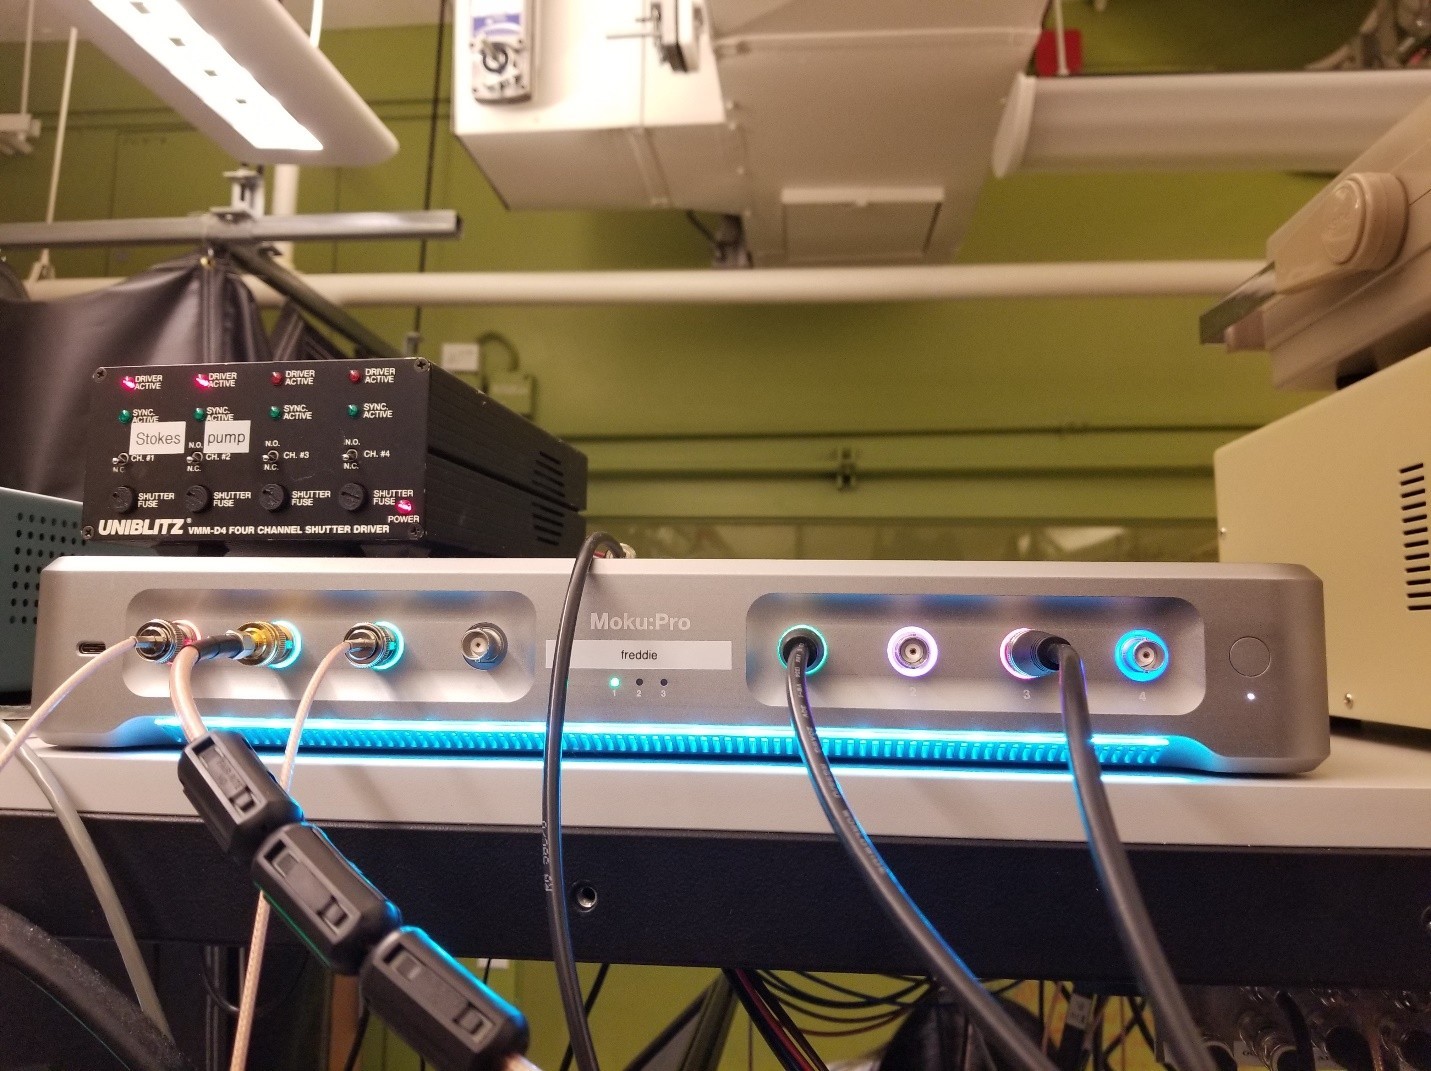
Figure 7: Image of Moku:Pro in Multi-Instrument Mode in use. In 1 and In 3 are signal inputs for the LIA in Slot 1 and Slot 2 respectively. In 2 is the reference for both LIA slots. In the shown configuration, Out 1 and Out 3 are the recorded signals, Out 2 and Out 4 are the dumped signals for Slots 1 and 2.
References:
- Freudiger, W.; Min, W.; Saar, B. G.; Lu, S.; Holtom, G. R.; He, C.; Tsai, J. C.; Kang, J. X.; Xie, X. S., Label-Free Biomedical Imaging with High Sensitivity by Stimulated Raman Scattering Microscopy. Science 2008, 322 (5909), 1857-1861.
- Hill, H.; Fu, D., Cellular Imaging Using Stimulated Raman Scattering Microscopy. Anal. Chem. 2019, 91 (15), 9333-9342.
- Figueroa, ; Hu, R.; Rayner, S. G.; Zheng, Y.; Fu, D., Real-Time Microscale Temperature Imaging by Stimulated Raman Scattering. The Journal of Physical Chemistry Letters 2020, 11 (17), 7083-7089.
