Techniques for detecting phase with Moku
The ability to accurately measure the phase difference between propagating electromagnetic waves is critical for many science and engineering applications, as this quantity often carries valuable information.
It is especially important in microscopy, where the phase difference between two paths of an interferometer can determine the thickness of the sample under test. In quantum information technology, information regarding the state of a qubit is often encoded via a phase shift of the readout pulse. Likewise, optical communication through both fiber and free space make use of modulation techniques such as phase-shift keying, allowing information to be encoded into the phase changes of a carrier wave.
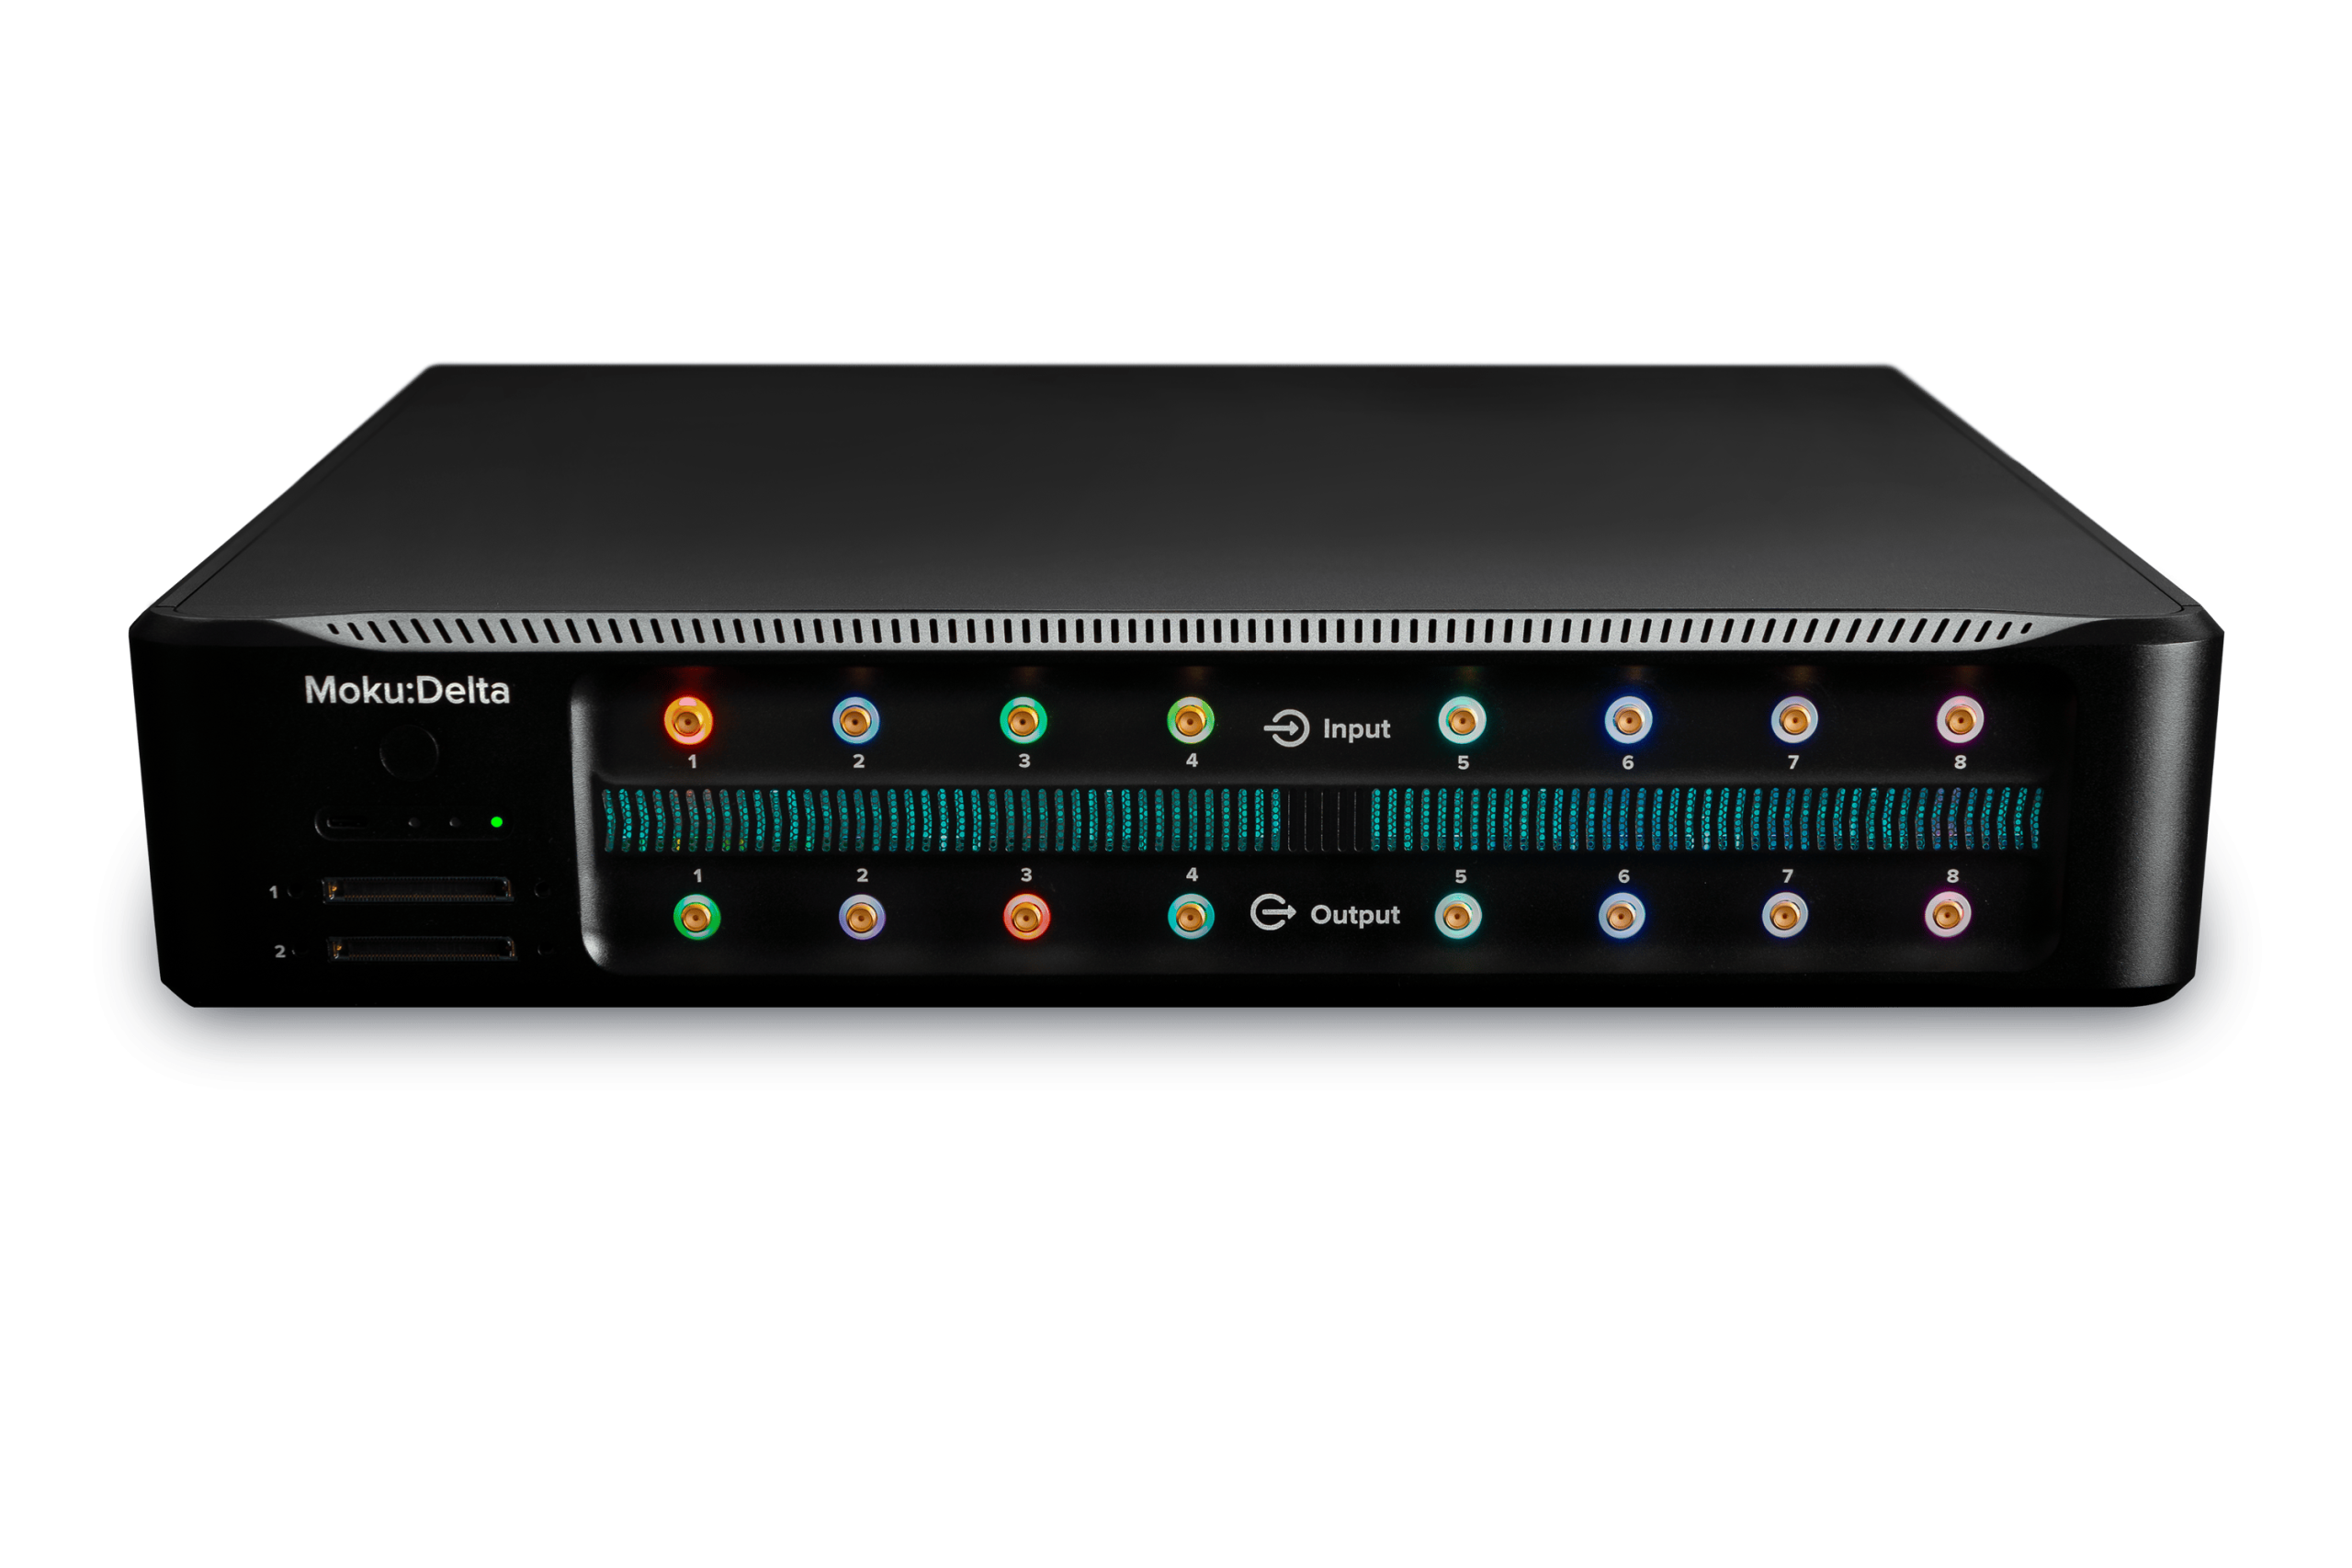
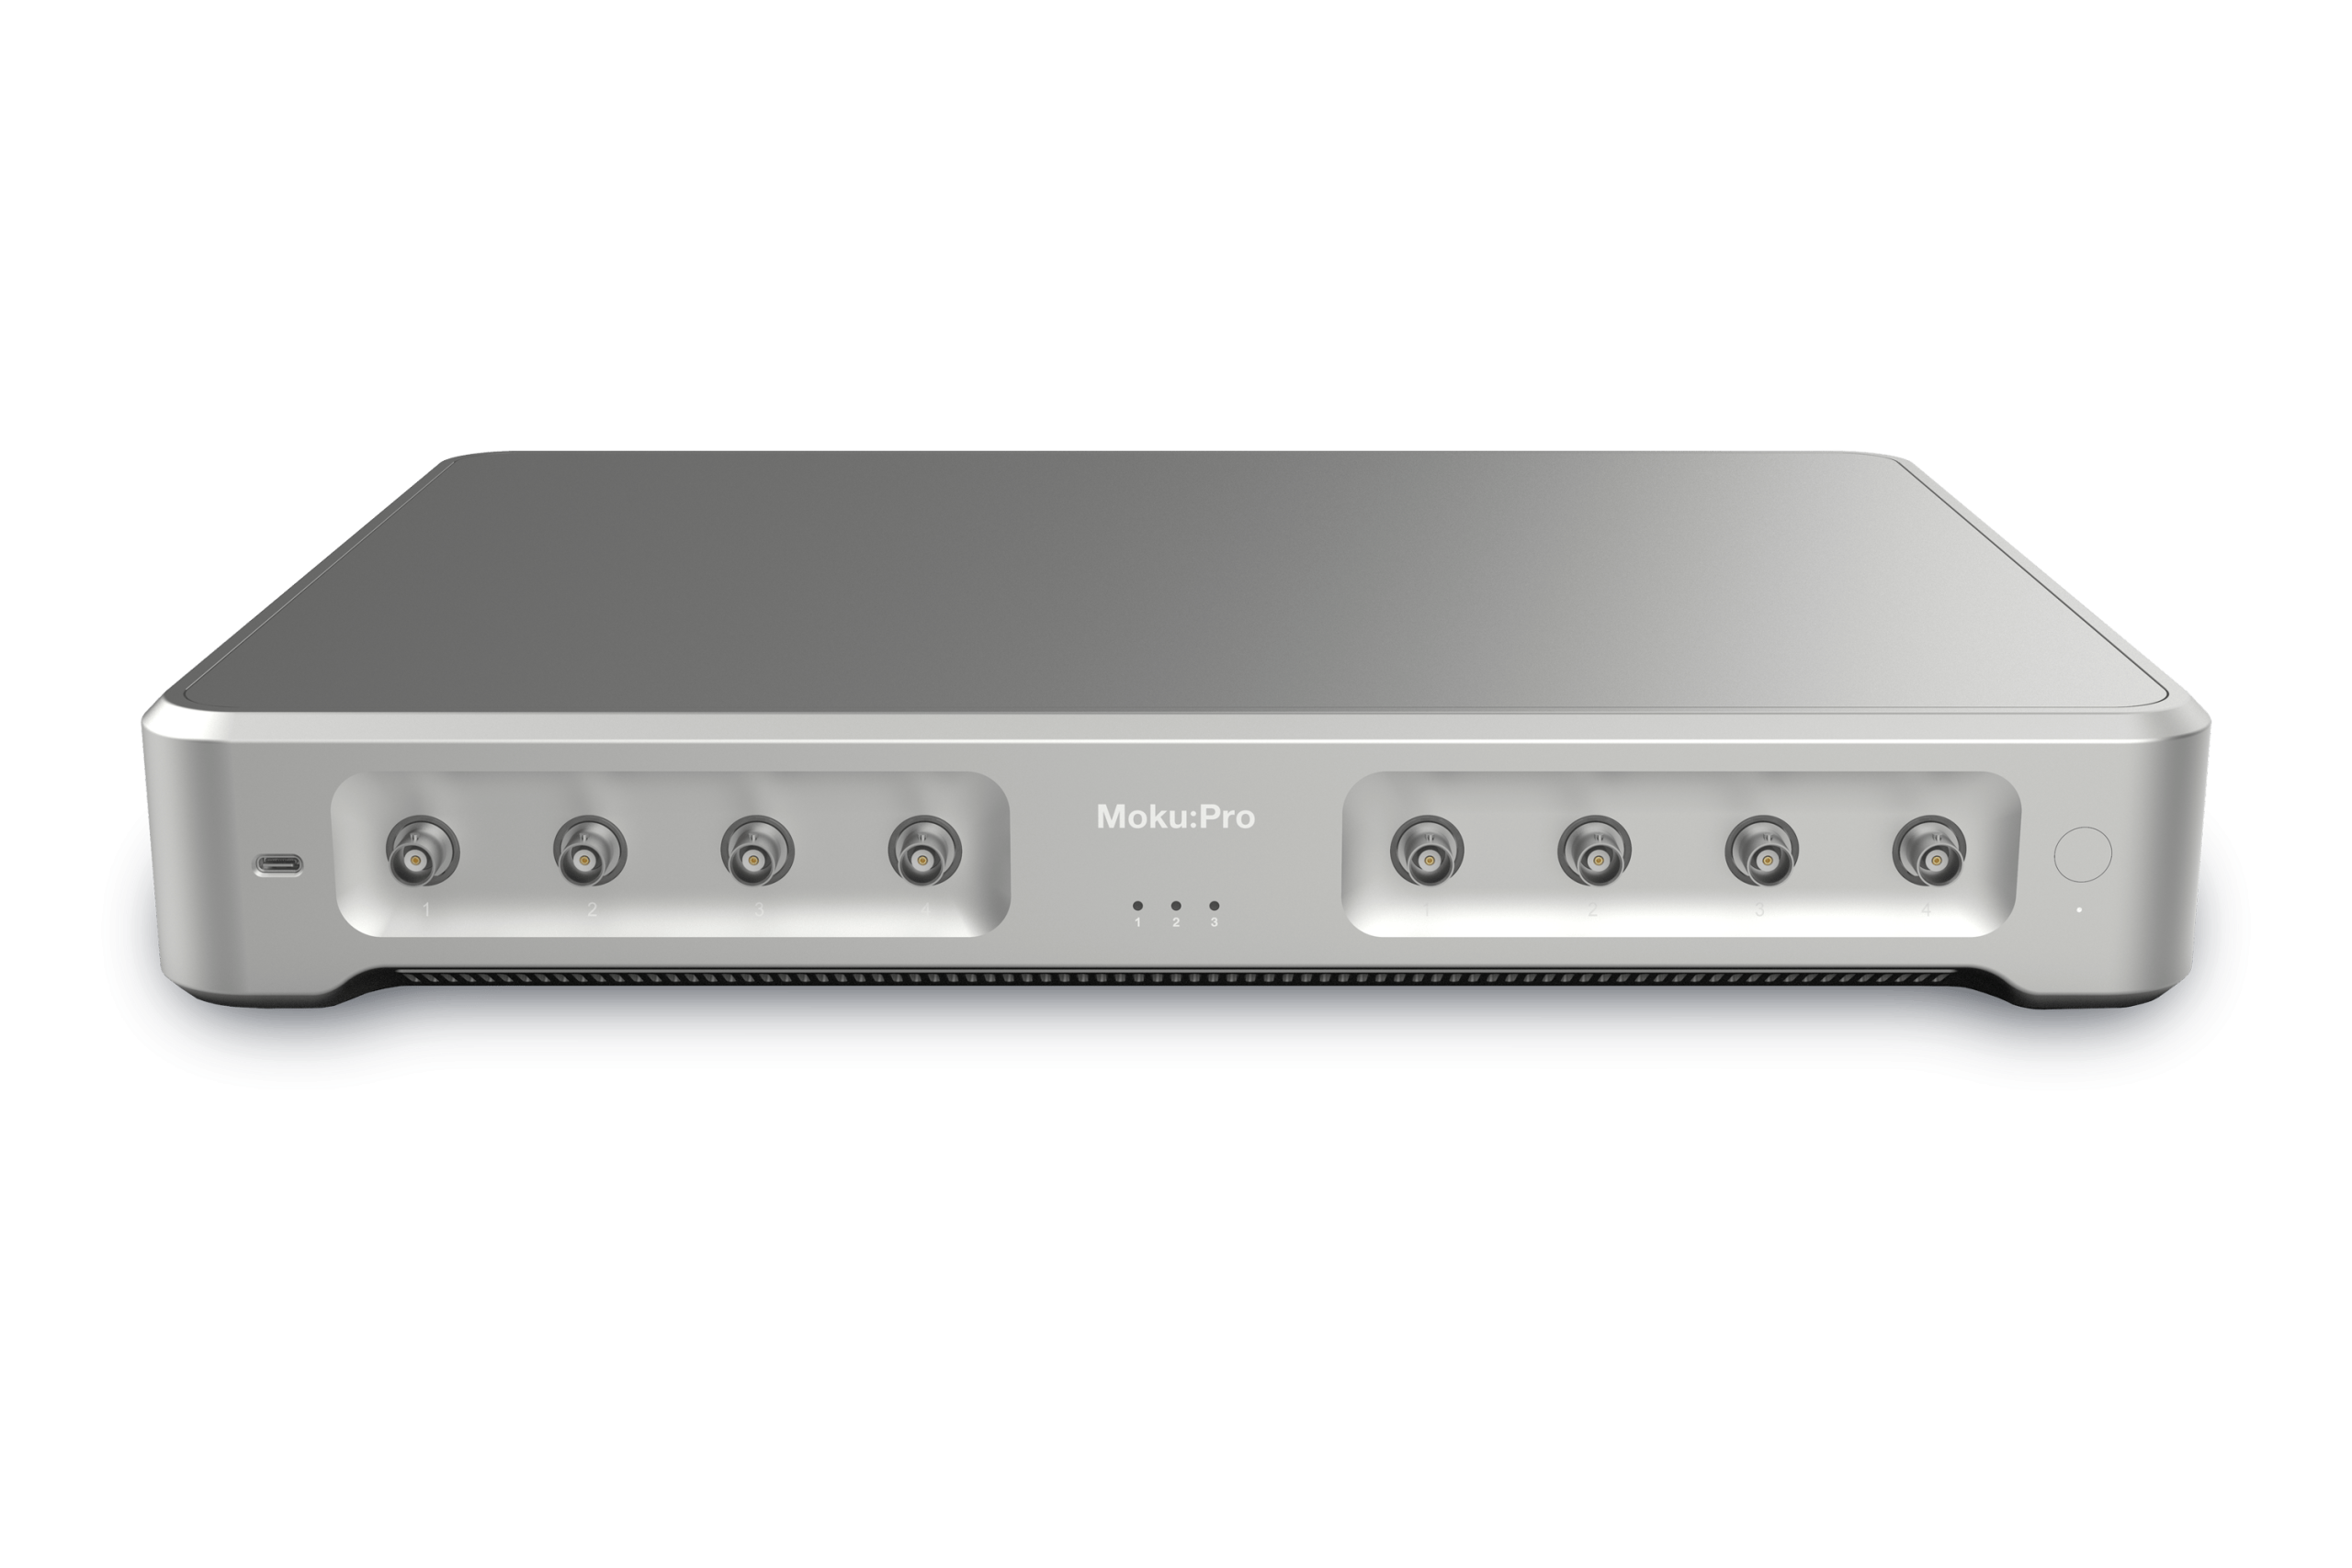
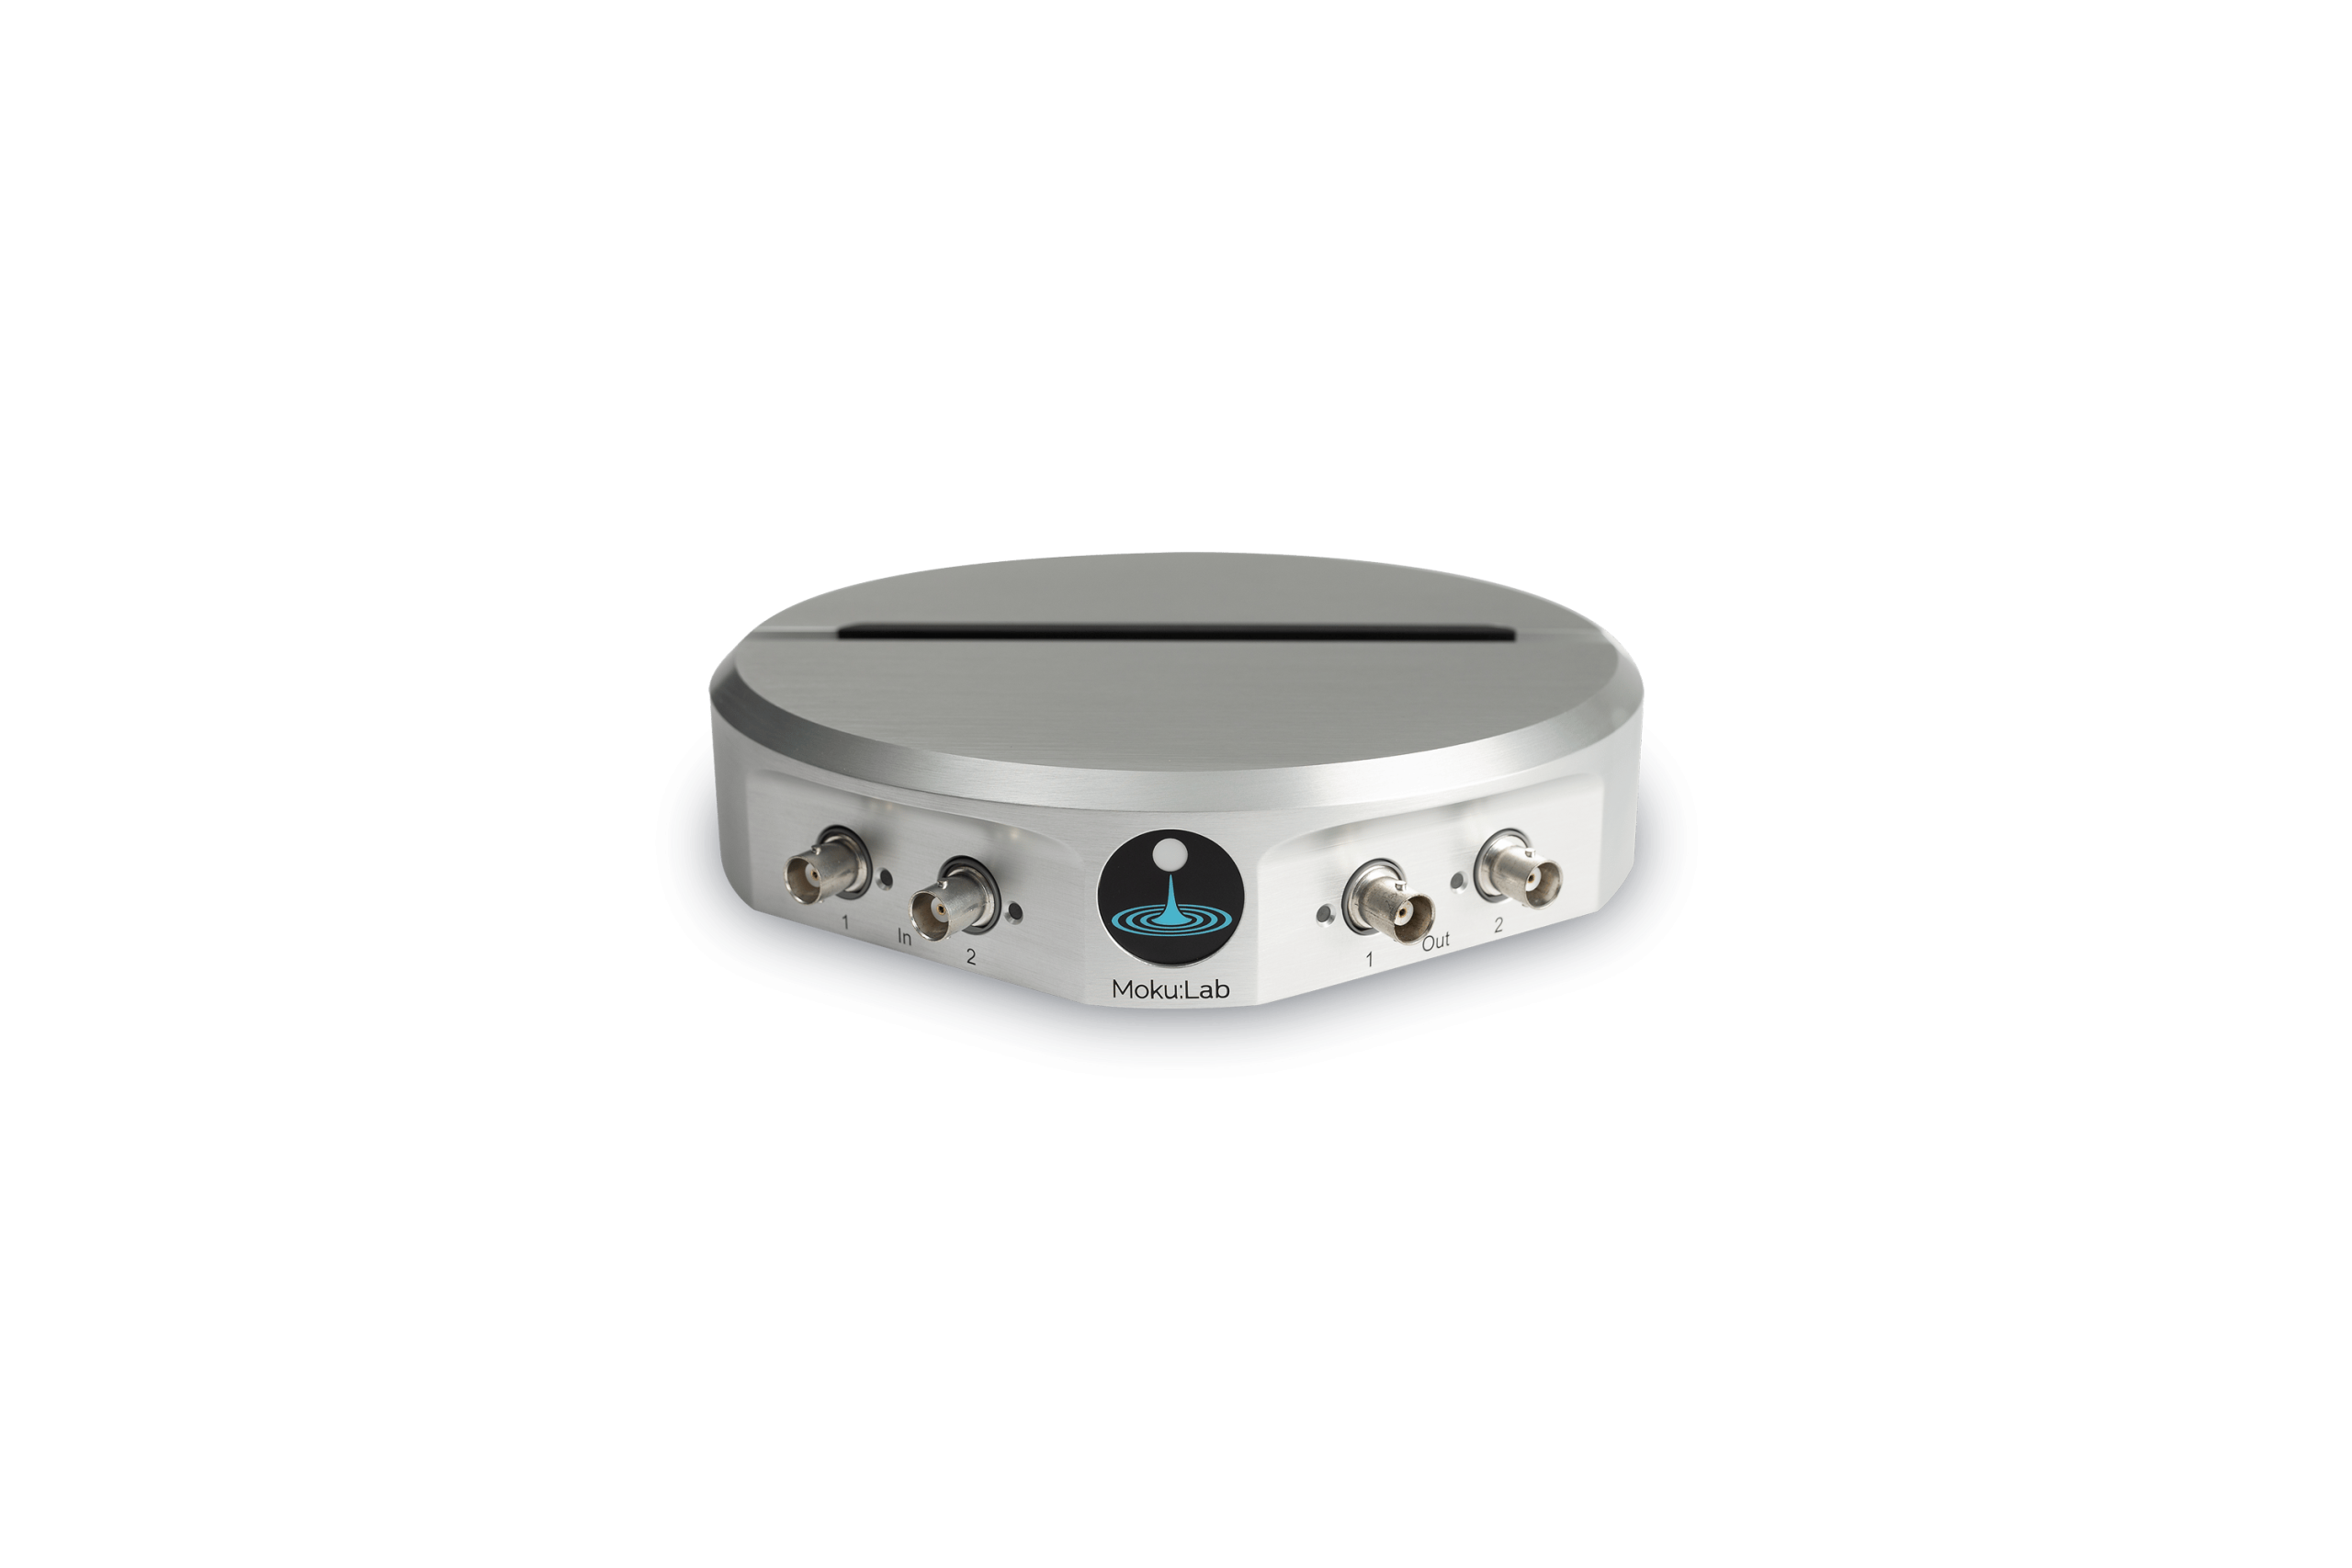
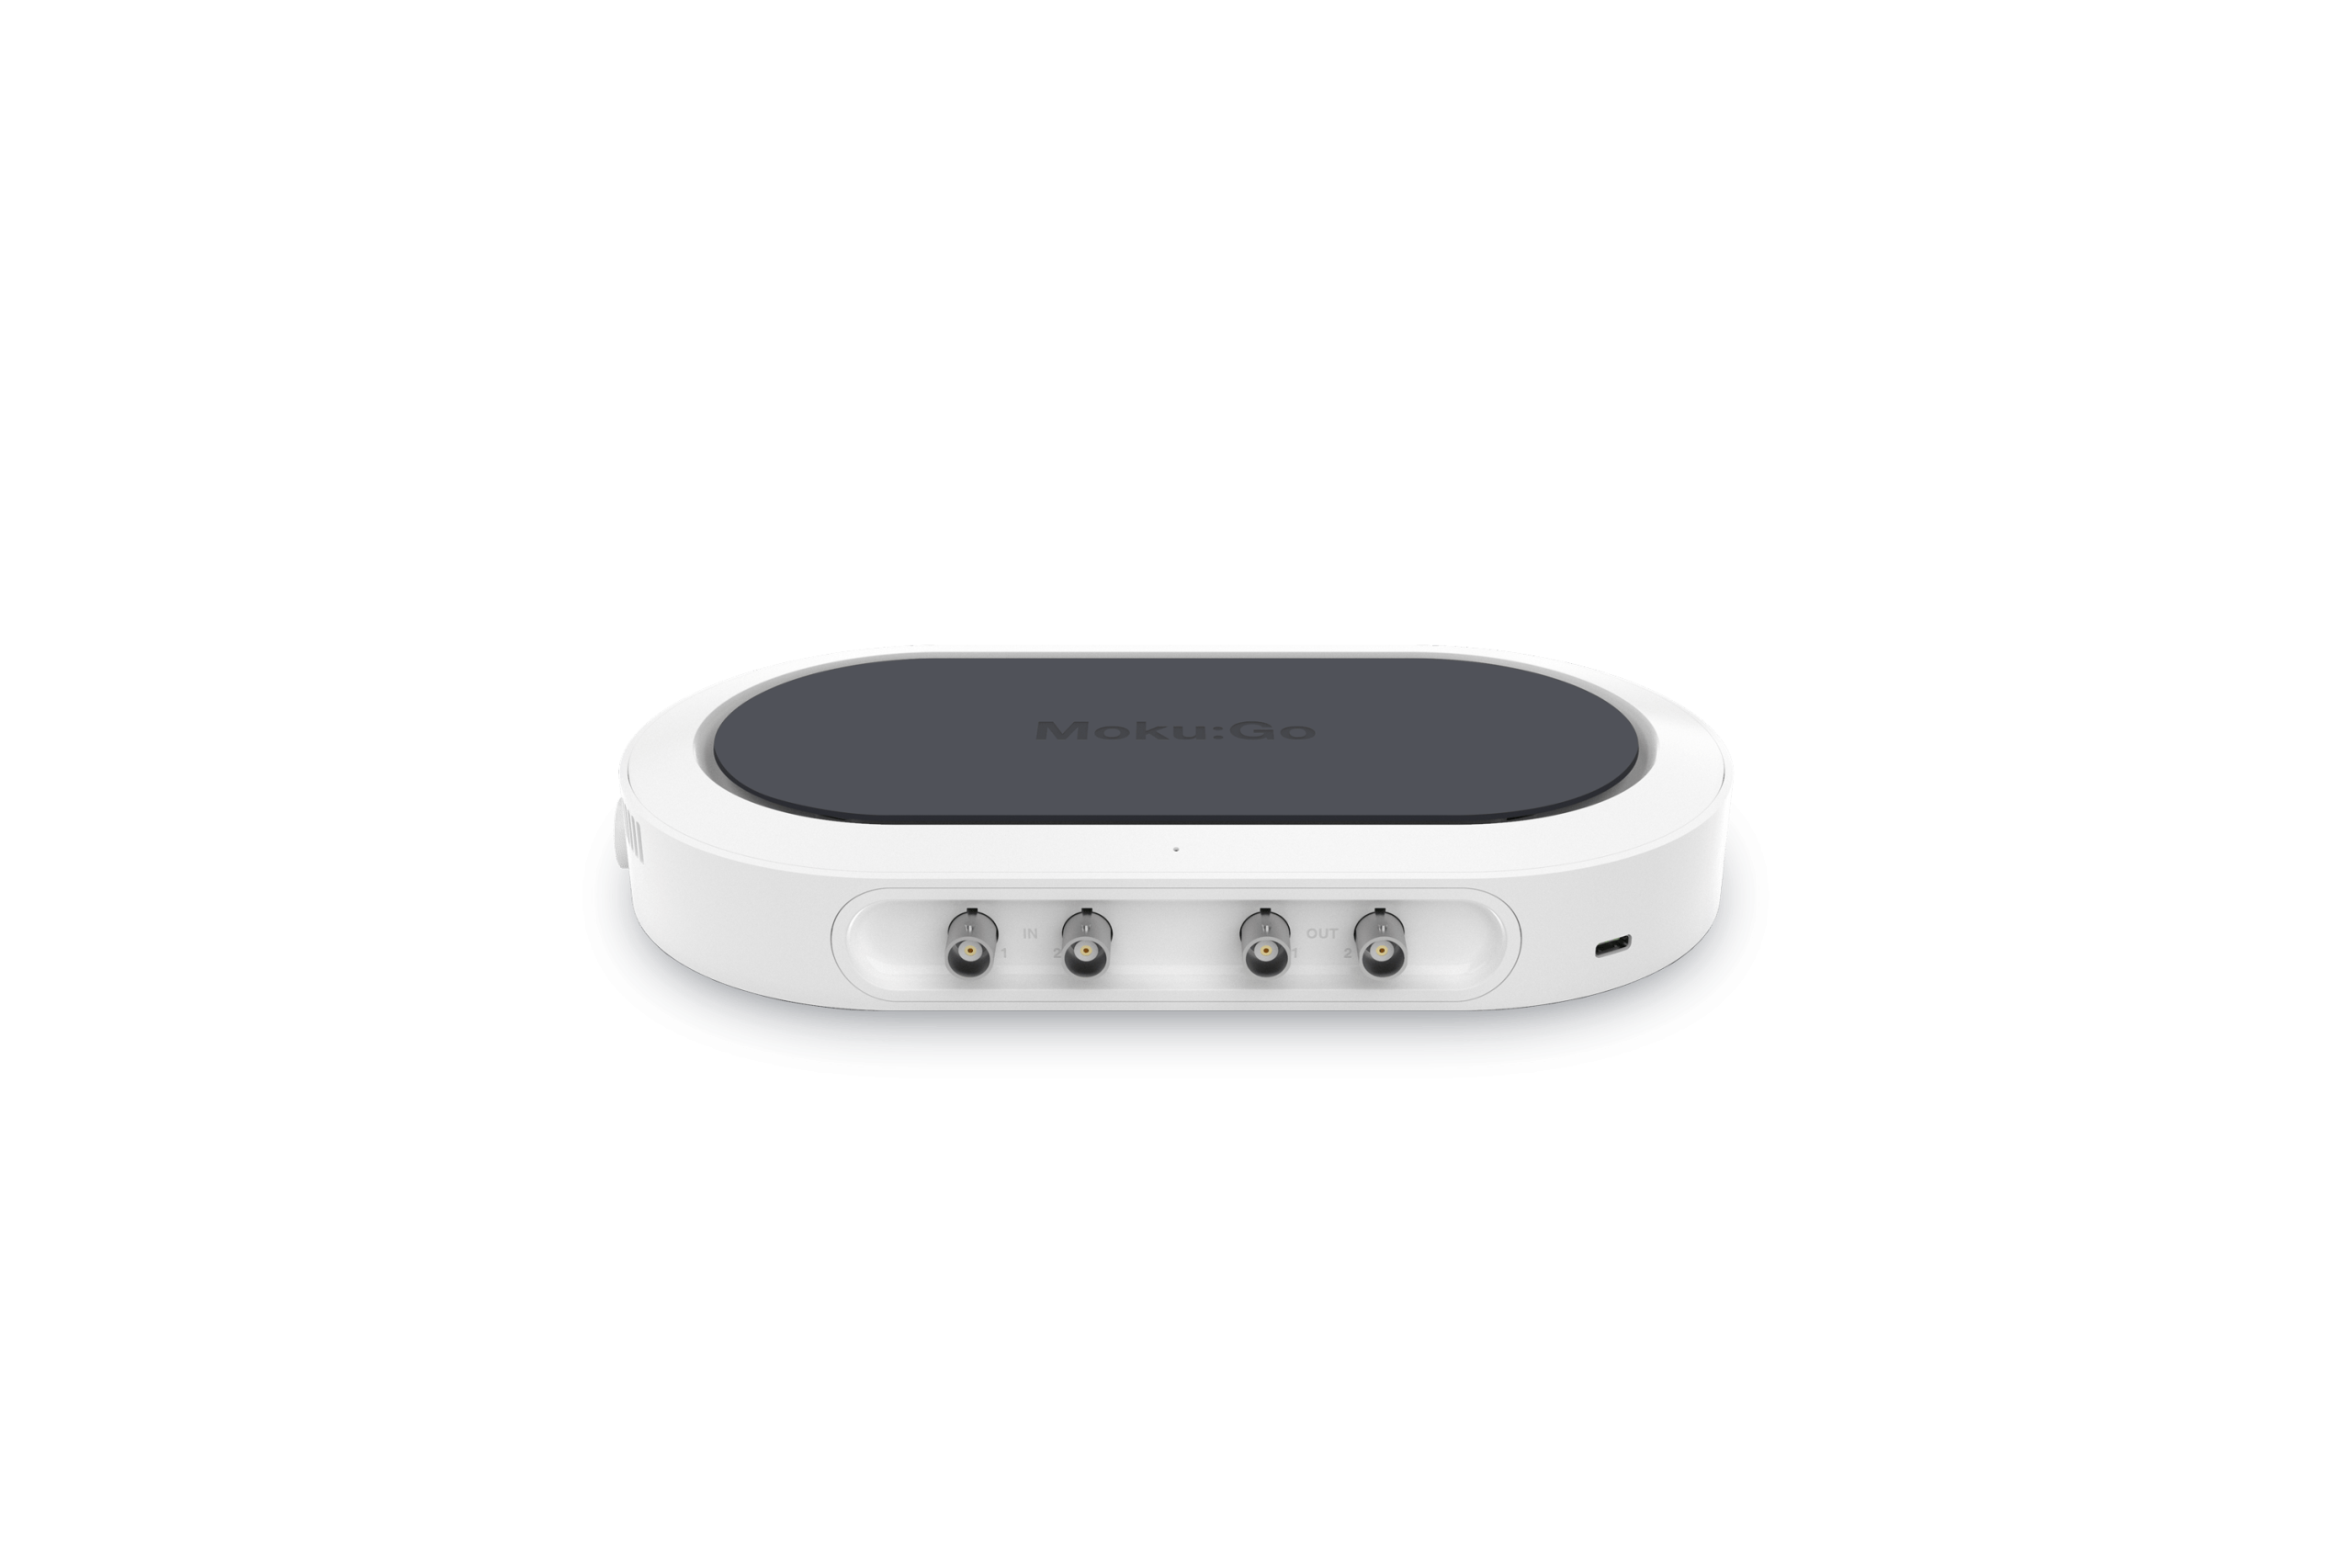
In this configuration guide, we describe four techniques for phase detection using Moku, an FPGA-based platform from Liquid Instruments that offers a reconfigurable suite of 15 test and measurement instruments. These range from standard laboratory equipment like an Oscilloscope and Spectrum Analyzer to more advanced tools such as the Time & Frequency Analyzer, Lock-in Amplifier, and Phasemeter. Next, we provide step-by-step instructions for using each of these instruments to perform accurate phase detection.
There are several ways to measure the relative phase between a signal and a reference, each with varying degrees of precision and complexity. In this section, we provide configuration guides for four different methods of phase measurement, each using a different Moku instrument. We also discuss the merits of each technique and provide step-by-step instructions to enable accurate phase detection.
Demodulation-free methods
The two methods presented in this section rely on direct digitization and capture of the input signal. They do not involve mixing the signal with a local oscillator or reference signal.
Direct measurement with the Moku Oscilloscope
Oscilloscopes are ubiquitous in lab environments because they are a versatile tool for debugging and verifying signals. While they are intuitive and excellent for quick measurements, this often comes at the cost of precision. Like other digital oscilloscopes, the input signal of the Moku Oscilloscope is digitized via an ADC before being passed to the instrument memory. The Moku Oscilloscope will directly capture a number of points, determined by the time span and sampling rate, after being triggered. To plot data on-screen in real time, it is first decimated or averaged, depending on the acquisition mode, and then connected by an interpolator function to appear continuous. Follow these steps using the Moku Oscilloscope:
1. Connect your device under test to the Moku analog front end, or set up Multi-Instrument Mode with the Waveform Generator in Slot 1 and the Oscilloscope in Slot 2. In the example provided, we use a separate Moku device to generate two identical sine waves of 1 MHz frequency, with a relative phase of 45°, as seen in Figure 1.
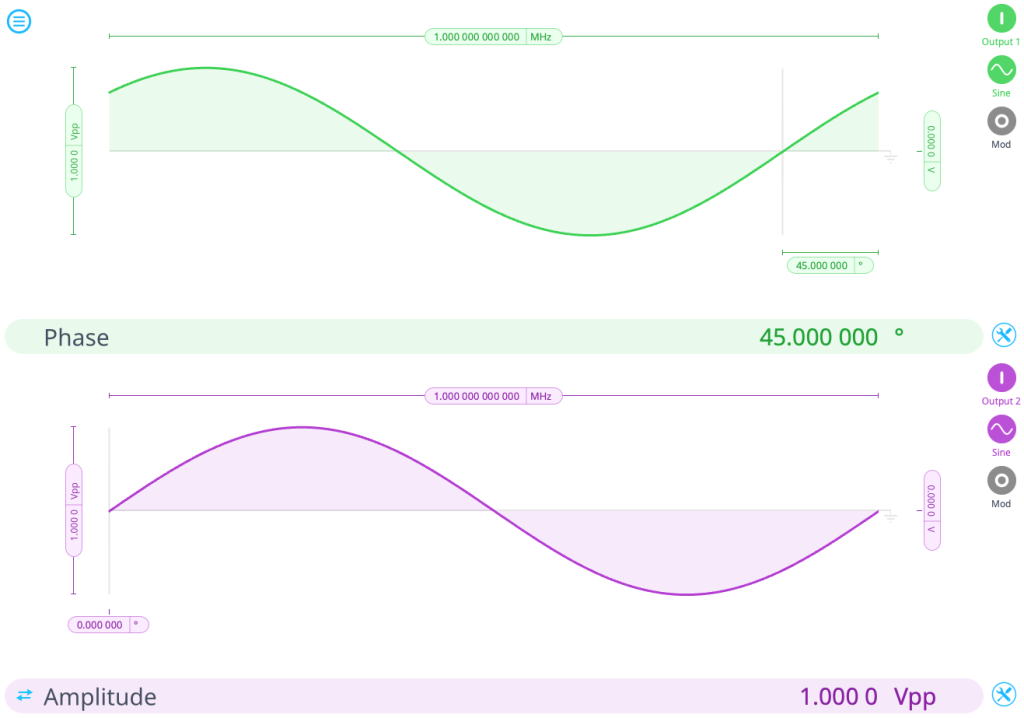
Figure 1: Two signals with 1 Vpp amplitude and 1 MHz frequency, with a 45° difference between them. These signals, produced using the Moku Waveform Generator, are used for all of the demos in this configuration guide.
2. Launch the Moku Oscilloscope either in single- or Multi-Instrument Mode depending on your configuration. Under the Channel tab, enable channels A and B.
3. Click to the Timebase tab and set an appropriate time span for the measurements, such as 20 µs. Leave the acquisition settings as the default for now. The default mode is Normal, which downsamples by picking a single point to display within a window. This contrasts with Precision mode, which downsamples by averaging across the same window. These methods can have different effects depending on the nature of the input signal.
4. From the next tab, Trigger, set the trigger mode, channel, and level. We will capture a trace automatically, using the input from Channel A as the triggering signal. As long as the trigger level lies in between the peak-to-peak voltage of your signal, the exact value does not matter for this example. We set it to 0 V on a rising edge, as seen in Figure 2.
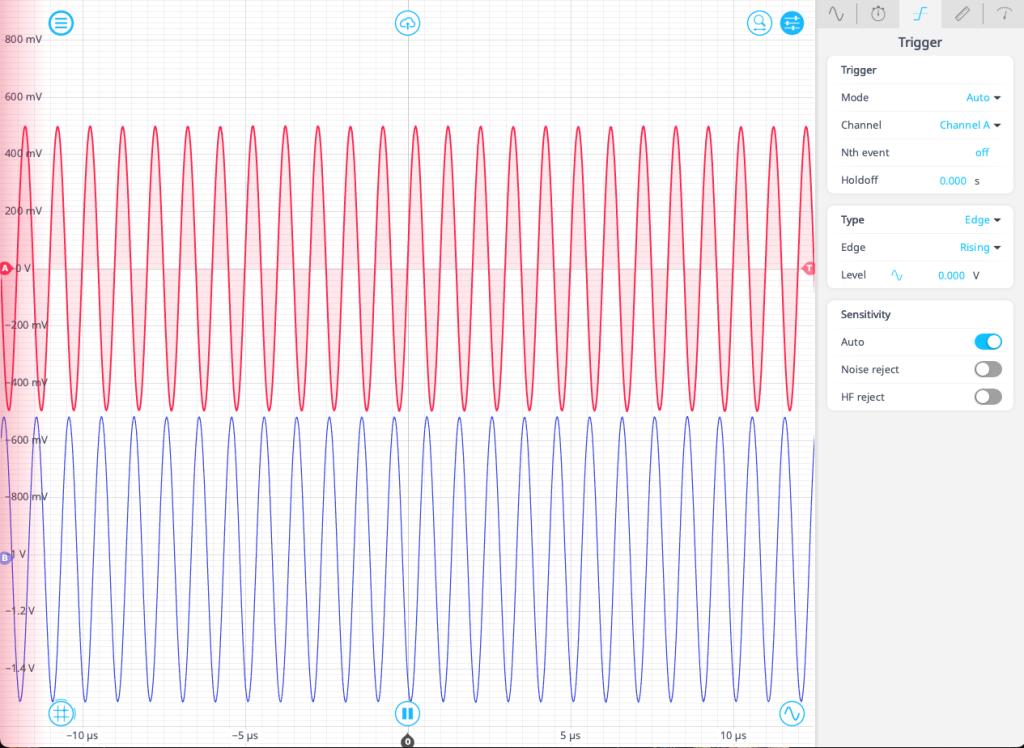
Figure 2: Direct capture of the two signals using the Moku Oscilloscope.
5. Using the options on the next tab, it’s easy to add measurements. Click “add,” then select the type of measurement. Here, we add two frequency measurements, one for each channel, and a differential measurement of the phase between B and A. The Oscilloscope tracks the maximum and minimum points for each trace and calculates the phase delay via the expression \(\Delta\phi = t_d / t_p \times 360^{\circ}\), where \(t_d\) is the time delay between maximums of two traces and \(t_p\) is the period of the trace. We can verify this by right-clicking on the screen and adding three time markers to the plot: two on channel A and one on channel B. Move each of the markers to a local maximum as seen in Figure 3. Quickly check the math by taking the ratio of the delay time to the period:
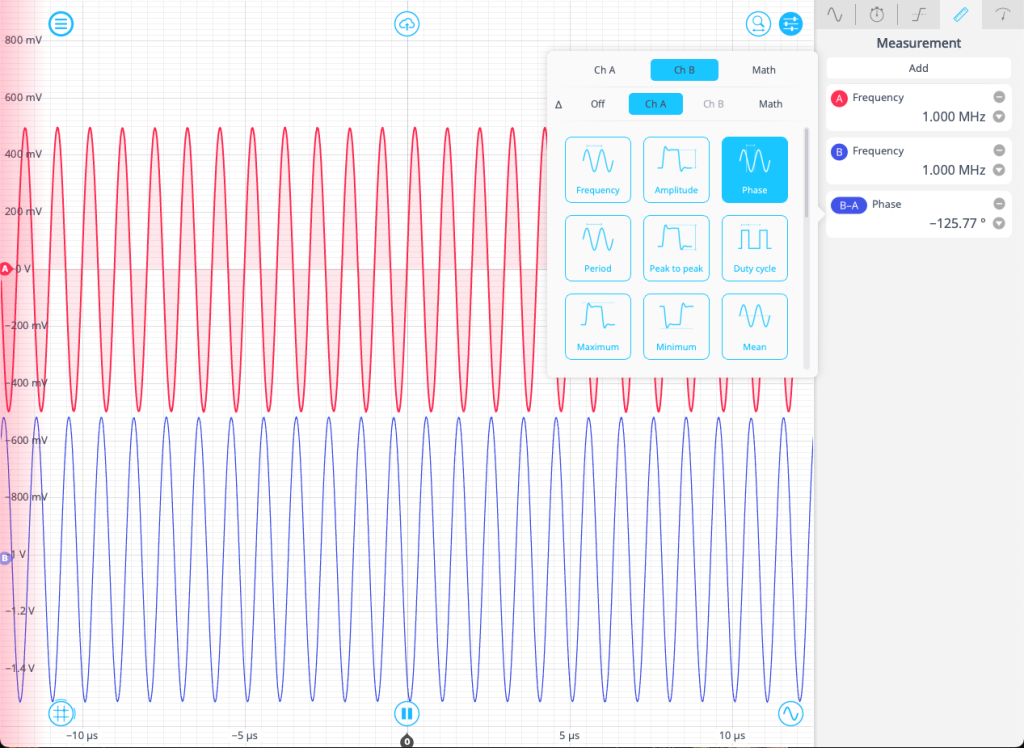
Figure 3: Measuring the phase difference using markers on the Moku Oscilloscope.
6. You will notice that the measured phase fluctuates due to jitter, limiting the attainable precision. If more precision is desired, return to the Timebase tab and increase the averaging. Doing so allows the measured quantities to stabilize, but this comes at the cost of speed and the ability to detect fast transient behavior in the data. To characterize the jitter, see the next section.
7. You can export the traces in .csv format by clicking the cloud button in the top center of the display. This will also give you the option to log screenshots of the traces, as well as the current Oscilloscope settings.
8. Alternatively, you can use X-Y mode on the Oscilloscope to plot the Lissajous curve of the two signals. On the Oscilloscope screen, enable the Math channel and select the “XY” operation, which plots Channel A as a function of Channel B. Disable channels A and B. If the frequencies of the signals are the same, the curve will form an ellipse with the eccentricity and slope representing the phase information (see Figure 4). Two in-phase signals will form a straight line (4a) and two in-quadrature signals will form a circle (4c). Set a marker at the points where the curve crosses the y-axis (A) and where the plot reaches its maximum (B). See Figure 4d for an example. The phase can then be calculated using the following equation:
\(\Delta\phi = \pm \arcsin\left({Y_{x=0}/Y_{max}}\right)\)
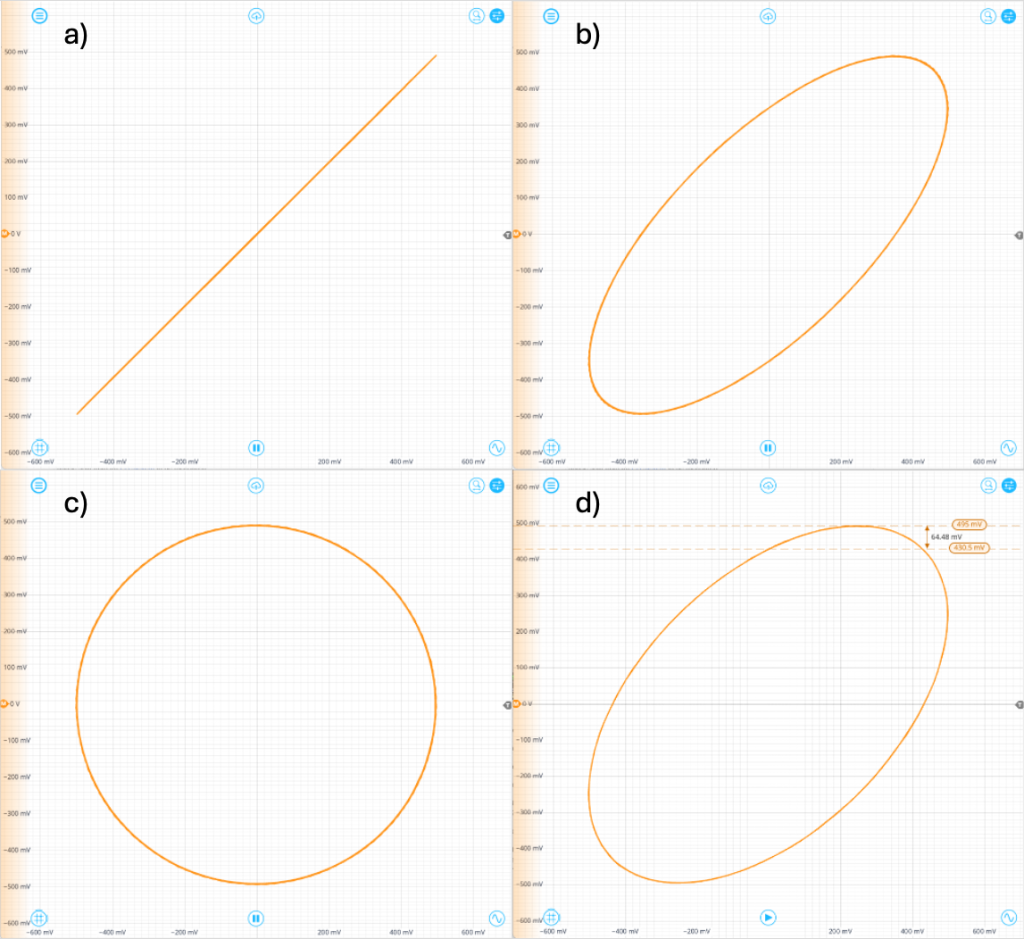
Figure 4: Lissajous curves for two equal frequency signals. a) In-phase (0°) b) 45° c) 90° d) The phase can be calculated by \(\Delta\phi = \pm \arcsin\left({Y_{x=0}/Y_{max}}\right) = \arcsin\left({430.5 mV/495 mV}\right) = 60^{\circ}\).
Oscilloscopes offer a cheap and efficient way to make instantaneous phase measurements. For these reasons, they are effective for quick debugging in real time, a convenience that comes at the cost of resolution — usually 1 to 2 digits at most — and a limitation of the phase measurement to a range of 2π. Oscilloscopes are also useful tools for measuring time-dependent behavior, since they directly capture the signal. However, they cannot track long-term trends or drifts in signals. Averaging, in turn, sacrifices the knowledge of instantaneous behavior for more precision.
Direct measurement with the Moku Time & Frequency Analyzer
A second direct measurement of phase can be performed using a time interval analyzer such as the Moku Time & Frequency Analyzer. Such instruments can precisely measure time differences between trigger events, typically using a digital delay line. With regard to Moku, this delay line is implemented entirely via software on the FPGA. These interval measurements can then be converted into a period or phase delay measurement. To perform this measurement using the Moku Time & Frequency Analyzer, follow these steps:
1. Connect your device under test to the Moku analog front end, or set up Multi-Instrument Mode with the Waveform Generator in Slot 1 and the Oscilloscope in Slot 2. For this example, we use a separate Moku device to generate two identical sine waves of 1 MHz frequency, with a relative phase of 45°.
2. Launch the Time & Frequency Analyzer instrument in single- or Multi-Instrument Mode depending on your configuration. Under the Events tab, enable events A and B. Events will trigger when the voltage of the input signal exceeds the threshold with the appropriate edge. Set the threshold on both events to be 0.00 V on a rising edge. See Figure 5 for the event configuration.
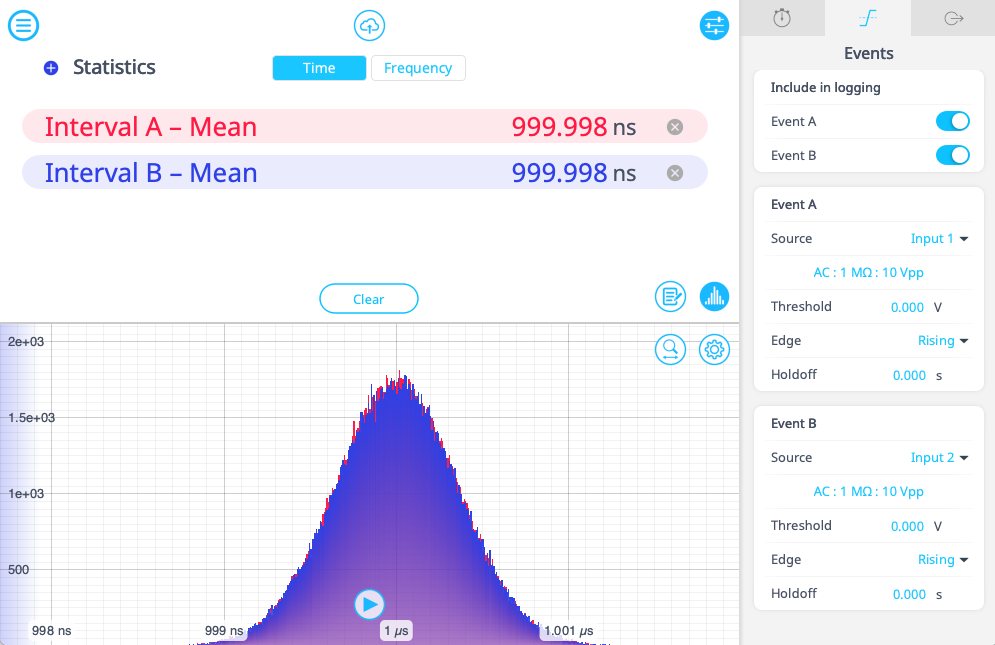
Figure 5: Event configuration on the Moku Time & Frequency Analyzer.
3. Under the Intervals tab, enable interval A and set the start to Event A and stop to Event B. The Time & Frequency Analyzer will then measure the interval between events on Channels A and B, giving the time delay between the two periodic signals. Enable Interval B and set it so it measures from Event A to Event A. Under the Acquisition sub-menu, change the Mode to “Windowed,” and the window time to 200 ms. This means that the Time & Frequency Analyzer will only count events that occur within a period of 200 ms. The count will reset for subsequent windows (see Figure 6).
4. From the main menu, click the “+” near the Statistics options. This will add a new row to the list of parameters that are being tracked by the Time & Frequency Analyzer. Click on the text to switch between intervals and parameter types to track. Make sure it is set to measure the mean on Interval A, as this is our parameter of interest. Add another statistic to measure the mean of Interval B, as seen in Figure 6, which gives the period of the signal. The phase difference can then be calculated via the equation:
\(\Delta\phi = \pm \arcsin\left({Y_{x=0}/Y_{max}}\right)\)
5. Double-click the window with the histogram to autoscale it to the region of interest. As opposed to measuring the phase with the Oscilloscope, the histogram displays every interval measured by the Time & Frequency Analyzer during the window period. This allows you to visualize the jitter in real time via the shape and distribution of the histogram. To analyze the values of the histogram, click the cloud icon and export the data in .csv format.
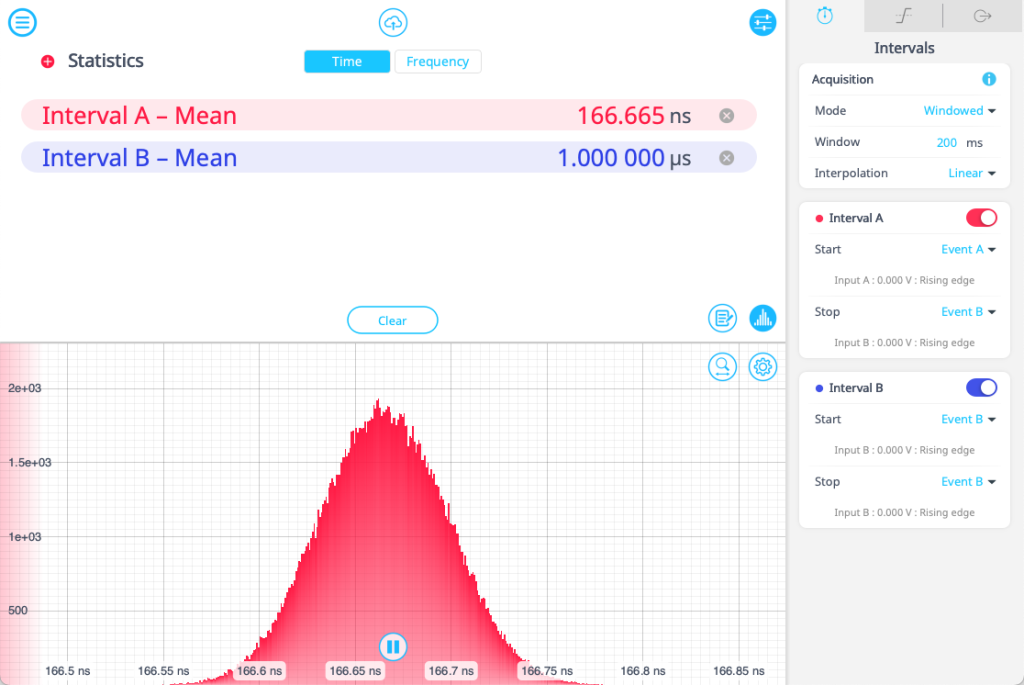
Figure 6: The Moku Time & Frequency Analyzer interface, showing the interval configuration, statistics, and histogram.
6. To record raw timestamped data for deeper analysis, start a collection by clicking on the data logging icon (see Figure 7). This disables the histogram, but allows you to track longer-term changes in the stability of your system, as the window is limited to a length of 10 seconds.
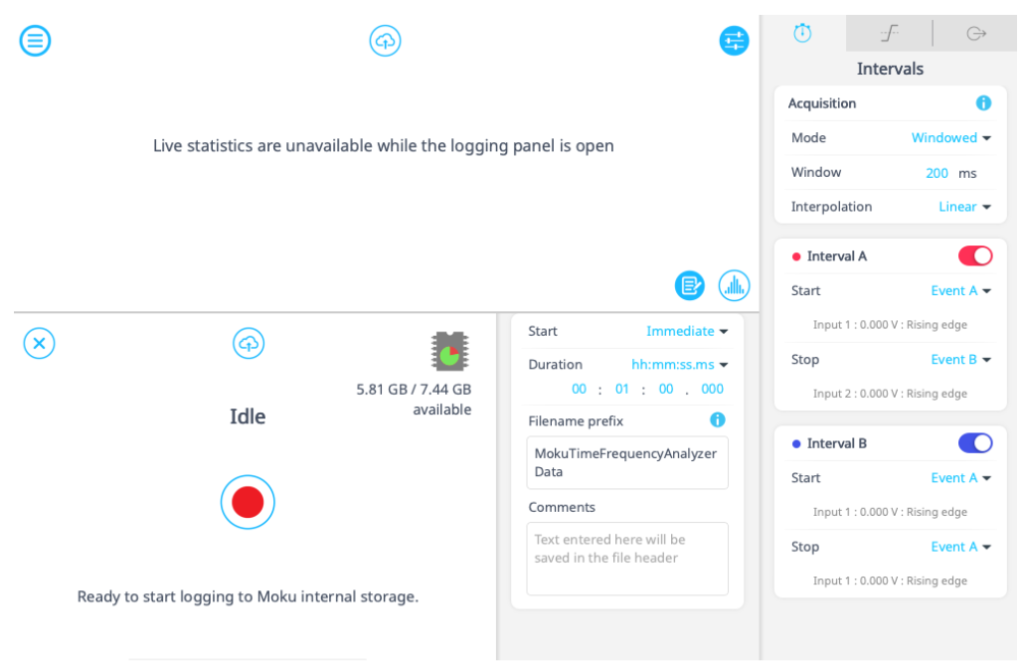
Figure 7: Log data with the Data Logger instrument embedded within the Moku Time & Frequency Analyzer.
The Moku Time & Frequency Analyzer offers a way to measure the phase difference directly, as well as estimate the signal’s phase stability, or jitter. Using this instrument, you can debug the systems in real time, with much higher precision than the Moku Oscilloscope. However, measurements of phase are still limited to a range of 2π. The increased precision also comes at the cost of time, as the average must be calculated over the window period. However, the live histograms and statistics can provide information on the average, minimum, and maximum intervals measured during a given window, which can help detect patterns in the phase. Timestamped data can track phase trends over even longer periods of time for more precise phase noise measurements.
Demodulation methods
The next two methods both make use of demodulation, or mixing of the signal with a reference oscillator (dubbed the “local oscillator”), which generates a DC output proportional to the phase difference between the signals. This approach allows for more accurate phase detection and the ability to monitor the signal over long periods of time, in addition to being more robust against noise.
Dual-phase demodulation with the Moku Lock-in Amplifier
Lock-in amplifiers use a steady reference oscillator, which can be provided by an external or internal source, to extract a periodic signal from a noisy background. A dual-phase solution like the Moku Lock-in Amplifier can recover the full phase and amplitude information from a signal, allowing both to be monitored simultaneously. To use the Moku Lock-in Amplifier to demodulate a signal, follow these steps:
1. Connect your device under test to the Moku analog front end, or set up Multi-Instrument Mode with the Moku Waveform Generator in Slot 1 and the Moku Lock-in Amplifier in Slot 2. For this example, we use a separate Moku device to generate two identical sine waves of 1 MHz frequency, with a relative phase of 45°. Make sure that the signal you want to measure is provided to Input 1 of the Lock-in Amplifier. If you’re using an external oscillator, connect it to Input 2.
2. Set up the local oscillator. In the top right corner of the Lock-in Amplifier screen, click the tool icon. Choose either “Internal” or “External (PLL)” depending on your setup. In this example, we use the latter. On the same menu, under “Auxiliary,” choose “Filtered Signal.” This will set outputs 1 and 2 to be the signal’s amplitude and phase, respectively. See Figure 8 for details.
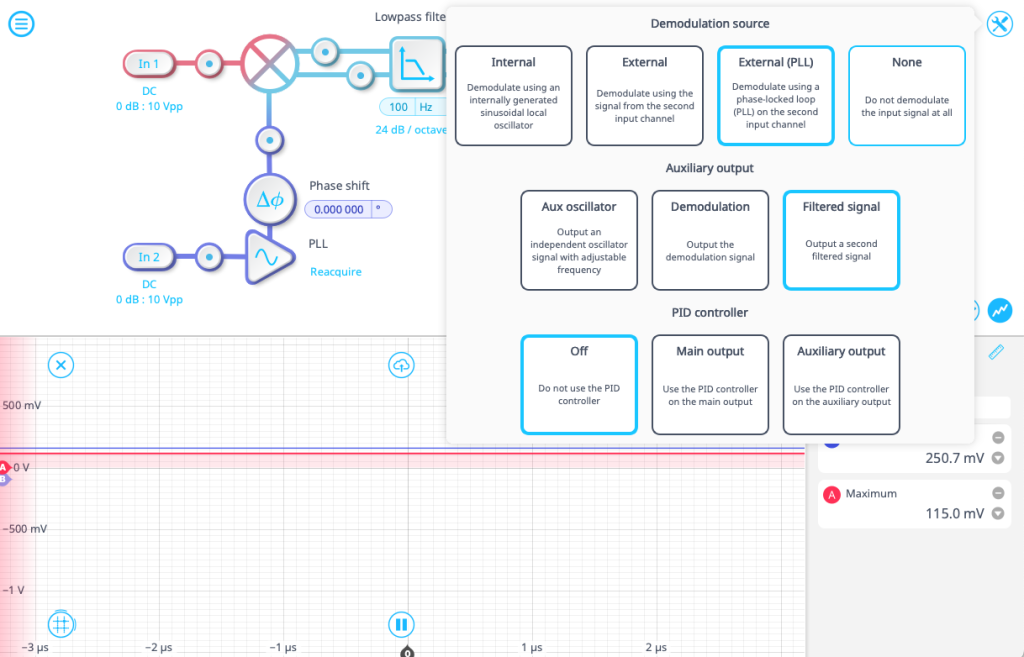
Figure 8: Demodulation and output options for the Moku Lock-in Amplifier.
3. Enable the embedded Oscilloscope (click the signal icon in the bottom right of the screen), and select the probe points before the signal enters the mixer, as shown in Figure 9. From here, you can perform a quick phase measurement identical to the oscilloscope method described earlier. This will serve as a quick check to be verified later. To alter the phase shift, use the dial above the phase-locked loop (PLL) icon. You can compare the phase before and after the PLL using the respective probe points.
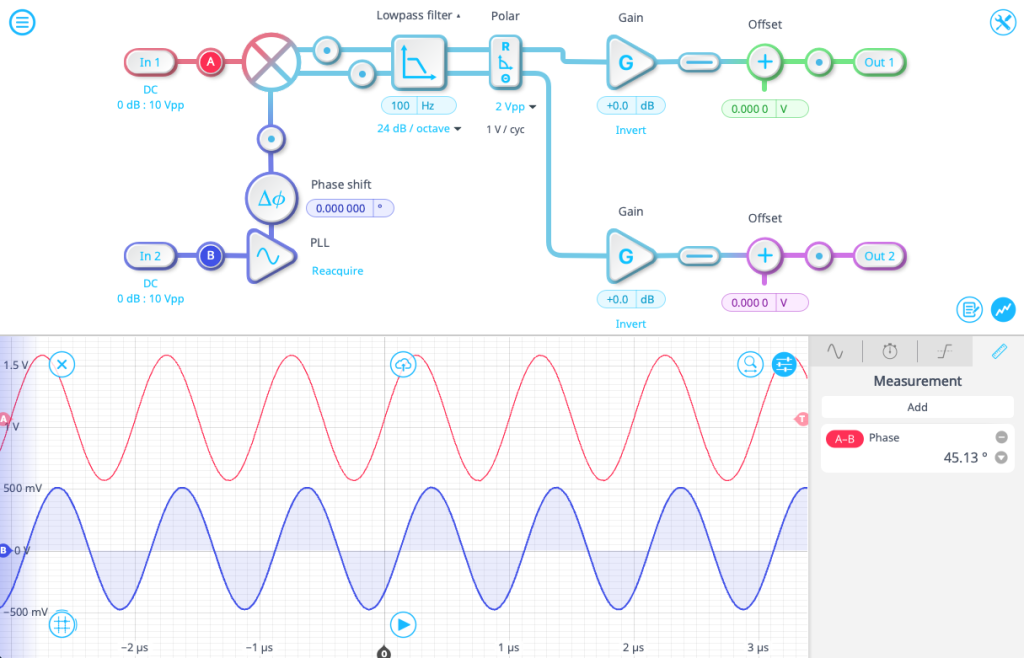
Figure 9: The embedded Oscilloscope in the Moku Lock-in Amplifier, showing the RF (radio frequency) and LO (local oscillator) signals before demodulation.
4. The mixer performs digital demodulation of the signal, multiplying it with two sine waves that are 90° out of phase with each other, as seen in the equations below:
\(\sin{\omega t} \sin{\omega t + \phi} = \frac{1}{2} \left(\cos{(\phi)} – \cos{(2 \omega t + \phi)} \right) \)
\(\sin{\omega t} \cos{\omega t + \phi} = \frac{1}{2} \left(\sin{(\phi)} + \sin{(2 \omega t + \phi)} \right) \)
If the frequencies are identical, then a “DC” (zero frequency) and a “fast” (twice the frequency) component will remain, with the magnitude of the DC component determined by the phase difference between the two signals. The next step is then to filter out the “fast” component. Do this by setting the shoulder frequency and rolloff on the lowpass filter. For this example, we use a cutoff frequency of 100 Hz with a rolloff of 24 dB/octave.
5. Check the icon next to the filter, labeled “Polar” or “Rect” depending on the current configuration. Click on the icon to change between them. Here, we will use polar notation, and the phase data will be routed to Output 2. Click the probe point near Output 2 to display the phase information on the Oscilloscope (see Figure 10). The scale between the phase and the voltage is displayed on the screen: 1 V / cyc. From this conversion factor, the relative phase between the signal and local oscillator can be obtained.
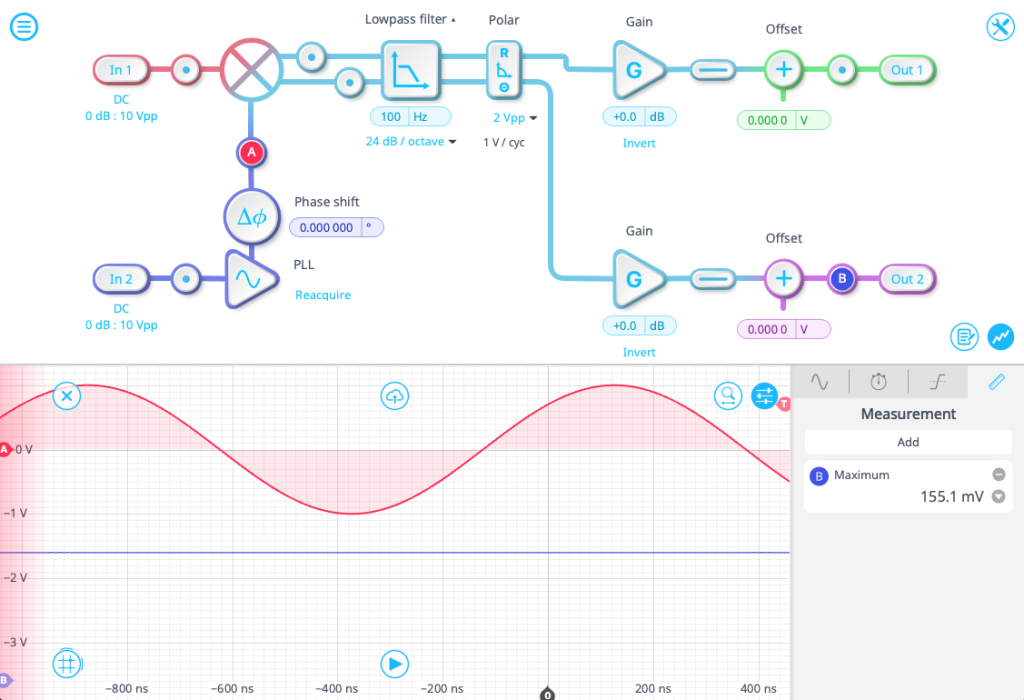
Figure 10: The output phase signal, with the magnitude of the voltage representing the calculated phase difference. The flatness of the curve indicates that the phase difference between the RF and LO signals is stable.
A digital solution like the Moku Lock-in Amplifier is an excellent tool for precise phase measurements, as it allows you to view demodulated phase and amplitude information as a function of time, with Moku offering more feedback and data logging options with additional embedded instruments.
Lock-in amplifiers also have excellent noise performance. On the other hand, their bandwidth is limited by the low-pass filter, and thus large deviations in frequency can result in the signal falling outside the filter. As with the Moku Oscilloscope and Time & Frequency Analyzer, the Lock-in Amplifier also cannot detect phase changes larger than 2π.
Phase-locked loop (PLL) with the Moku Phasemeter
The final method of phase detection uses a device known as a phasemeter. The Moku Phasemeter is conceptually similar to the Moku Lock-in Amplifier, as they both use the dual-phase demodulation to extract amplitude and phase information from an incoming signal. However, the Moku Phasemeter uses a feedback loop, or phase-locked loop (PLL), to track the incoming signal frequency rather than relying on a fixed local oscillator. As can be seen in Figure 11, the independent LO of the Lock-in Amplifier is replaced with a voltage-controlled oscillator (VCO) which outputs a frequency proportional to its input voltage. This input is provided by the demodulated phase signal, forming a negative feedback loop. If the input signal drifts away from the current VCO output, then this will generate a change in the phase voltage, which will serve to correct the output of the VCO. Finally, an integrator accumulates the error signal over time, allowing the Moku Phasemeter to track amplitude, frequency, and phase information simultaneously.
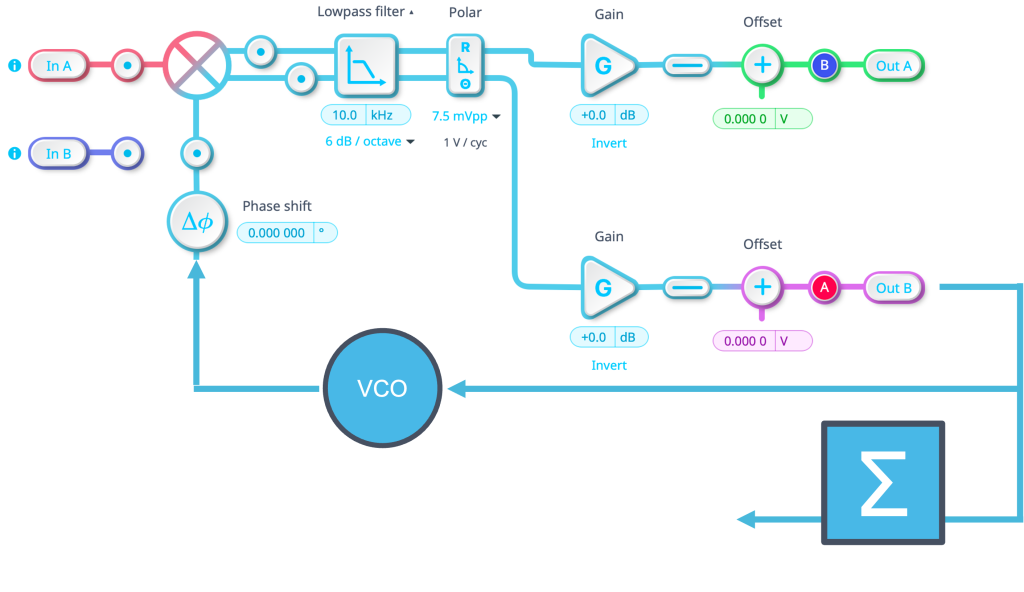
Figure 11: Block diagram of the Moku Phasemeter. The demodulation process is similar to the Moku Lock-in Amplifier, but with an additional VCO and integrator completing the phase-locked loop.
Follow these steps to track signals with the Moku Phasemeter:
1. Connect your device under test to the Moku analog front end, or set up Multi-Instrument Mode with the Waveform Generator in Slot 1 and the Phasemeter in Slot 2. For the example provided we use a separate Moku to generate two identical sine waves of 1 MHz frequency, with a relative phase of 45°.
2. On the right panel of the screen, enable inputs 1 and 2 if they are not already. You have the choice of fixing the local oscillator frequency or utilizing the PLL to automatically detect the incoming frequency. Choose a fixed frequency of 1 MHz for now, as shown in Figure 12.
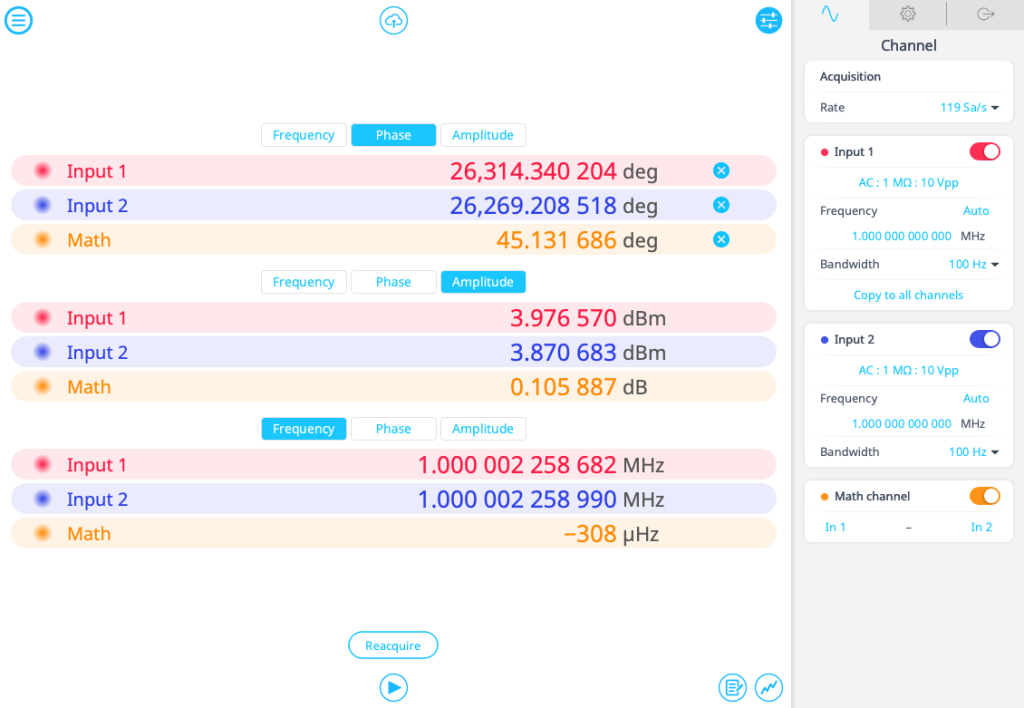
Figure 12: The basic configuration of the Moku Phasemeter’s phase-locked loop.
3. Select the desired bandwidth from the dropdown menu. As with the Moku Lock-in Amplifier, it is generally desirable to set your bandwidth as low as possible, but such that your entire signal profile fits within it. Choose 10 Hz for now.
4. The Moku Phasemeter is now measuring the phase of each signal separately, relative to the VCO frequency. To measure the phase difference between the two input signals, enable the Math channel, which will default to measuring the difference between Input 1 and Input 2.
5. The phase, frequency, and amplitude can be monitored in real time. Click on the appropriate button to display the information. These values can also be plotted in real time by clicking on the signal button in the bottom right corner, as seen in Figure 13. The recorded values will populate the plot, which can be reset by clicking “reacquire.” Note that visualizing the data in real time limits your signal acquisition to 596 Sa/s on Moku:Pro. Pay attention to the value of the Math channel, which records the phase difference between the two input signals.
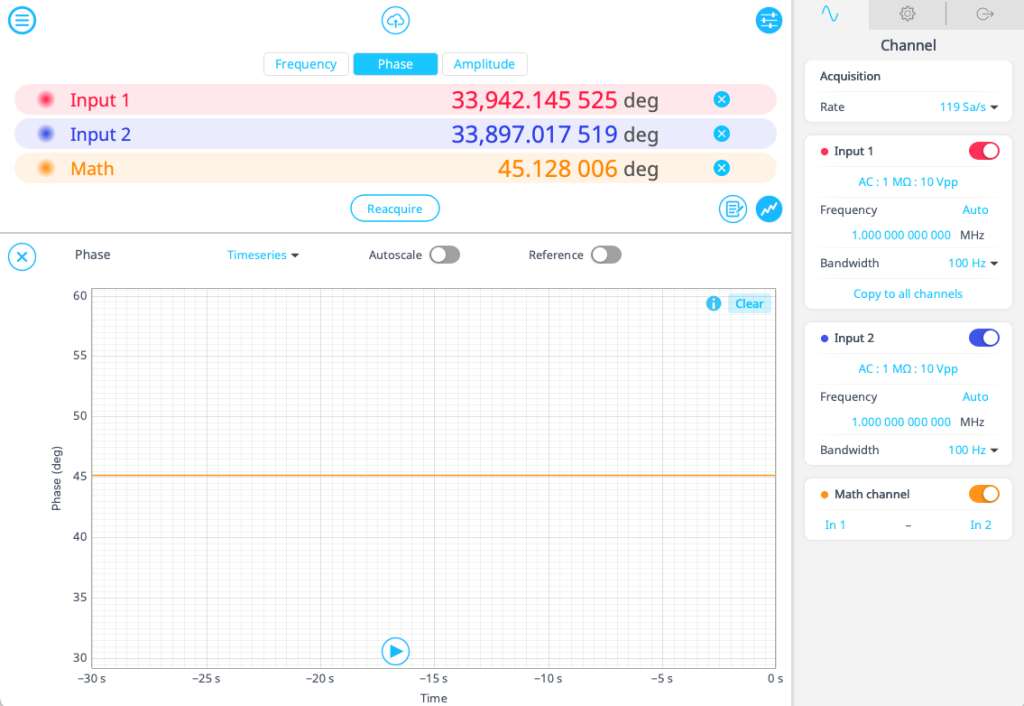
Figure 13: A real-time recording of the phase information using the Moku Phasemeter.
6. If you need faster data recording, click the data logging icon (located next to the signal visualization button). This opens up the options for the embedded Data Logger instrument. You can select the rate, duration, and delay time, and also manually begin the data collection. Once finished, you can transfer data files off the device using the cloud button, located above the start button (see Figure 14).
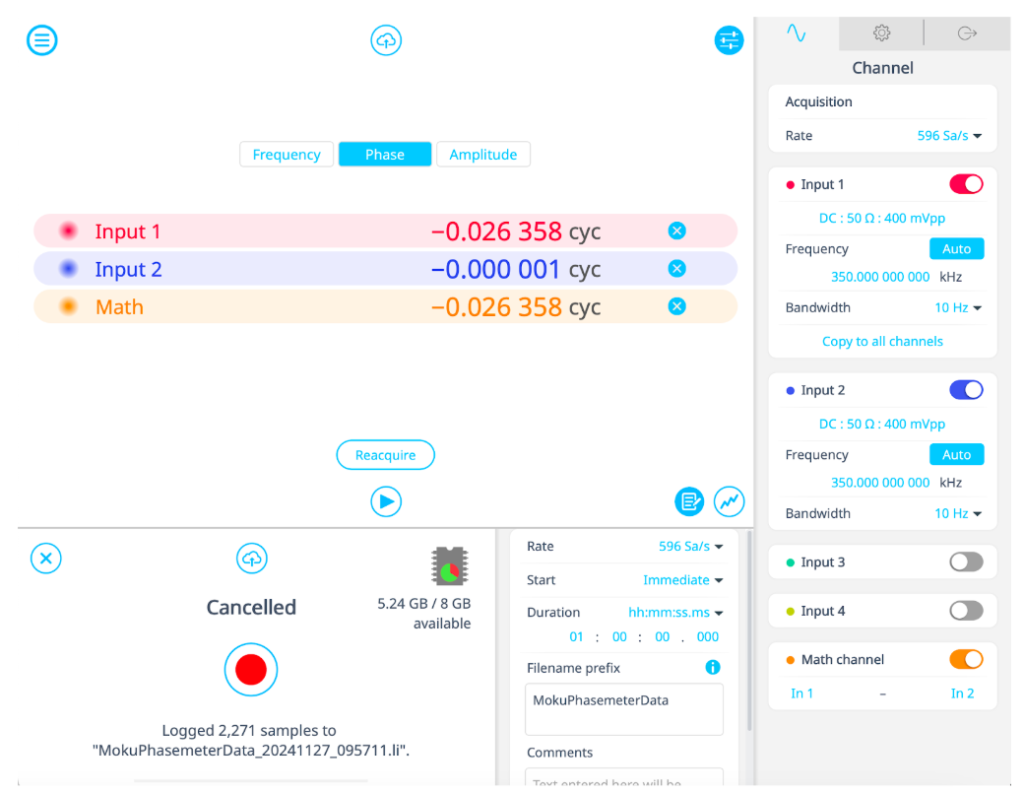 Figure 14: The Data Logger instrument embedded in the Moku Phasemeter.
The Moku Phasemeter tracks the demodulated phase, amplitude, and frequency information as a function of time for up to four input signals, with data visualization and logging options. Unlike the other three phase detection methods discussed in this guide, the Phasemeter uses a PLL that automatically tracks the input frequency over a wide range of values. It can also measure the full, unwrapped phase information with microradian precision. Compared to the Moku Lock-in Amplifier, the Phasemeter has a smaller input frequency range, and it also requires a strong input signal for the PLL to function. The Lock-in Amplifier has no such requirement and has superior performance in a low-noise environment.
Conclusion and perspectives
Accurate phase detection is critical for a wide range of scientific applications. There are many ways to measure phase, each with its own advantages and disadvantages. In this guide, we covered four methods for phase detection using the reconfigurable suite of instruments available on the FPGA-based Moku platform.
Whether you want to use the Moku Oscilloscope for rapid debugging, the Time & Frequency Analyzer for long-term stability analysis, the Lock-in Amplifier for low-noise performance, or the Phasemeter for maximum precision, Moku allows you to perform the type of measurement your setup needs. In addition, Moku provides a host of other tools such as Multi-Instrument Mode, Moku Cloud Compile, and the Neural Network for streamlined control and data analysis.
Learn more about the Moku platform here. To explore the instruments yourself, download our desktop app and select demo mode.
Questions?
Get answers to FAQs in our Knowledge Base
If you have a question about a device feature or instrument function, check out our extensive Knowledge Base to find the answers you’re looking for. You can also quickly see popular articles and refine your search by product or topic.
Join our User Forum to stay connected
Want to request a new feature? Have a support tip to share? From use case examples to new feature announcements and more, the User Forum is your one-stop shop for product updates, as well as connection to Liquid Instruments and our global user community.
